In today’s competitive and environmentally-conscious market, sustainability in manufacturing is no longer optional—it’s essential. Businesses are now expected to monitor their environmental impact closely and improve it over time. That’s where the Manufacturing Sustainability KPI Dashboard in Excel comes into play. This powerful yet easy-to-use tool helps manufacturers track key sustainability metrics, align with green goals, and make informed decisions.
Let’s dive deep into this topic and explore everything you need to know about it—from features to best practices, and frequently asked questions.
Click to Purchase Manufacturing Sustainability KPI Dashboard in Excel
What is a Manufacturing Sustainability KPI Dashboard?
A Manufacturing Sustainability KPI Dashboard is a visual Excel-based tool designed to track, monitor, and report sustainability-related Key Performance Indicators (KPIs) in the manufacturing sector. These KPIs often include metrics like energy consumption, carbon emissions, water usage, waste generated, and more.
This dashboard helps:
- Keep sustainability goals on track
- Drive process improvements
- Increase transparency
- Reduce waste and operational costs
Why Use Excel for a Sustainability KPI Dashboard?
Although there are many software tools available, Excel remains one of the most accessible and flexible platforms. Here’s why it’s a great choice:
✅ No licensing cost if you already use MS Office
✅ Highly customizable as per your organization’s needs
✅ Easy integration with data sources
✅ Interactive dashboards with charts, slicers, and conditional formatting
Key Features of the Manufacturing Sustainability KPI Dashboard
We have created a fully functional and user-friendly Manufacturing Sustainability KPI Dashboard in Excel with 7 structured worksheet tabs. Here’s a detailed overview of each:
Home Sheet
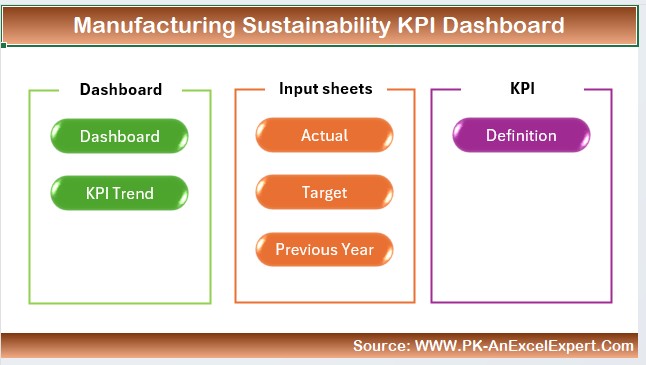
This serves as the main navigation panel. It features 6 clickable buttons that allow users to jump to various sections of the dashboard instantly. It adds a professional and organized touch.
Dashboard Sheet
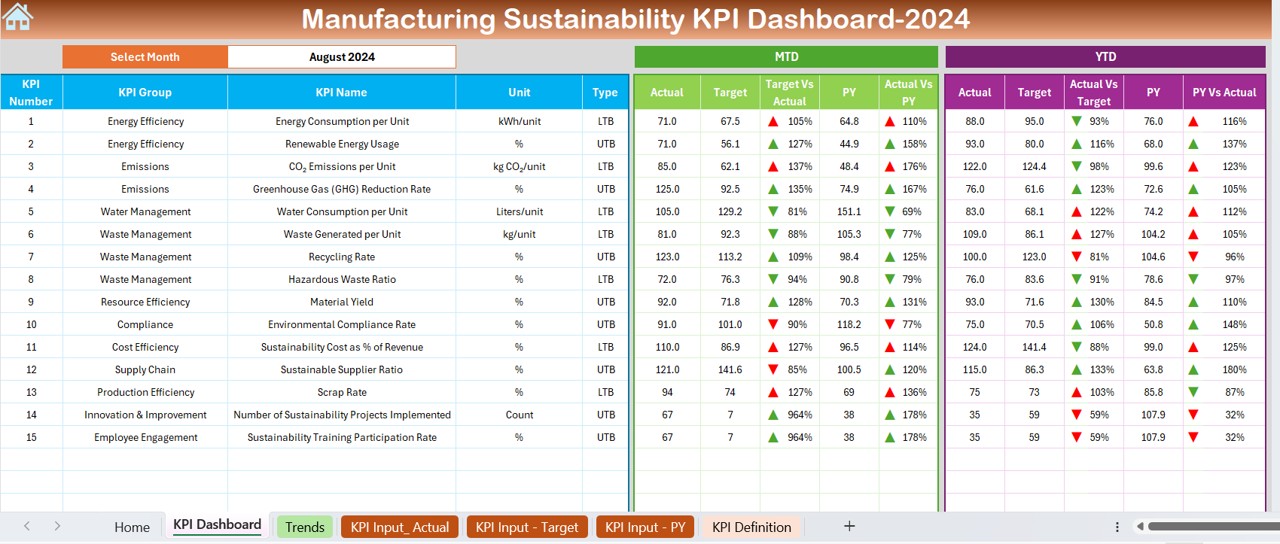
The heart of this dashboard. Here’s what it includes:
- Dropdown menu at cell D3 to select the month
- MTD (Month-to-Date) actual, target, and previous year values
- YTD (Year-to-Date) actual, target, and previous year values
- Visual cues using conditional formatting arrows to show performance trends (Up/Down)
- Dynamic updating based on selected month
KPI Trend Sheet

This sheet helps track the trend of a selected KPI:
- Dropdown in cell C3 to pick a KPI
- Shows KPI Group, Unit, Type (Lower or Upper the Better), Formula, and Definition
- Displays charts for MTD and YTD trends of Actual, Target, and Previous Year
Actual Numbers Input Sheet
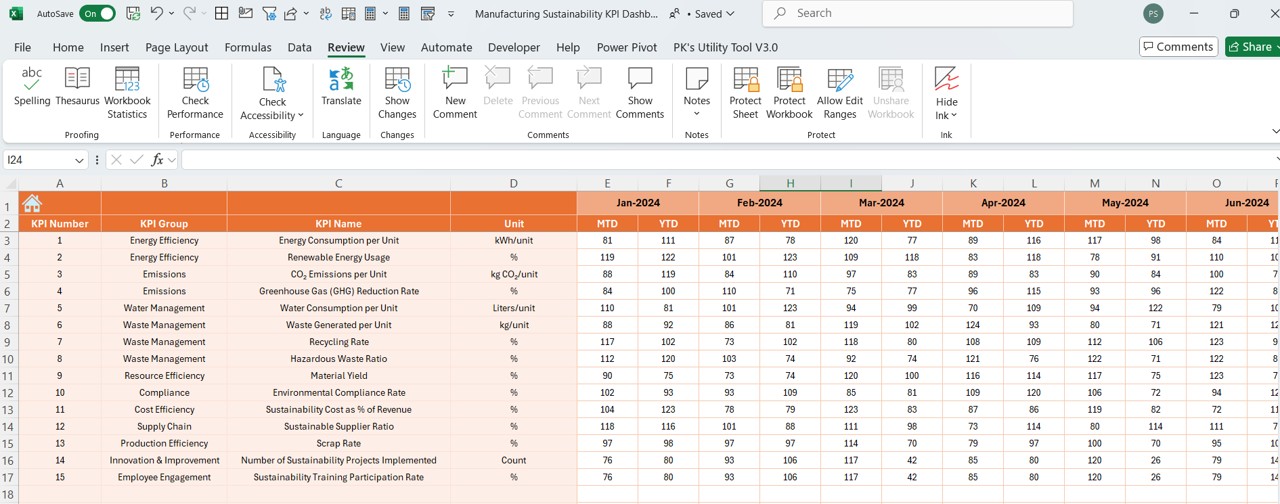
- You enter your MTD and YTD actual performance figures here:
- Month selection in cell E1
- Just input the first month of the year, and the sheet auto-adjusts accordingly
Target Sheet
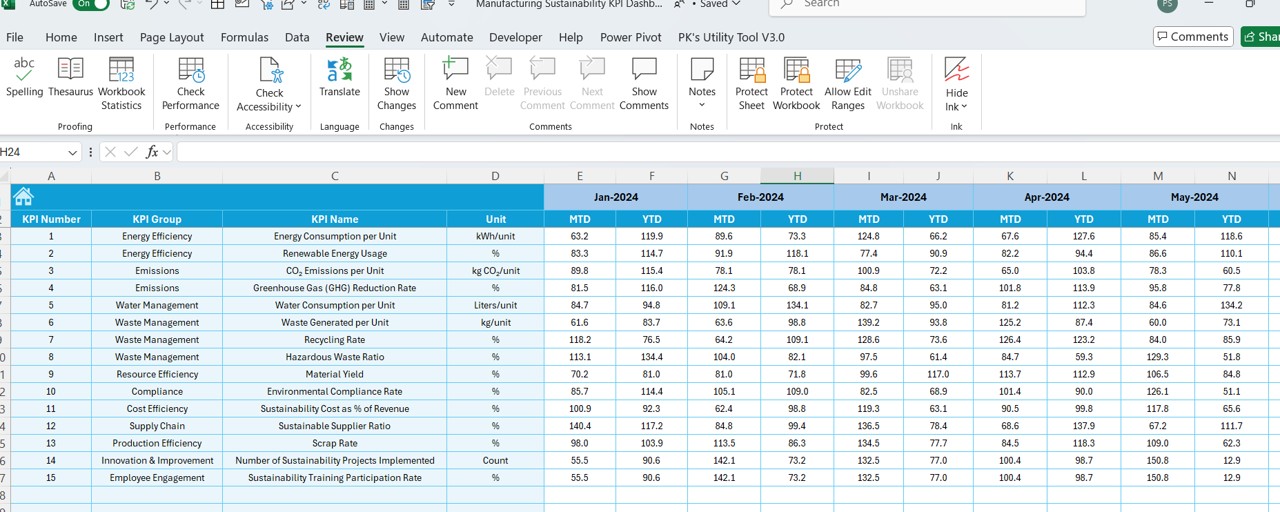
- This sheet is where you record the target numbers:
- Separate columns for MTD and YTD values for each month
Click to Purchase Manufacturing Sustainability KPI Dashboard in Excel
Previous Year Numbers Sheet
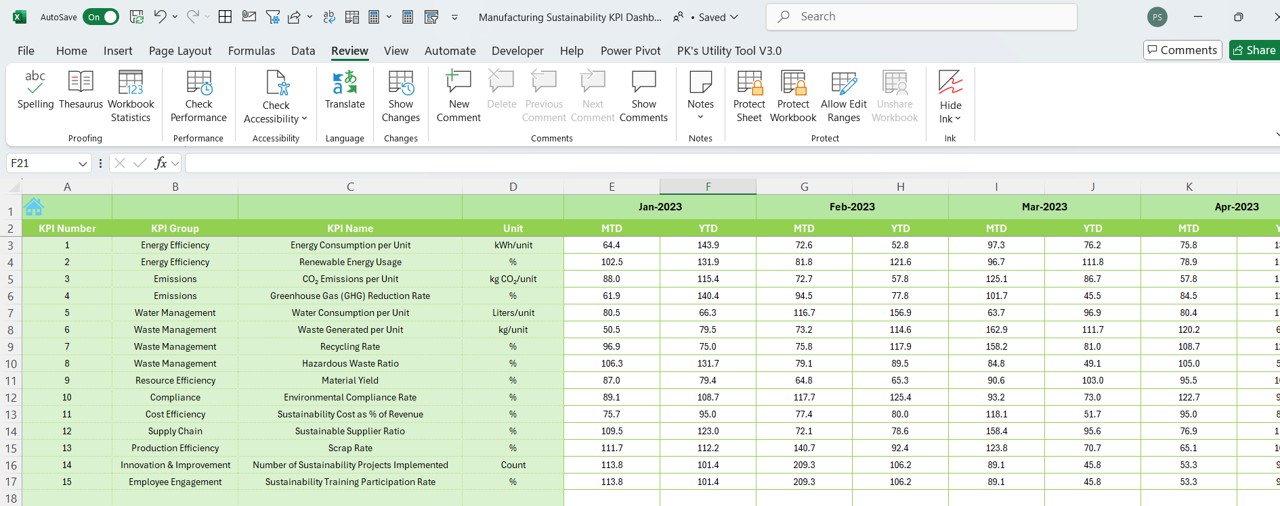
- Helps in year-over-year comparison:
- Enter monthly MTD and YTD values for the previous year
KPI Definition Sheet
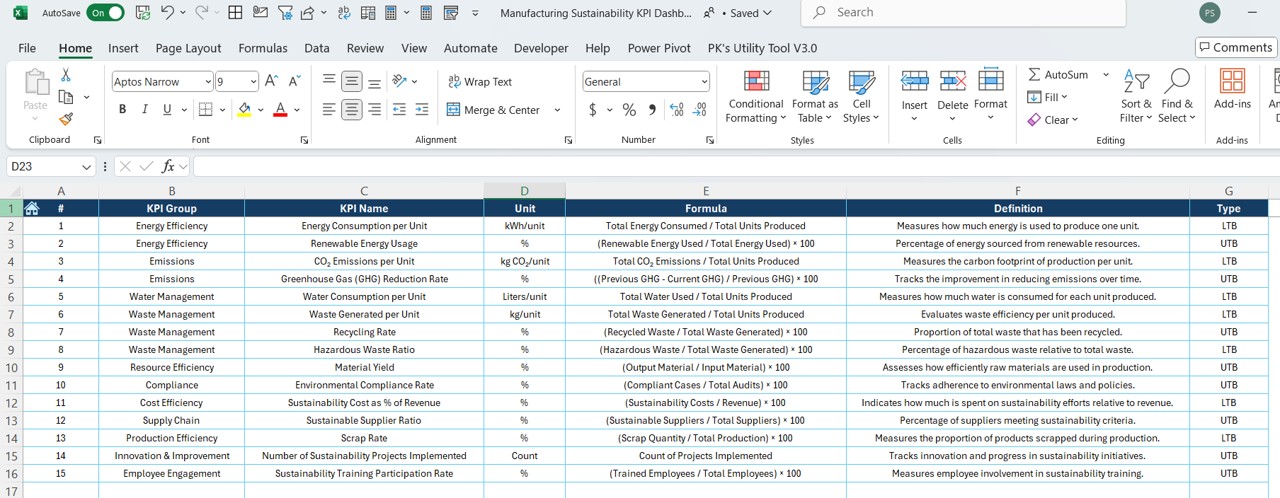
This acts as your KPI reference library:
- KPI Name
- KPI Group
- Unit of Measurement
- Formula
- Detailed KPI Definition
Advantages of Using a Manufacturing Sustainability KPI Dashboard
Let’s explore the key benefits of using this Excel-based dashboard:
🌱 Better Decision Making: Having all the KPIs in one place allows managers to make more informed decisions.
📈 Trend Monitoring: Track progress month-over-month and year-over-year with visual charts.
♻️ Improves Environmental Responsibility: Helps organizations align with eco-friendly initiatives and compliance requirements.
💡 Real-Time Insights: The dropdowns and conditional formatting offer instant visual cues about current performance.
📅 Monthly and Yearly Comparison: Enables comparison between actual, target, and last year’s numbers.
🏋️ Customizable: You can easily add more KPIs or modify existing ones based on your business goals.
Best Practices for the Manufacturing Sustainability KPI Dashboard
To get the most out of this dashboard, follow these best practices:
✅ Keep Your Data Updated: Make it a routine to update actual, target, and PY numbers on time.
✅ Use Consistent Units: Ensure all KPIs use standard units (kWh, tons, liters, etc.) to maintain consistency.
✅ Involve All Departments: Collaborate with quality, production, and environmental teams to input accurate data.
✅ Review Trends Monthly: Spend time each month analyzing the KPI trend charts to identify early warning signs.
✅ Set Realistic Targets: Avoid setting overly ambitious or low targets. Base them on historical data and forecasting.
✅ Use Visual Cues: Enhance charts and indicators with arrows, color coding, and alerts to easily spot issues.
Conclusion
A Manufacturing Sustainability KPI Dashboard in Excel is a game-changer for any manufacturer aiming to meet their green goals and improve operations. It doesn’t just simplify data tracking—it also promotes a culture of accountability, efficiency, and continuous improvement. Since Excel is widely accessible and easy to customize, this solution fits companies of all sizes.
So, if you’re serious about your sustainability journey, it’s time to implement this KPI Dashboard and start making data-driven eco-conscious decisions.
Frequently Asked Questions (FAQs)
📈 What are sustainability KPIs in manufacturing?
Sustainability KPIs track how well a company reduces its environmental impact. Common examples include energy usage, CO2 emissions, and waste management.
❓ Can I customize this dashboard for other industries?
Yes, absolutely! Although this one is designed for manufacturing, you can tweak the KPIs and sheet layout to fit any industry.
🚀 Is Excel enough for sustainability tracking?
For small to medium-sized businesses, Excel is more than enough. It offers flexibility, affordability, and ease of use.
🔍 How often should I update the dashboard?
Ideally, update it every month. This allows you to catch trends early and stay aligned with targets.
Click to Purchase Manufacturing Sustainability KPI Dashboard in Excel
Visit our YouTube channel to learn step-by-step video tutorials