Marketing plays a crucial role in business success, but how do you measure the effectiveness of your marketing strategies? The answer lies in using a Marketing KPI Dashboard. This dashboard helps businesses track and visualize the performance of their marketing efforts, aligning them with business goals and objectives.
In this guide, we’ll walk you through everything you need to know about creating and using a Marketing KPI Dashboard, from key features to best practices and opportunities for improvement. Additionally, we’ll provide answers to some frequently asked questions at the end to help you get the most out of your marketing KPIs.
What is a Marketing KPI Dashboard?
A Marketing KPI Dashboard is a data visualization tool used by marketing teams to track, measure, and analyze key performance indicators (KPIs) related to marketing activities. It provides an overview of critical marketing metrics such as lead generation, conversion rates, customer engagement, and ROI, allowing decision-makers to make informed strategies based on real-time data.
By consolidating various KPIs in one place, the Marketing KPI Dashboard enables teams to monitor their performance efficiently, identify trends, and optimize their campaigns accordingly.
Key Features of the Marketing KPI Dashboard
Below are the essential components and features of an effective Marketing KPI Dashboard:
-
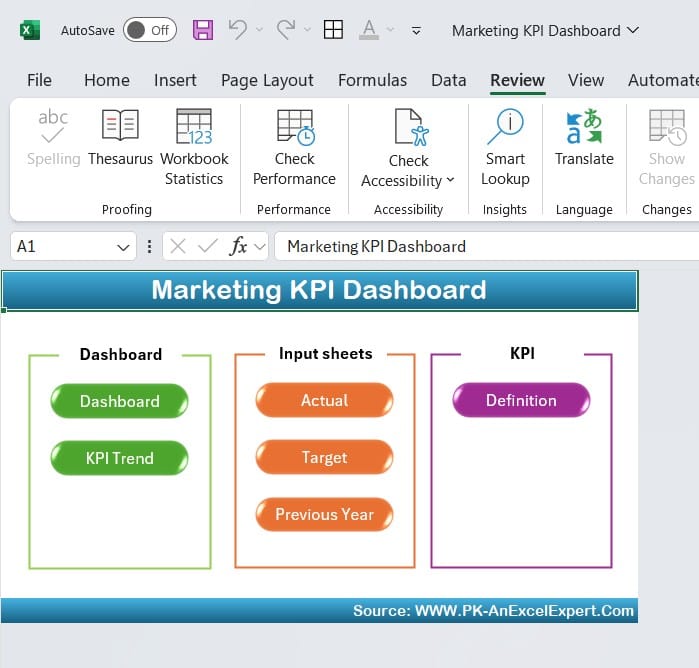
Home Sheet: Your Dashboard Index
The Home Sheet serves as the entry point for the dashboard, providing quick access to different sections. This sheet contains buttons that allow users to jump to specific areas of the dashboard, such as the main KPIs, target sheets, and trend analysis.
Click to buy Marketing KPI Dashboard In Excel
-
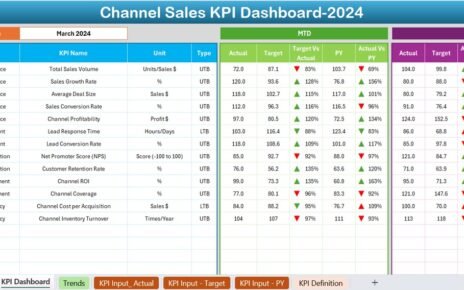
Dashboard Sheet Tab: The Heart of the Data
This is the main sheet that displays the performance of all marketing KPIs. From this sheet, users can select a specific month from a dropdown in cell D3, and the entire dashboard will automatically adjust to display the metrics for that month. The key metrics shown here include:
The conditional formatting makes it easy to see where your KPIs stand in comparison to targets or previous performance, highlighting any significant improvements or declines.

Click to buy Marketing KPI Dashboard In Excel
-
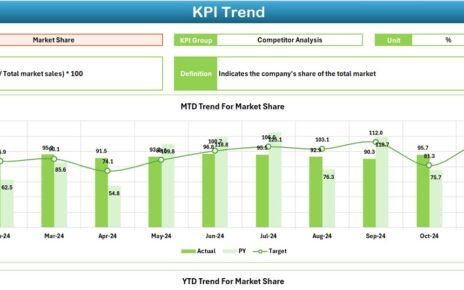
KPI Trend Sheet Tab: Track KPI Trends Over Time
This sheet enables detailed trend analysis for each KPI. By selecting a KPI from a dropdown in cell C3, the dashboard will display:

Click to buy Marketing KPI Dashboard In Excel
- KPI Group: Categorizing KPIs by function (e.g., digital marketing, social media)
- Unit of KPI: Units of measurement (e.g., percentage, absolute number)
- Type of KPI: Whether a higher or lower value is better
- KPI Formula: The calculation used for the KPI
- KPI Definition: Detailed explanation of what the KPI represents
This feature allows teams to dig deeper into the performance of individual KPIs, helping identify areas for improvement or optimization.
-
Actual Number Sheet Tab: Input Actual Performance Data
This sheet requires users to enter actual performance numbers for both MTD and YTD for each KPI. The month can be adjusted in cell E1, allowing flexibility to analyze different periods throughout the year.

Click to buy Marketing KPI Dashboard In Excel
-
Target Sheet Tab: Define KPI Targets
In this sheet, you input target numbers for each KPI, both for MTD and YTD. Establishing clear and measurable targets is essential for evaluating the success of marketing efforts.

Click to buy Marketing KPI Dashboard In Excel
-
Previous Year Number Sheet Tab: Compare with Past Performance
To track growth and performance over time, this sheet stores previous year’s data for each KPI, ensuring a comparison baseline is always available.

Click to buy Marketing KPI Dashboard In Excel
-
KPI Definition Sheet Tab: Organize and Define KPIs
In this sheet, users enter details for each KPI, including:
By clearly defining each KPI, teams can ensure consistency in how KPIs are measured and understood across the organization.

Click to buy Marketing KPI Dashboard In Excel
Why Use a Marketing KPI Dashboard?
The Marketing KPI Dashboard offers several advantages that can significantly enhance the way marketing teams track, analyze, and act on performance data.
- Real-Time Insights: Marketing efforts can shift quickly based on audience behavior, and having real-time access to KPI data enables marketers to respond and adapt swiftly.
- Data-Driven Decisions: Instead of making assumptions or guesses about campaign performance, teams can rely on concrete data to make informed decisions that align with broader business goals.
- Enhanced Collaboration: With centralized data, cross-functional teams such as sales, product, and marketing can collaborate more effectively, ensuring everyone works toward the same objectives.
Advantages of a Marketing KPI Dashboard
A Marketing KPI Dashboard is a powerful tool for marketing teams, providing several key benefits:
- Focus on Key Metrics: By highlighting the most important KPIs, a Marketing KPI Dashboard allows teams to focus on what matters most, helping them avoid getting lost in irrelevant data.
- Track Progress Over Time: With both MTD and YTD comparisons, teams can see how they are performing over short and long-term periods, allowing for continuous improvement.
- Faster Course Correction: When a KPI shows poor performance, teams can quickly adjust strategies or campaigns, reducing the risk of long-term underperformance
- Improved Stakeholder Communication: Marketing dashboards make it easier to communicate performance to senior management or external stakeholders, providing a clear and concise snapshot of the marketing function’s impact.
Best Practices for Using a Marketing KPI Dashboard
To get the most out of your Marketing KPI Dashboard, follow these best practices:
- Keep It Simple and Focused: Don’t overwhelm your dashboard with too many metrics. Focus on 5-10 key KPIs that align with your marketing goals.
- Regularly Update Data: Ensure that your actual performance numbers and targets are updated regularly to keep your dashboard relevant and accurate.
- Use Conditional Formatting for Visual Cues: Conditional formatting, such as up and down arrows, helps you easily spot trends and issues at a glance. This visual element ensures that key insights aren’t missed in a sea of data.
- Define KPIs Clearly: Provide clear definitions for each KPI so that everyone on the team knows exactly what they are tracking and why it matters. Misunderstanding a KPI’s definition can lead to misaligned strategies.
- Automate Where Possible: Use automation tools like Excel or Google Sheets to automatically update the dashboard based on real-time data, minimizing manual data entry and reducing the risk of errors.
Opportunities for Improvement in Marketing KPI Dashboards
While a Marketing KPI Dashboard can be highly effective, there are always areas for improvement:
- Automate Data Collection: If your team is manually entering data into the dashboard, there is an opportunity to integrate automated data feeds from platforms like Google Analytics or social media tools. This reduces errors and saves time.
- Incorporate Predictive Analytics: Adding predictive analytics capabilities to your dashboard can help teams anticipate future performance based on historical trends, enabling more proactive strategy development.
- Enhanced Visuals: If your dashboard is purely numbers-based, incorporating more advanced visuals such as bar graphs, line charts, and heatmaps can make the data easier to interpret and action.
Conclusion
A Marketing KPI Dashboard is essential for marketing teams that want to measure their performance and align their efforts with business goals. By focusing on key KPIs, tracking performance over time, and using data to make informed decisions, teams can optimize their strategies and achieve better results.
Frequently Asked Questions
Q. What are the most important KPIs to include in a Marketing KPI Dashboard?
The most important KPIs depend on your business goals, but common ones include conversion rates, lead generation, ROI, and customer engagement.
Q. How often should I update my Marketing KPI Dashboard?
It’s best to update your dashboard in real-time if possible, but at a minimum, it should be updated weekly or monthly, depending on the speed of your marketing campaigns.
Q.Can I use a Marketing KPI Dashboard for long-term planning?
Yes! By tracking both MTD and YTD performance, a Marketing KPI Dashboard provides insights that are useful for both short-term adjustments and long-term strategic planning.
Q. How do I set realistic targets for my marketing KPIs?
To set realistic targets, base them on historical performance, industry benchmarks, and the specific goals of your business or campaign. Make sure to adjust these targets as new data becomes available.
Visit our YouTube channel to learn step-by-step video tutorials
Click to buy Marketing KPI Dashboard In Excel