In today’s competitive digital landscape, tracking mobile app engagement is crucial for understanding user behavior, improving retention, and optimizing marketing efforts. A well-structured Mobile App Engagement KPI Dashboard in Excel provides a comprehensive view of key performance indicators (KPIs), helping businesses make data-driven decisions.
This article explores how to create and use a Mobile App Engagement KPI Dashboard in Excel, covering its features, advantages, best practices, and frequently asked questions.
Click to Mobile App Engagement KPI
What is a Mobile App Engagement KPI Dashboard?
A Mobile App Engagement KPI Dashboard is a visual reporting tool that consolidates key performance metrics related to user engagement in a single place. It allows businesses to track app usage, retention rates, conversions, and other essential KPIs.
This Excel-based dashboard offers an easy-to-use interface, helping analysts, marketers, and developers monitor their app’s performance effectively.
Key Features of the Mobile App Engagement KPI Dashboard
This ready-to-use template consists of 7 worksheets, each serving a unique function:
Home Sheet
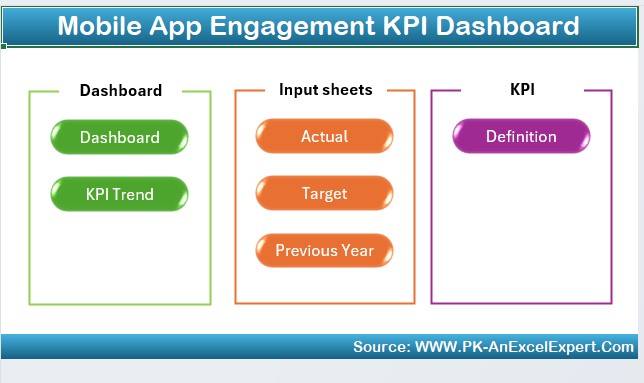
- Navigation Hub: Provides an index with 6 buttons for quick access to other sheets.
- User-Friendly Interface: Enables seamless movement between different sections of the dashboard.
Click to Mobile App Engagement KPI
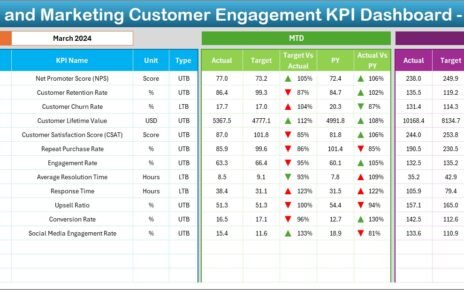
Dashboard Sheet Tab
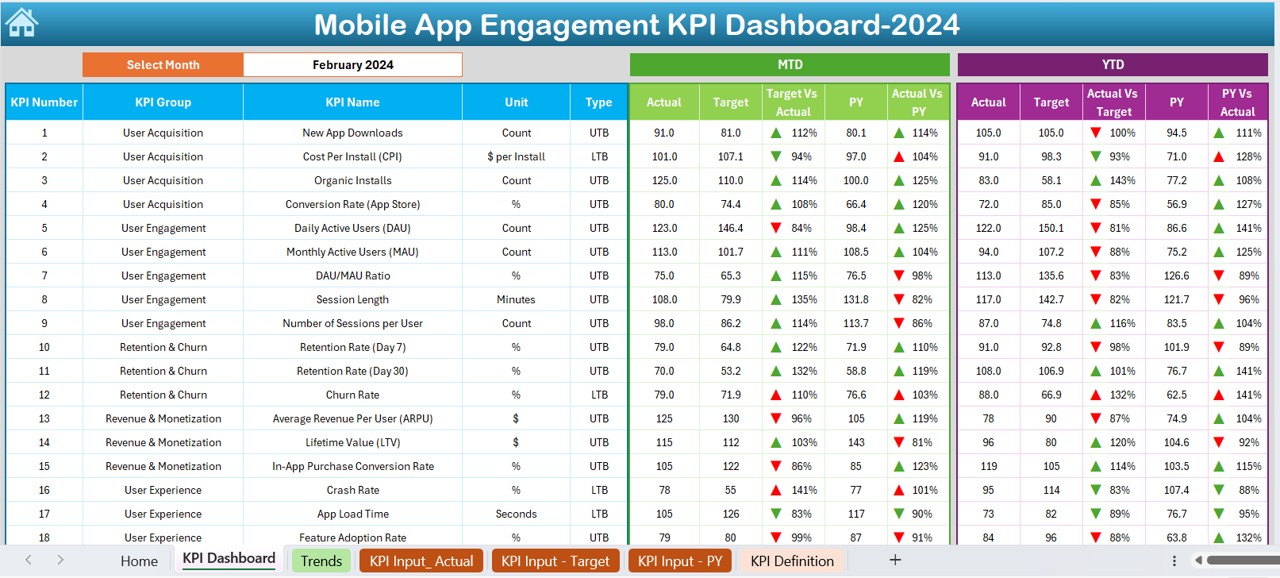
- Main Reporting Interface: Displays all KPI-related information.
- Month Selection: Drop-down in D3 allows users to select a specific month.
- Real-Time Data Updates:
- MTD (Month-to-Date) and YTD (Year-to-Date) data for Actual, Target, and Previous Year.
- Comparisons with Conditional Formatting (up/down arrows) for easy visualization.
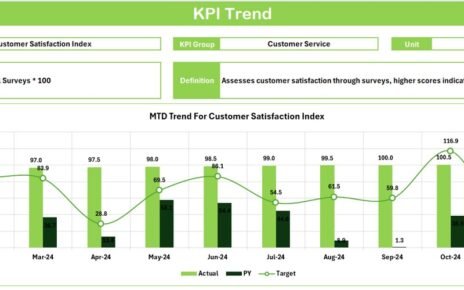
KPI Trend Sheet Tab

- Dynamic KPI Selection: Drop-down in C3 to choose a specific KPI.
- Comprehensive KPI Details:
- KPI Group, Unit, Type (Lower is Better/Upper is Better), Formula, and Definition.
- Trend Analysis:
- MTD and YTD trend charts for Actual, Target, and PY (Previous Year) values.
Click to Mobile App Engagement KPI
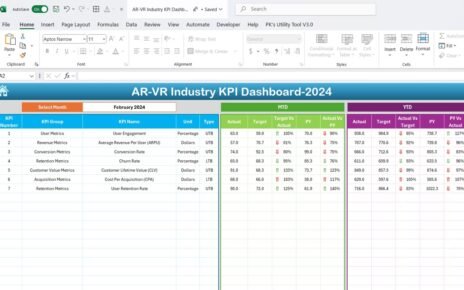
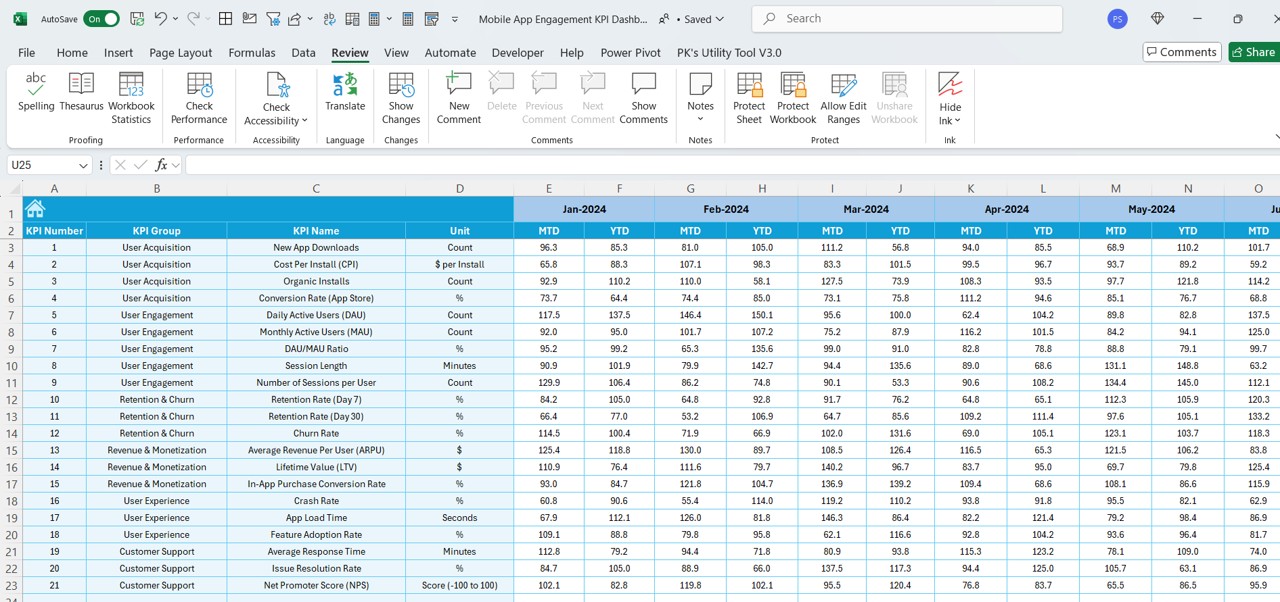
Actual Numbers Input Sheet
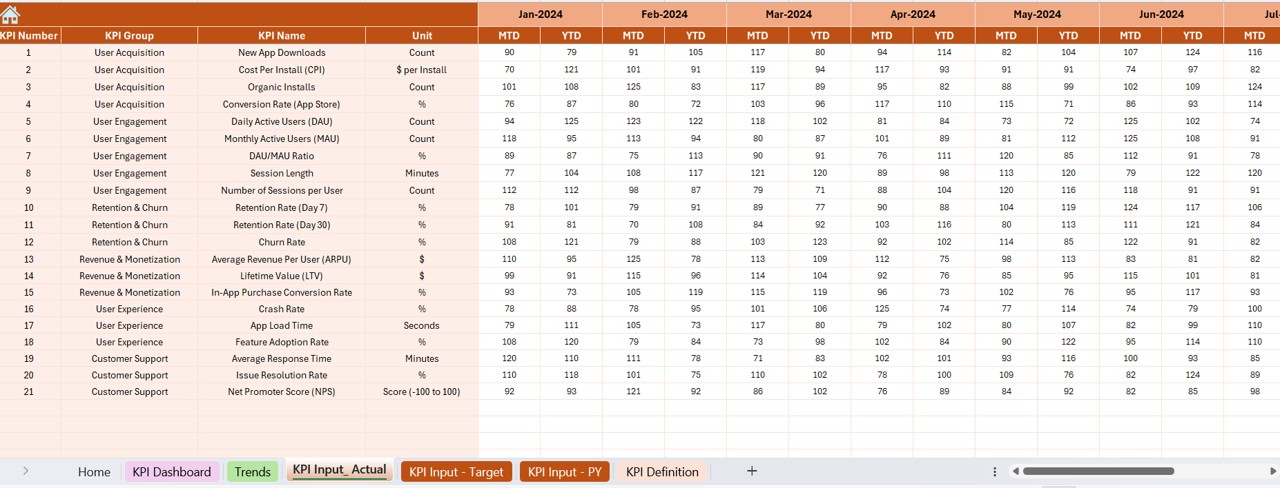
- Data Entry Sheet for recording MTD and YTD actual values.
- Automatic Month Update: Change the first month of the year in E1, and all months update accordingly.
Target Sheet Tab
- Target Input Section: Enter monthly and YTD target values for each KPI.
Previous Year Number Sheet Tab
- Historical Data Tracking: Enter MTD and YTD figures for the previous year for comparison.
KPI Definition Sheet Tab
- Detailed KPI Information:
- KPI Name, Group, Unit, Formula, and Definition for easy reference.
Advantages of the Mobile App Engagement KPI Dashboard
📈 Improved Data Visualization: Presents data in clear charts, tables, and conditional formatting indicators, making trends easier to analyze.
🔄 Real-Time Performance Tracking: Automatic updates when new data is entered, ensuring real-time insights.
🎯 Better Decision-Making: Helps businesses optimize user engagement, marketing strategies, and retention efforts based on key insights.
📊 Customizable & Scalable: Can be tailored to specific business needs by adding more KPIs or modifying the formulae.
🕵️♂️ Identifies Areas for Improvement: Highlights KPIs falling behind targets, enabling proactive decision-making.
Best Practices for Using the Mobile App Engagement KPI Dashboard
✅ Define Clear KPI Goals: Identify the most relevant engagement KPIs based on business objectives (e.g., daily active users, session duration, churn rate).
✅ Ensure Data Accuracy: Regularly update the Actual, Target, and Previous Year sheets to maintain data integrity.
✅ Leverage Conditional Formatting: Utilize built-in up/down arrows and color indicators to highlight performance trends.
✅ Regularly Analyze Trends: Use the KPI Trend Sheet to monitor monthly and yearly performance and adjust strategies accordingly.
✅ Customize for Business Needs: Modify the KPI definitions, formulas, and dashboard visuals to align with unique business goals.
Conclusion
A Mobile App Engagement KPI Dashboard in Excel is a powerful tool for tracking user behavior, optimizing retention strategies, and making data-driven decisions. By leveraging the features of this dashboard, businesses can identify trends, measure success, and drive growth in the competitive mobile app market.
Click to Mobile App Engagement KPI
Frequently Asked Questions (FAQs)
What are the most important KPIs for mobile app engagement?
- Some of the most crucial KPIs include:
- Daily Active Users (DAU) & Monthly Active Users (MAU)
- Session Duration & Frequency
- Churn Rate & Retention Rate
- User Acquisition & Conversion Rate
- In-App Purchases & Revenue per User
How often should I update the KPI dashboard?
- Ideally, the dashboard should be updated monthly to reflect the most recent engagement data.
- If tracking real-time metrics, update it weekly or even daily.
Can I add more KPIs to the dashboard?
- Yes! The dashboard is fully customizable, allowing users to add or modify KPIs based on their app’s unique needs.
How does this dashboard help in decision-making?
By providing real-time insights into user engagement, retention, and growth trends, businesses can make data-driven decisions to enhance user experience and maximize revenue.
Is this dashboard suitable for all mobile apps?
- Yes! Whether you’re running a gaming app, e-commerce platform, or social media app, this dashboard can be tailored to track relevant engagement metrics.
Click to Mobile App Engagement KPI
Visit our YouTube channel to learn step-by-step video tutorials