In the fast-paced world of marketing, tracking performance across multiple channels is crucial to understanding how well strategies are working. To help marketers effectively monitor their campaigns, a Multichannel Marketing KPI Dashboard in Excel offers an efficient way to centralize and analyze key metrics. This article will guide you through the setup of a powerful Multichannel Marketing KPI Dashboard in Excel, explaining its features, KPIs, advantages, and best practices.
Table of Contents
ToggleIntroduction to Multichannel Marketing KPI Dashboard in Excel
A Multichannel Marketing KPI Dashboard is an essential tool for tracking the performance of marketing campaigns across various platforms, such as social media, email, search engines, and more. This dashboard consolidates key performance indicators (KPIs) into one place, allowing you to easily monitor, compare, and make data-driven decisions to improve your marketing strategies.
With Excel’s powerful features, including drop-down lists, conditional formatting, and dynamic charts, the Multichannel Marketing KPI Dashboard provides an organized, user-friendly way to track multiple marketing metrics in real-time.
Key Features of the Multichannel Marketing KPI Dashboard
The dashboard consists of seven main worksheets that work together to provide a comprehensive view of marketing performance. Below are the key features of this template:
1. Home Sheet Tab
The Home Sheet serves as the dashboard’s starting point. It allows users to easily navigate to other sheets using clickable links. This sheet provides a centralized location for accessing all the key metrics and reports.

Click to buy Multichannel Marketing KPI Dashboard in Excel
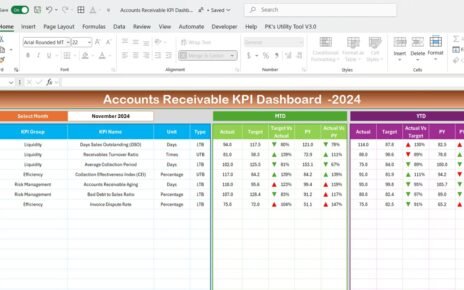
2. Dashboard Sheet Tab
The Dashboard Sheet is the heart of the dashboard, where all the essential KPIs are displayed. This tab provides an overview of the marketing performance for the selected month. You can choose the month from a drop-down menu (located in Range D3), and the data will automatically update based on that selection. Here, you’ll find:
-
MTD (Month-to-Date) Actuals: Displays the actual data for the current month.
-
Target vs Actual Comparison: Visualizes how your performance compares to the target.
-
PY (Previous Year) Comparison: Compares the current month’s performance to the same month from the previous year.

3. KPI Trend Sheet Tab
The KPI Trend Sheet allows you to select a specific KPI from a drop-down list (located in Range C3). For each KPI, you can view:
-
The KPI Group
-
The Unit of measurement
-
The KPI Type (whether it is a Lower the Better (LTB) or Upper the Better (UTB) metric)
-
The Formula for calculation
-
The Definition of the KPI
This sheet helps provide a deeper understanding of each metric’s purpose and how it is calculated.

Click to buy Multichannel Marketing KPI Dashboard in Excel
4. Actual Number Sheet Tab
The Actual Number Sheet is where you enter the actual data for each KPI, both for the MTD and YTD (Year-to-Date). The sheet allows you to select the month from Range E1, which updates the dashboard to show the most recent actual data.

5. Target Sheet Tab
In the Target Sheet, you input the target values for each KPI for the specific month. This allows for side-by-side comparison of actual performance versus the set targets, both for MTD and YTD.

6. Previous Year Number Sheet Tab
This sheet is used to input the previous year’s data for each KPI, which will help you compare current year performance against the same period from the previous year. Enter the data for MTD and YTD here.

Click to buy Multichannel Marketing KPI Dashboard in Excel
7. KPI Definition Sheet Tab
The KPI Definition Sheet contains essential information about each KPI, including:
-
KPI Name
-
KPI Group
-
Unit
-
Formula
-
KPI Definition
This sheet provides the definitions and formulas for each KPI, ensuring consistency and clarity in reporting.

Advantages of Using a Multichannel Marketing KPI Dashboard
- Centralized Data Collection: The dashboard centralizes data from multiple marketing channels, making it easy to monitor all your KPIs in one place. No more jumping between different platforms and reports—everything you need is right at your fingertips.
- Real-Time Monitoring: With dynamic charts and drop-down lists, the dashboard updates automatically when new data is entered. This allows you to monitor performance in real-time and quickly make adjustments to optimize your campaigns.
- Easy Comparison; The dashboard offers side-by-side comparisons of actual performance versus targets and previous year data. This comparison makes it easy to identify areas for improvement and ensure that your marketing strategies are on track.
- Actionable Insights: By visualizing KPIs with up/down arrows, conditional formatting, and trend analysis, the dashboard gives you clear insights into how well each marketing channel is performing. These insights are crucial for making data-driven decisions and refining your strategies.
- Customizable for Your Needs: This dashboard is highly customizable. You can add or remove KPIs based on your specific marketing goals, and tailor the data input and formulas to match your unique business requirements.
Opportunities for Improvement in the Multichannel Marketing KPI Dashboard
Click to buy Multichannel Marketing KPI Dashboard in Excel
While the Multichannel Marketing KPI Dashboard in Excel is a powerful tool, there are always areas for improvement. Below are some opportunities to enhance its functionality:
- Integration with Marketing Platforms: Currently, the dashboard requires manual data entry. However, integrating Excel with marketing platforms (like Google Analytics, Facebook Ads, or Mailchimp) through APIs or third-party tools could automate data collection, saving time and reducing human error.
- Advanced Data Visualization: While the current dashboard uses basic charts and conditional formatting, incorporating more advanced data visualizations like heatmaps or geolocation maps could provide even deeper insights into marketing performance.
- Predictive Analytics: Implementing predictive analytics using historical data could help forecast future trends and set more accurate targets. By leveraging machine learning algorithms or advanced Excel functions, the dashboard could provide more actionable insights for campaign optimization.
Best Practices for Using a Multichannel Marketing KPI Dashboard
To get the most out of your Multichannel Marketing KPI Dashboard, follow these best practices:
- Regularly Update Data: Make sure to update your dashboard with the latest data, including actual numbers, targets, and previous year data. Regular updates ensure that the dashboard reflects the most current state of your marketing performance.
- Customize KPIs to Match Business Goals: While the default KPIs in the dashboard are suitable for most marketing campaigns, take the time to customize them based on your specific business goals. This will ensure that the dashboard tracks the metrics that matter most to your organization.
- Utilize Trend Analysis: Use the KPI Trend Sheet to monitor performance trends over time. Analyzing trends can help you spot patterns in your marketing efforts and make proactive adjustments to campaigns.
- Set Realistic Targets: When entering target values in the Target Sheet, make sure they are achievable and based on historical performance. Unrealistic targets can lead to demotivated teams and skewed data.
- Collaborate with Your Team: Excel’s sharing and collaboration features make it easy to work with multiple team members. Ensure that everyone involved in the marketing process has access to the dashboard and can input data as needed.
Frequently Asked Questions (FAQ)
What is a Multichannel Marketing KPI Dashboard?
A Multichannel Marketing KPI Dashboard is a tool that consolidates key performance indicators (KPIs) from multiple marketing channels into one place for easier monitoring and analysis. It helps marketers track the success of campaigns across different platforms and compare actual performance with targets.
What are the key KPIs to track in a Multichannel Marketing KPI Dashboard?
Key KPIs include:
-
Click-Through Rate (CTR)
-
Conversion Rate
-
Cost per Acquisition (CPA)
-
Return on Investment (ROI)
-
Customer Lifetime Value (CLV)
These KPIs can vary depending on your business goals and marketing channels.
How do I update the Multichannel Marketing KPI Dashboard?
Click to buy Multichannel Marketing KPI Dashboard in Excel
To update the dashboard, simply input the latest data for actual performance, targets, and previous year data in the respective sheets. The dashboard will automatically refresh and display the updated information.
Can I customize the KPIs in the dashboard?
Yes, the dashboard is highly customizable. You can add, remove, or modify KPIs to better align with your specific marketing goals.
Is this dashboard suitable for all marketing channels?
Yes, the dashboard can be used to track performance across various marketing channels, including social media, email marketing, paid search, organic search, and more. You can customize the KPIs for each channel based on your needs.
Conclusion
The Multichannel Marketing KPI Dashboard in Excel is an essential tool for any marketer looking to streamline their campaign tracking and performance monitoring. With its user-friendly design, customizable KPIs, and real-time data updates, this dashboard simplifies the process of analyzing marketing efforts across multiple channels. By following best practices, keeping the dashboard updated, and continuously improving your approach, you can make more informed decisions, optimize your campaigns, and achieve better results.