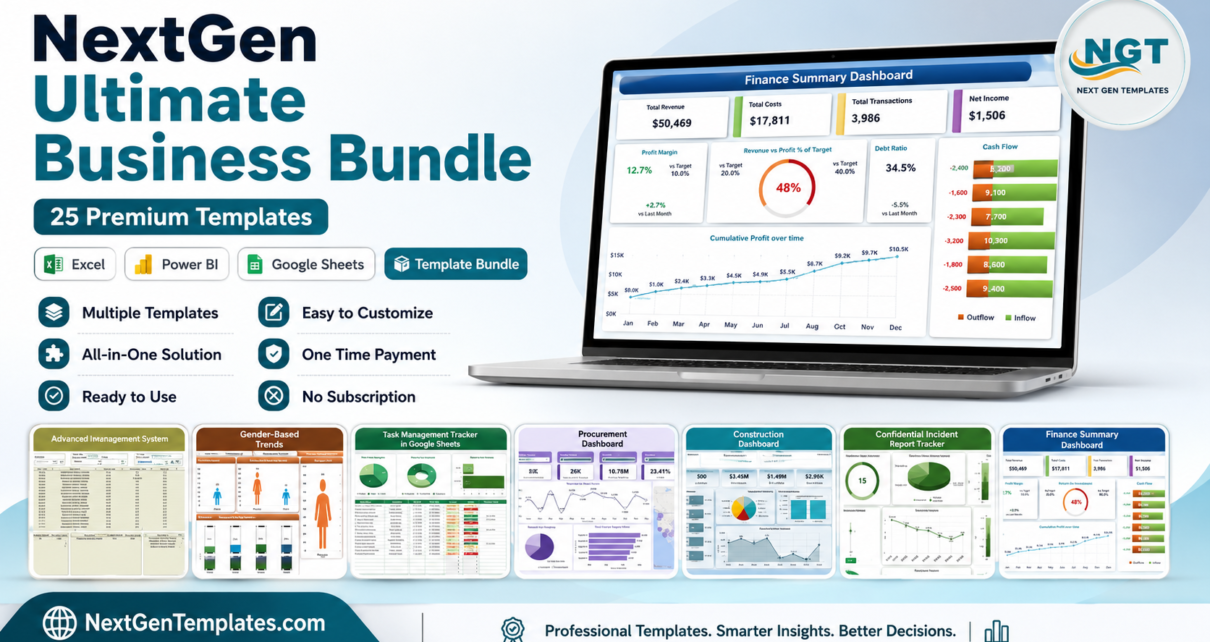
If you run or support a business, you already know the pain of stitching together reports from a dozen different tools. The NextGen Ultimate Business Bundle solves that in one download — 25 professional templates across Excel, Power BI and Google Sheets, covering finance, HR, operations, sales, IT, healthcare and more. Bought individually these templates cost $372.75; in this bundle they are just $99.99, a saving of $272.76 (73%).
NextGen Ultimate Business Bundle — 25 Templates, One Price
$372.75 → $99.99 (save 73%)
Why the NextGen Ultimate Business Bundle Is Worth It
Most dashboard packs focus on a single platform or a single department. This bundle is deliberately broad: it gives a whole organisation the reporting it needs, whatever tools each team prefers. You get 25 templates built to a consistent professional standard — clean layouts, pre-built KPIs, charts and slicers — so any team member can drop in their data and present results the same day.
Two of the items are complete management systems rather than single dashboards: a VBA-powered Hospital Management System and an Advanced Inventory Management System, both of which would normally be sold as standalone applications.
What’s Included in the NextGen Ultimate Business Bundle
Manufacturing Dashboard in Excel (Excel)
Track OEE, downtime, scrap and output across production lines.
 Manufacturing Dashboard in Excel
Finance Summary Dashboard in Excel (Excel)
Consolidate revenue, expenses, profit and cash position at a glance.
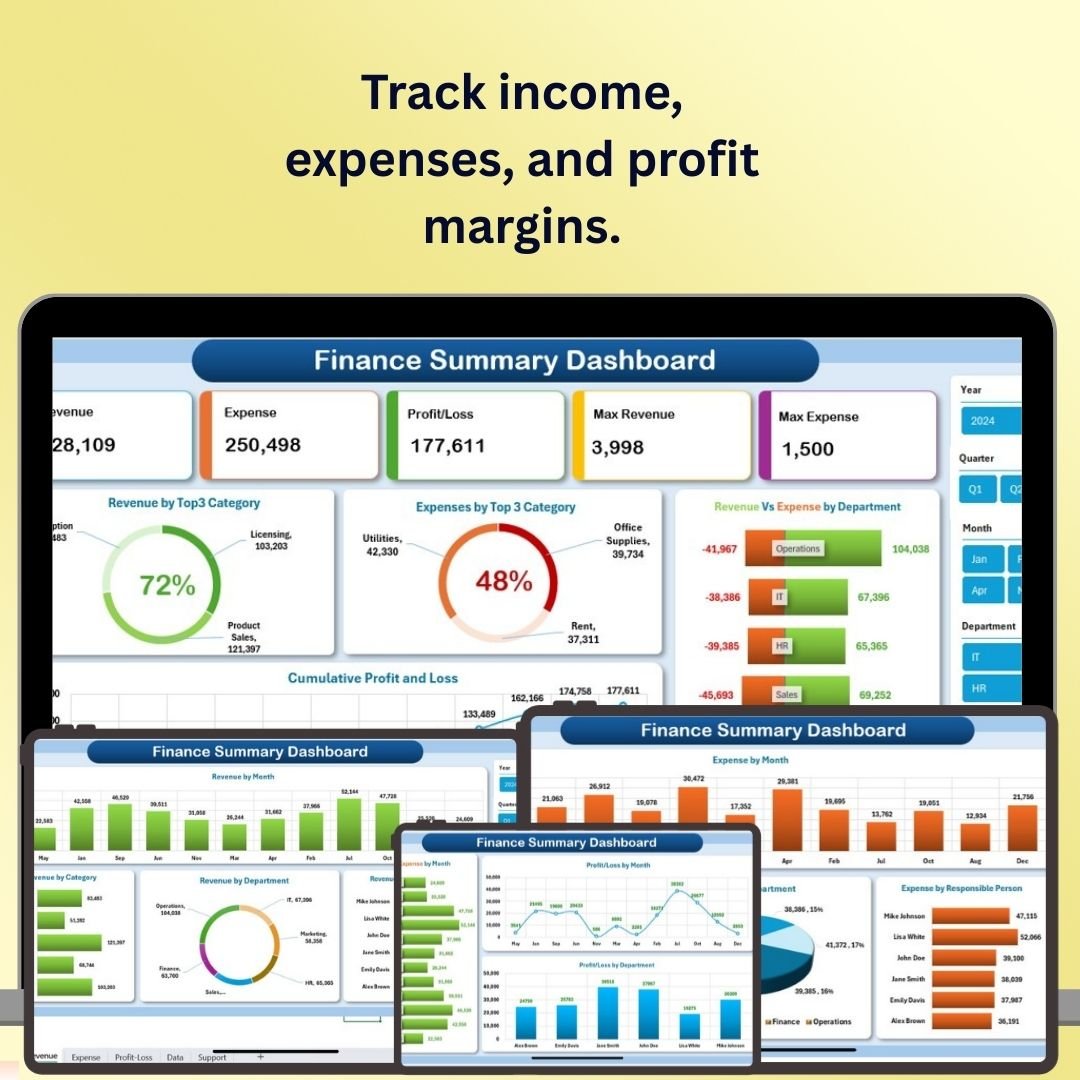 Finance Summary Dashboard in Excel
Advanced Inventory Management System V1.0 (Excel (VBA))
Full VBA inventory system with stock-in/out, reorder alerts and reports.
 Advanced Inventory Management System V1.0
Employee Turnover Dashboard in Excel (Excel)
Analyse attrition by department, tenure, reason and cost of turnover.
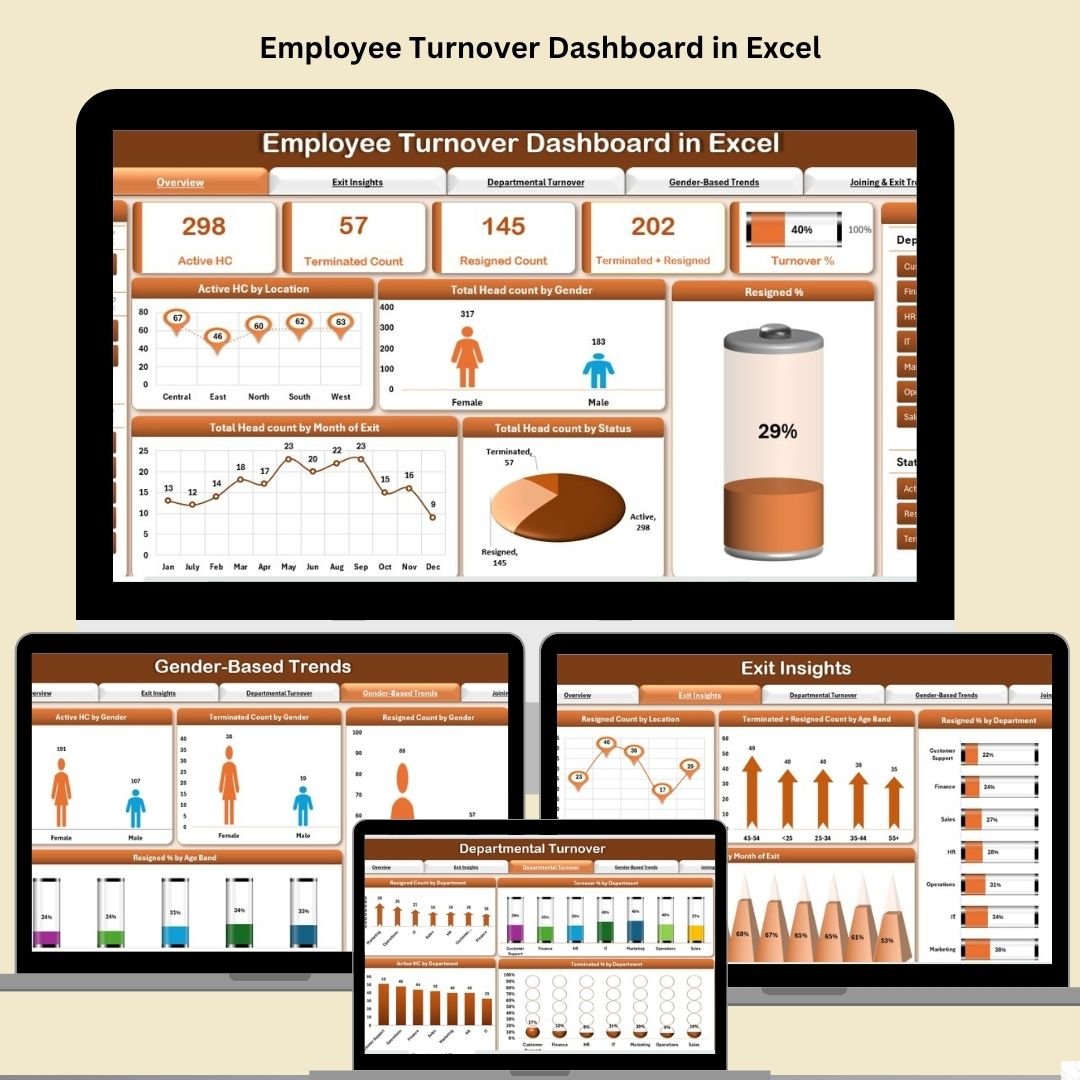 Employee Turnover Dashboard in Excel
Task Management Tracker in Google Sheets (Google Sheets)
Plan, assign and monitor tasks with status, owners and deadlines.
Procurement Dashboard in Power BI (Power BI)
Monitor supplier spend, PO cycle time and procurement KPIs in Power BI.
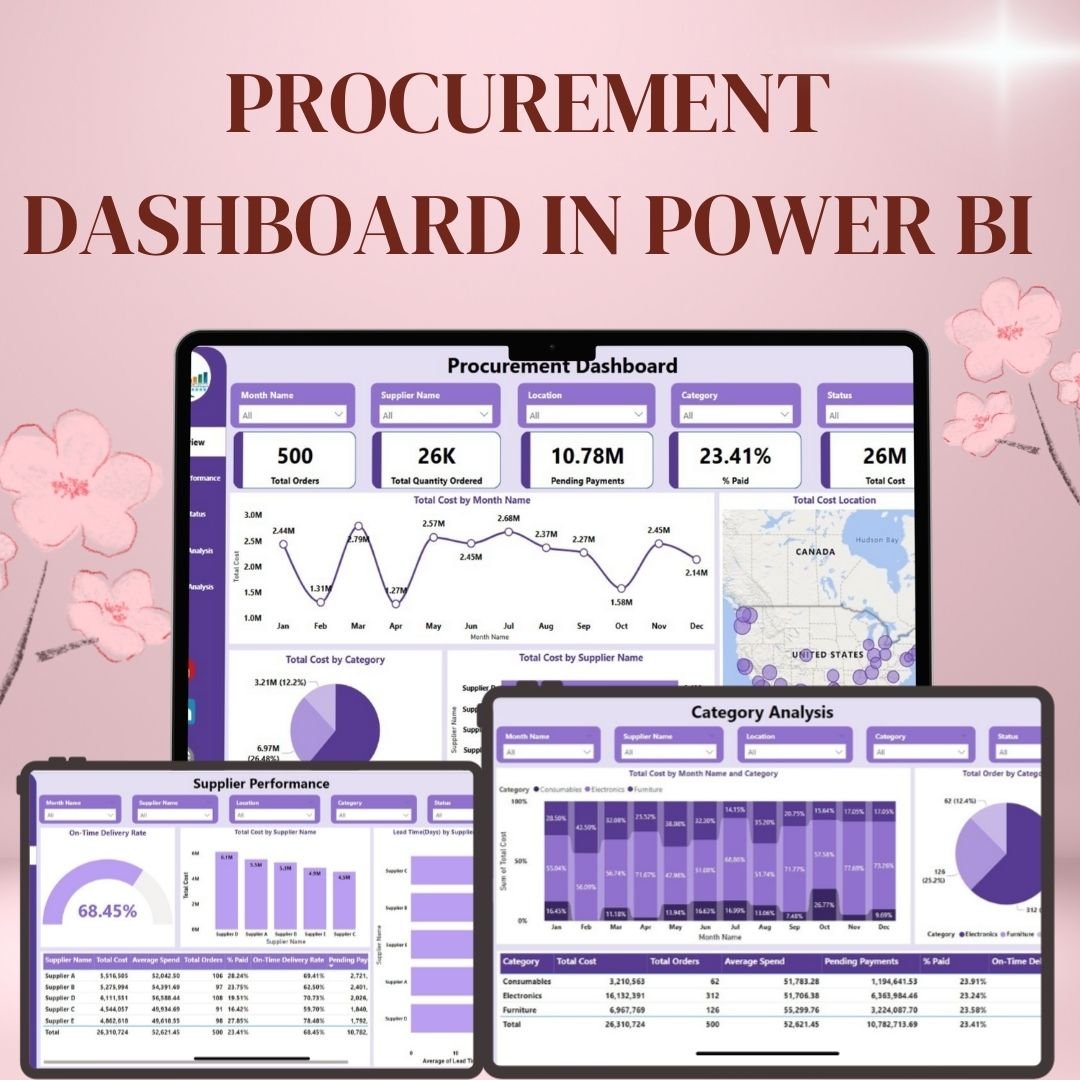 Procurement Dashboard in Power BI
Construction Dashboard in Power BI (Power BI)
Track project budgets, milestones, labour and equipment in Power BI.
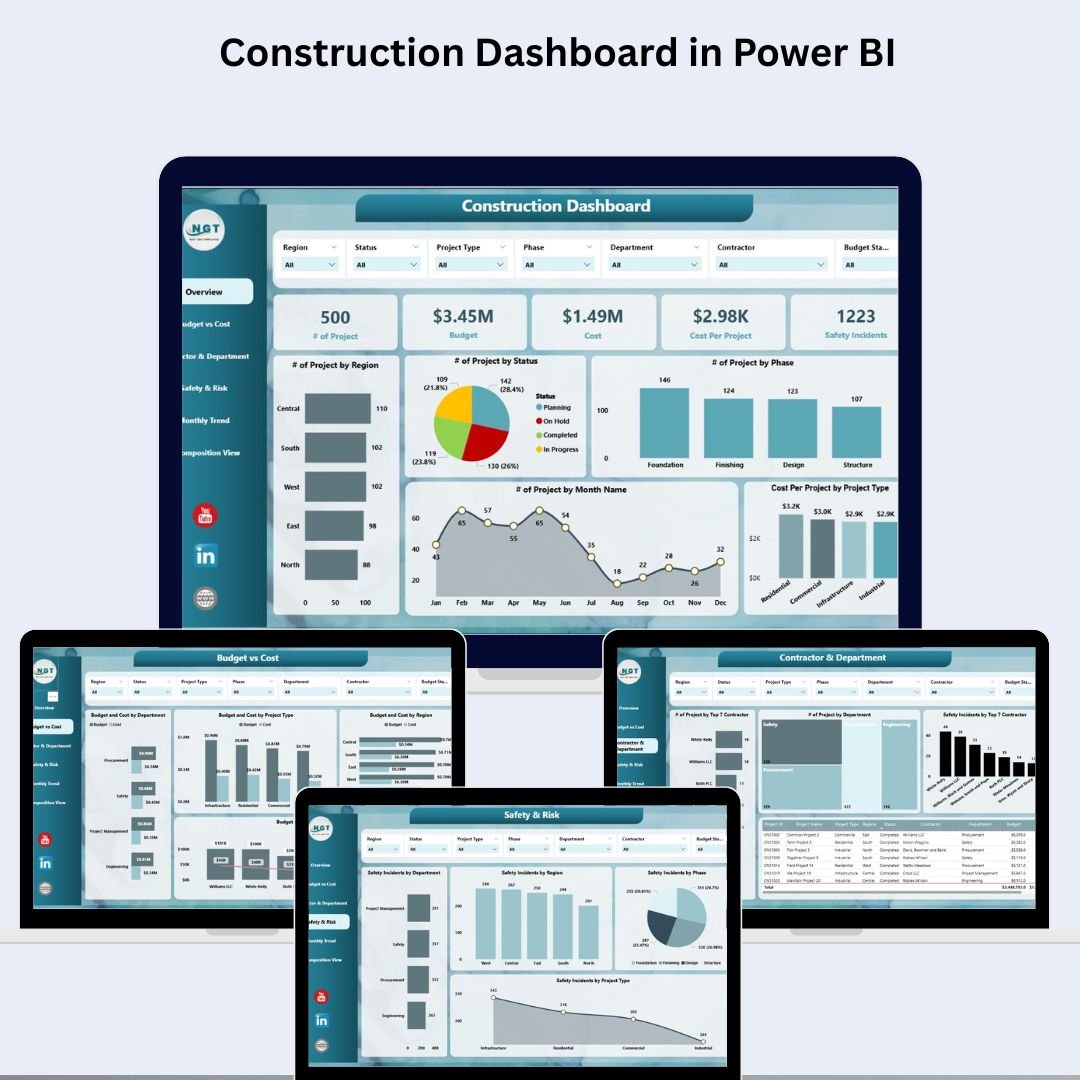 Construction Dashboard in Power BI
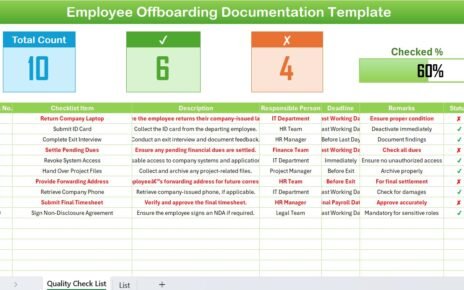
Incident Report Tracker in Excel (Excel)
Log incidents, severity, root cause and resolution status.
Healthcare Dashboard in Excel (Excel)
Patient flow, admissions, occupancy and clinical KPIs in one view.
 Healthcare Dashboard in Excel
Transportation & Logistics Dashboard in Excel (Excel)
Fleet utilisation, delivery performance, cost-per-mile and on-time rates.
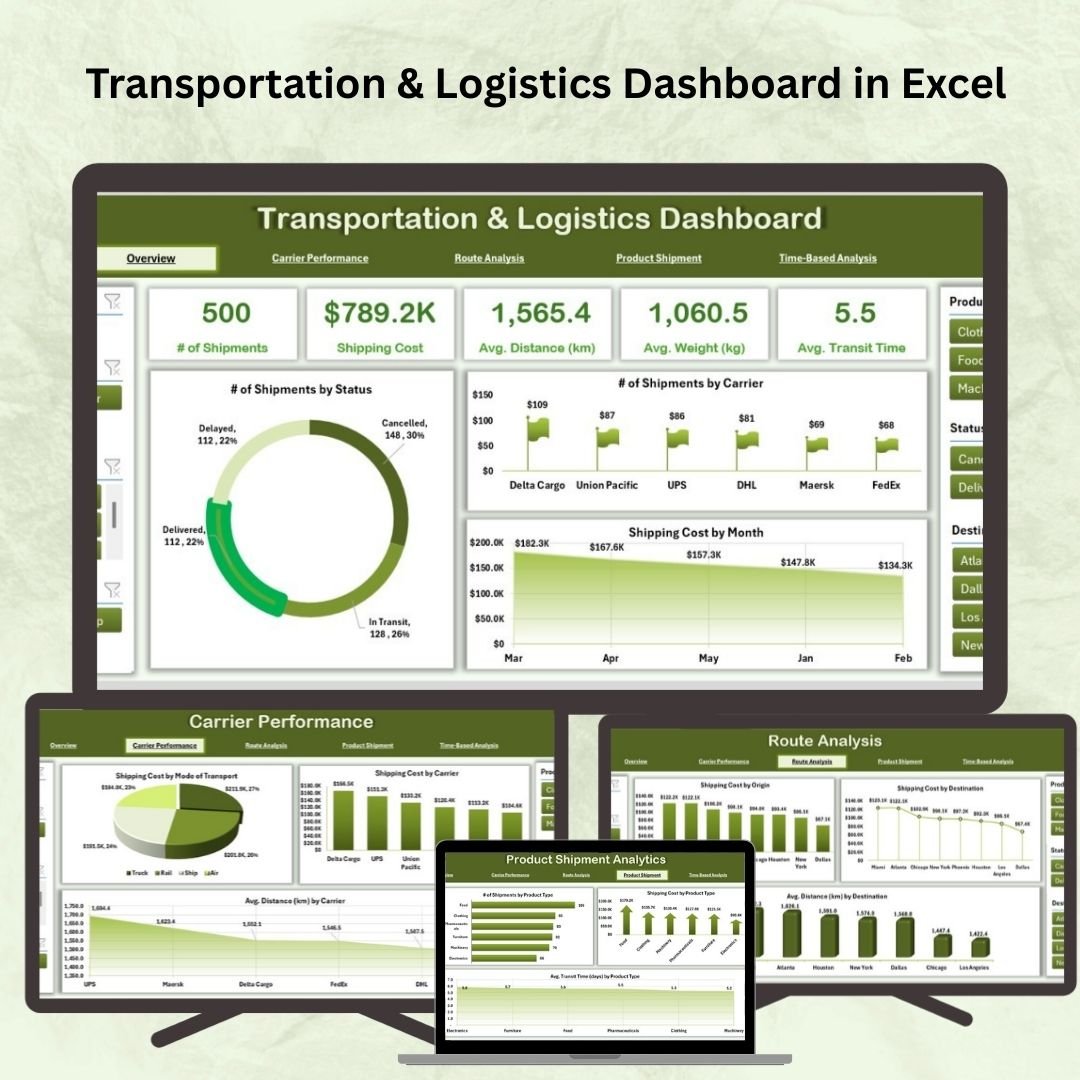 Transportation & Logistics Dashboard in Excel
IT Support Ticket Dashboard in Excel (Excel)
Ticket volume, SLA breaches, resolution time and agent performance.
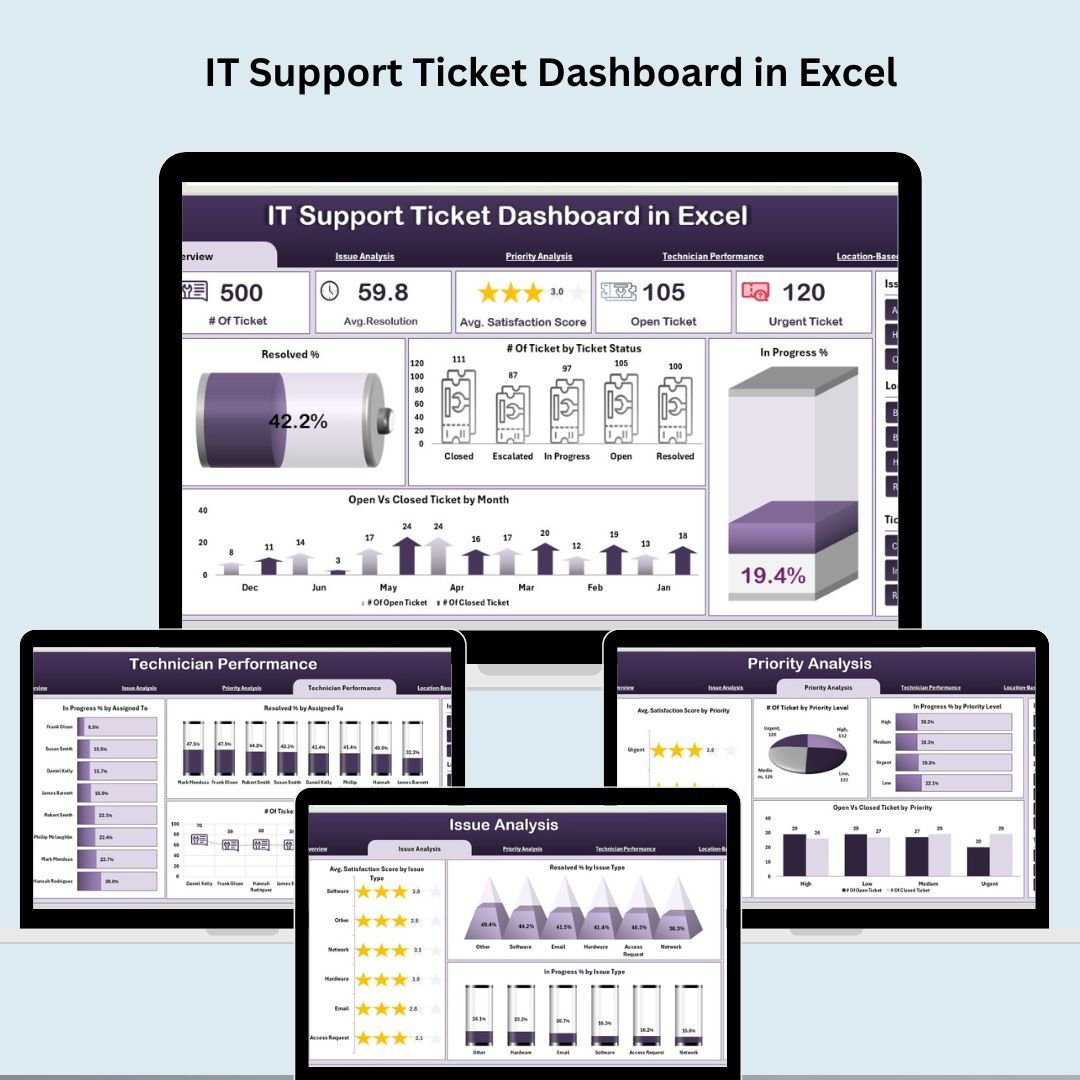 IT Support Ticket Dashboard in Excel
Social Media Performance Dashboard in Google Sheets (Google Sheets)
Followers, reach, engagement and post performance across channels.
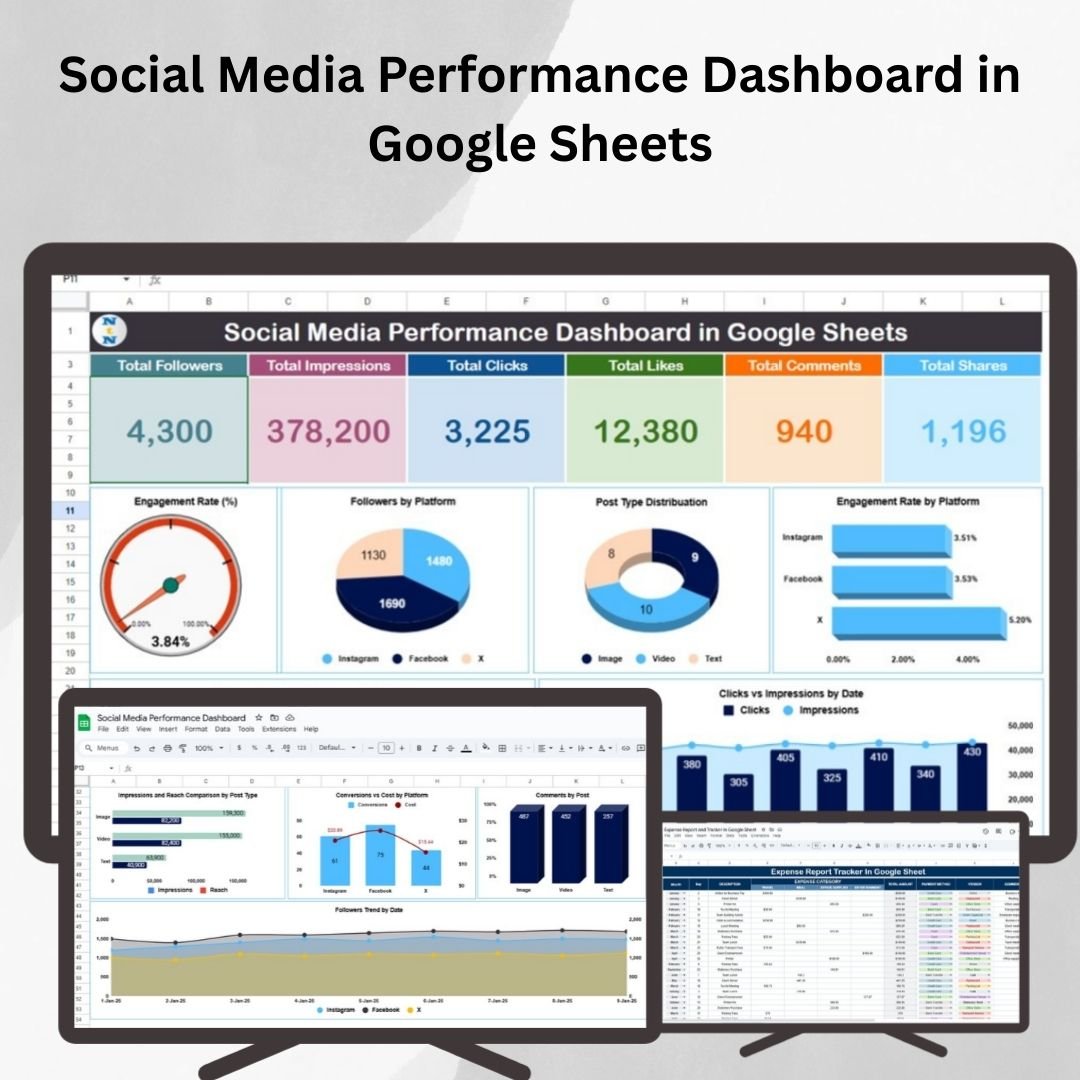 Social Media Performance Dashboard in Google Sheets
Hospital Management System V1.0 (Excel (VBA))
Multi-module VBA hospital system: patients, appointments, billing, staff.
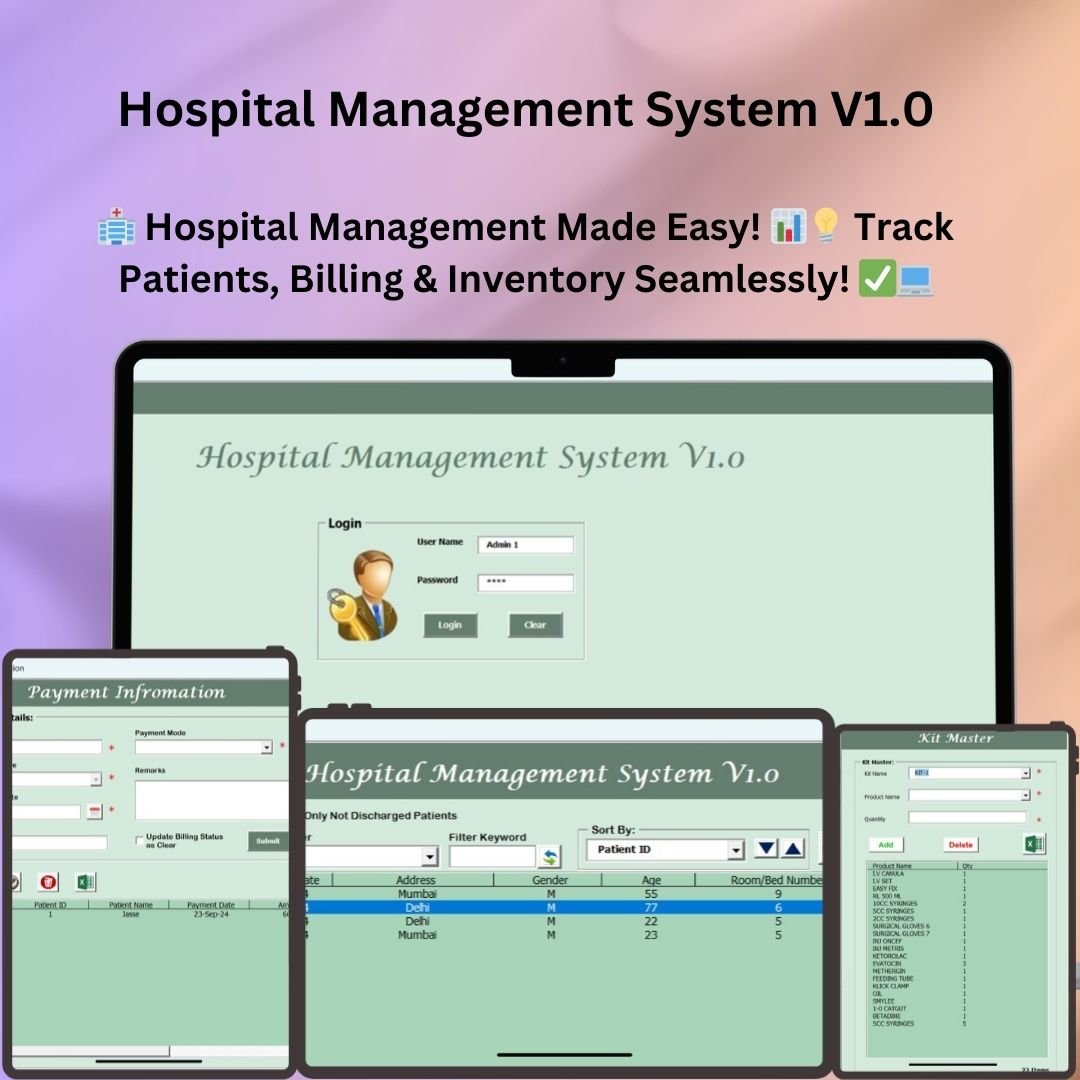 Hospital Management System V1.0
Insurance Dashboard in Excel (Excel)
Policy, claims, premium and loss-ratio analytics for insurers.
 Insurance Dashboard in Excel
Risk Management Dashboard in Excel (Excel)
Risk register with likelihood, impact, heat-map and mitigation tracking.
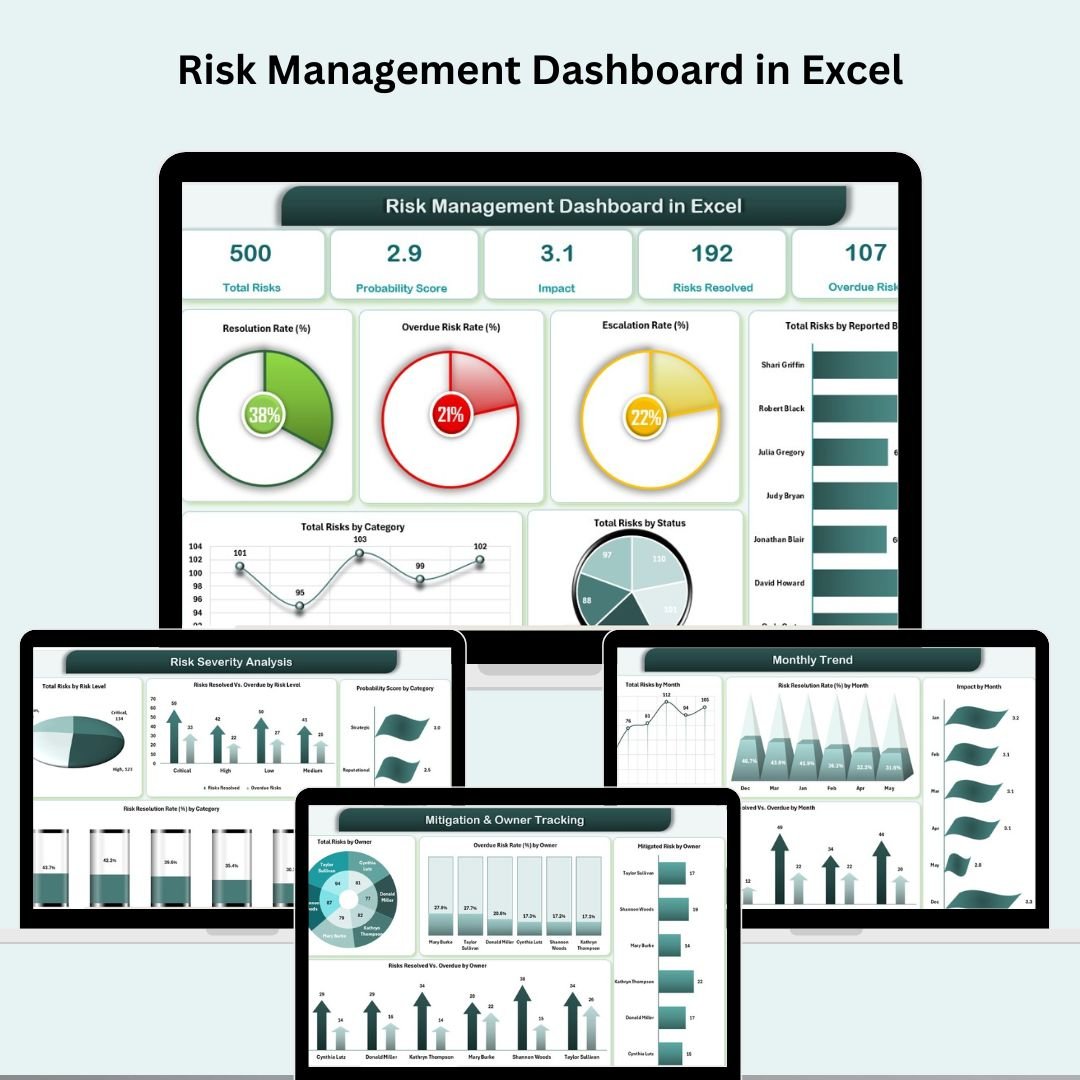 Risk Management Dashboard in Excel
Cash Flow Template in Excel (Excel)
Forecast and track inflows/outflows with a rolling cash position.
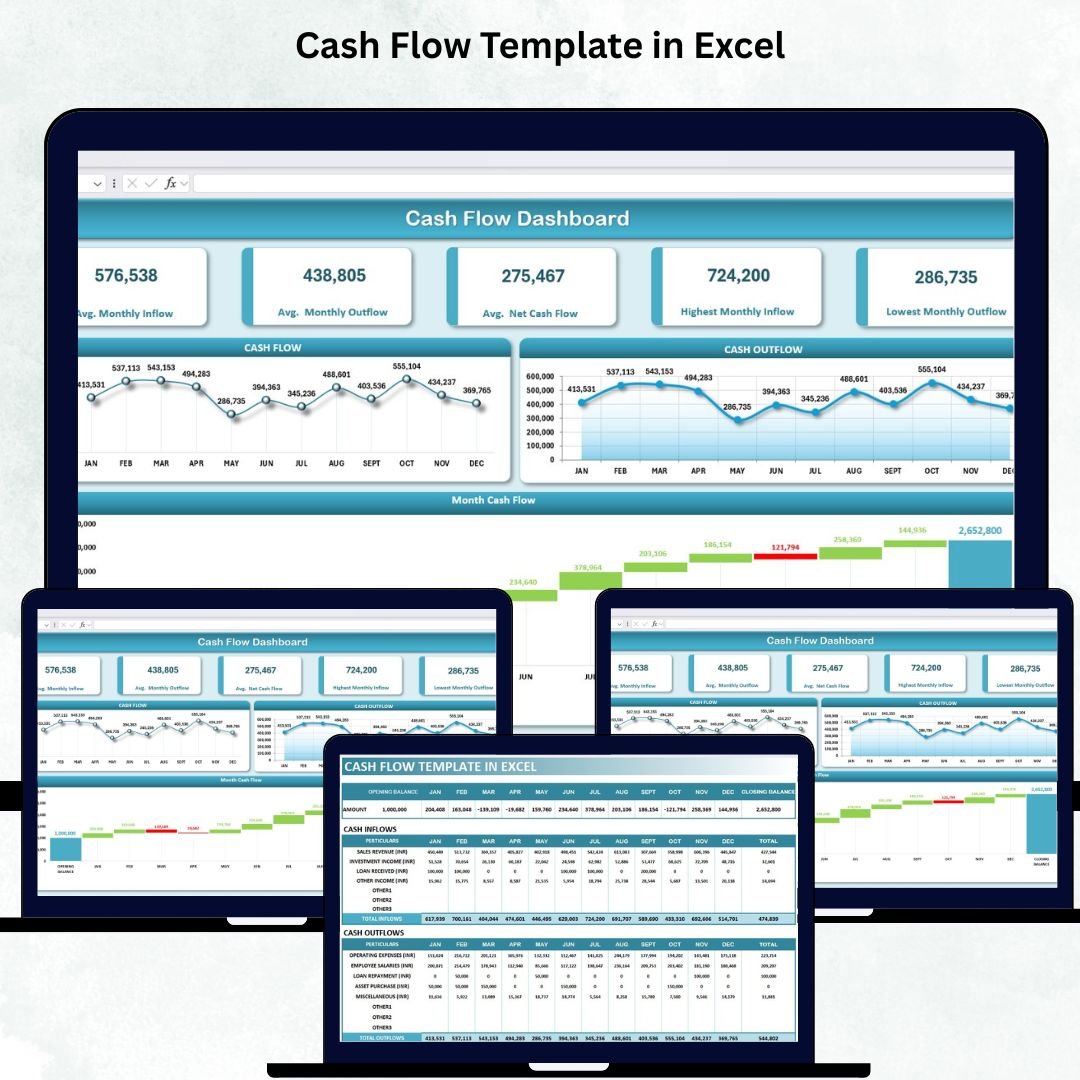 Cash Flow Template in Excel
Sales Funnel Dashboard in Excel (Excel)
Visualise pipeline stages, conversion rates and revenue forecast.
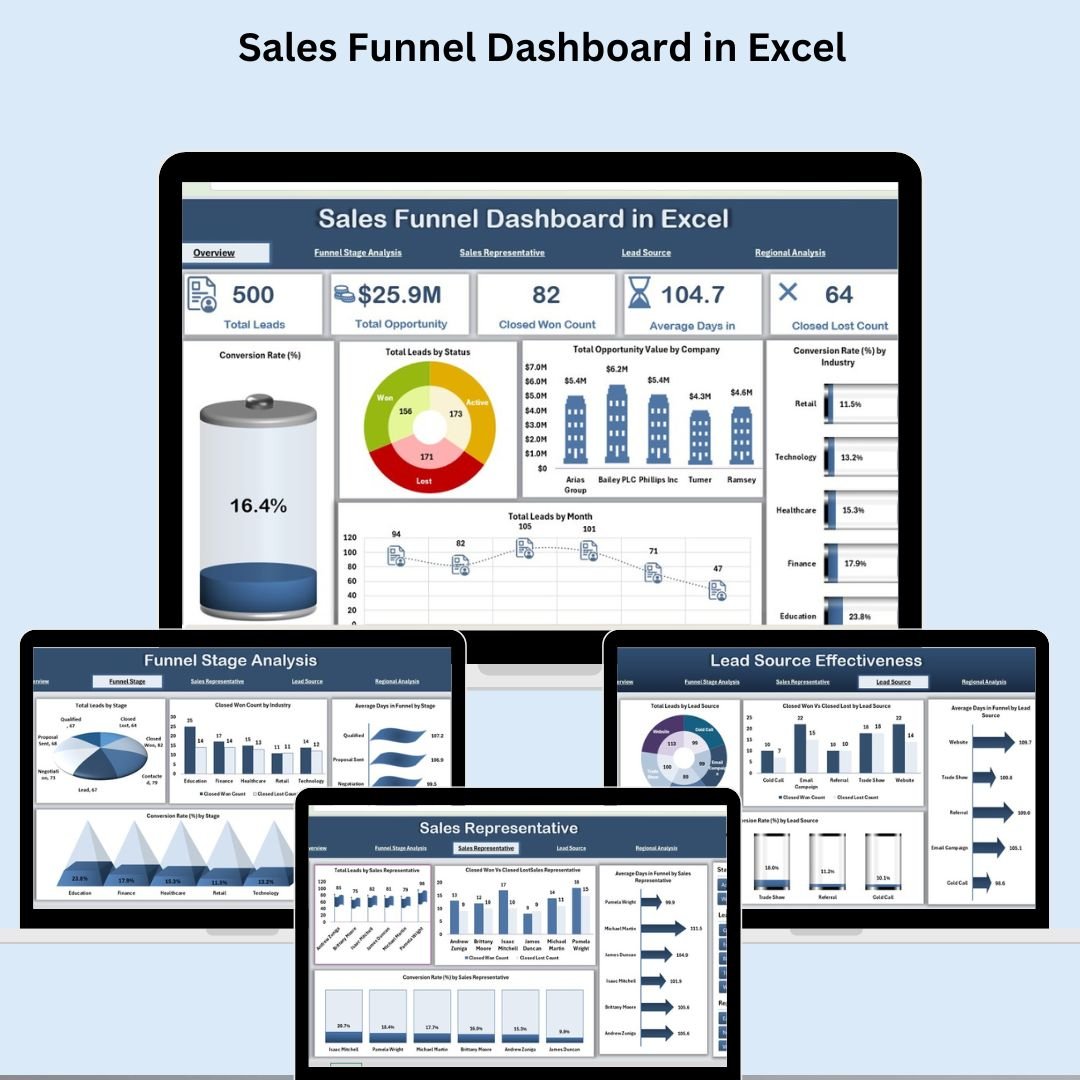 Sales Funnel Dashboard in Excel
Manufacturing Efficiency Dashboard in Power BI (Power BI)
Plant efficiency, OEE and downtime analytics in Power BI.
 Manufacturing Efficiency Dashboard in Power BI
Safety and Compliance Dashboard in Excel (Excel)
Track safety incidents, audits, compliance scores and corrective actions.
 Safety and Compliance Dashboard in Excel
Customer Service Dashboard in Excel (Excel)
CSAT, response time, ticket trends and service-team KPIs.
 Customer Service Dashboard in Excel
Multi-Location Inventory Management in Google Sheets (Google Sheets)
Manage stock across multiple locations with transfers and reorder logic.
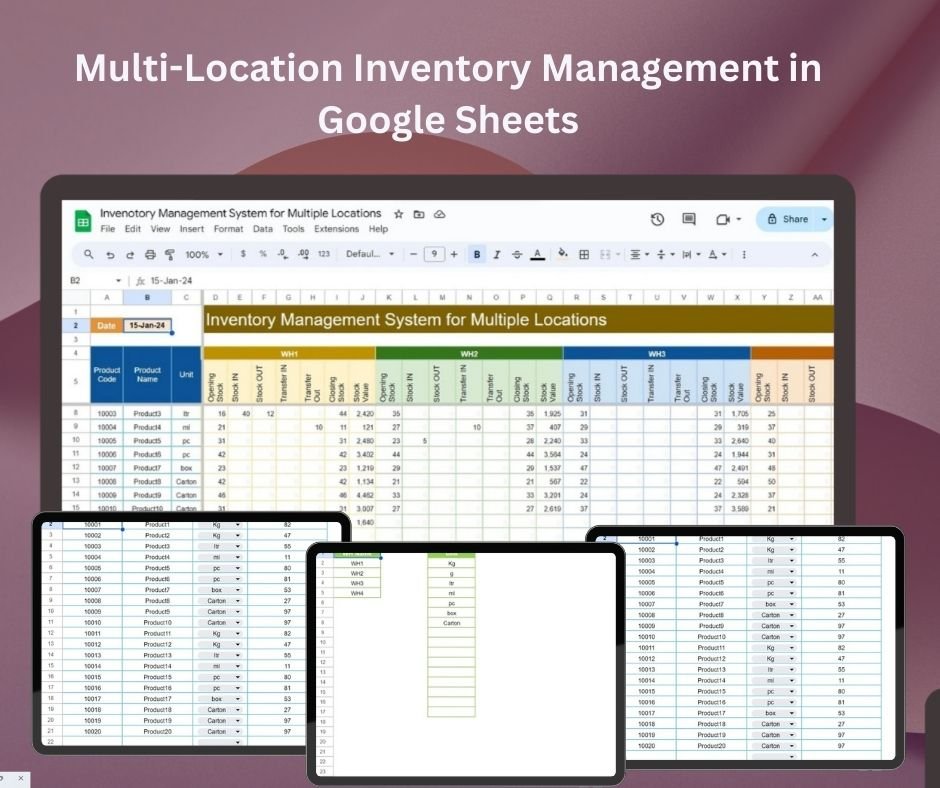 Multi-Location Inventory Management in Google Sheets
Pro Gantt Chart Project Planner in Google Sheets (Google Sheets)
Drag-free Gantt planner with dependencies, % complete and timeline.
 Pro Gantt Chart Project Planner in Google Sheets
Monthly Sales Tracker and Report in Google Sheets (Google Sheets)
Monthly sales targets vs actuals with auto-charts and summaries.
Cybersecurity KPI Dashboard in Excel (Excel)
Security KPIs: threats blocked, vulnerabilities, patch and incident rates.
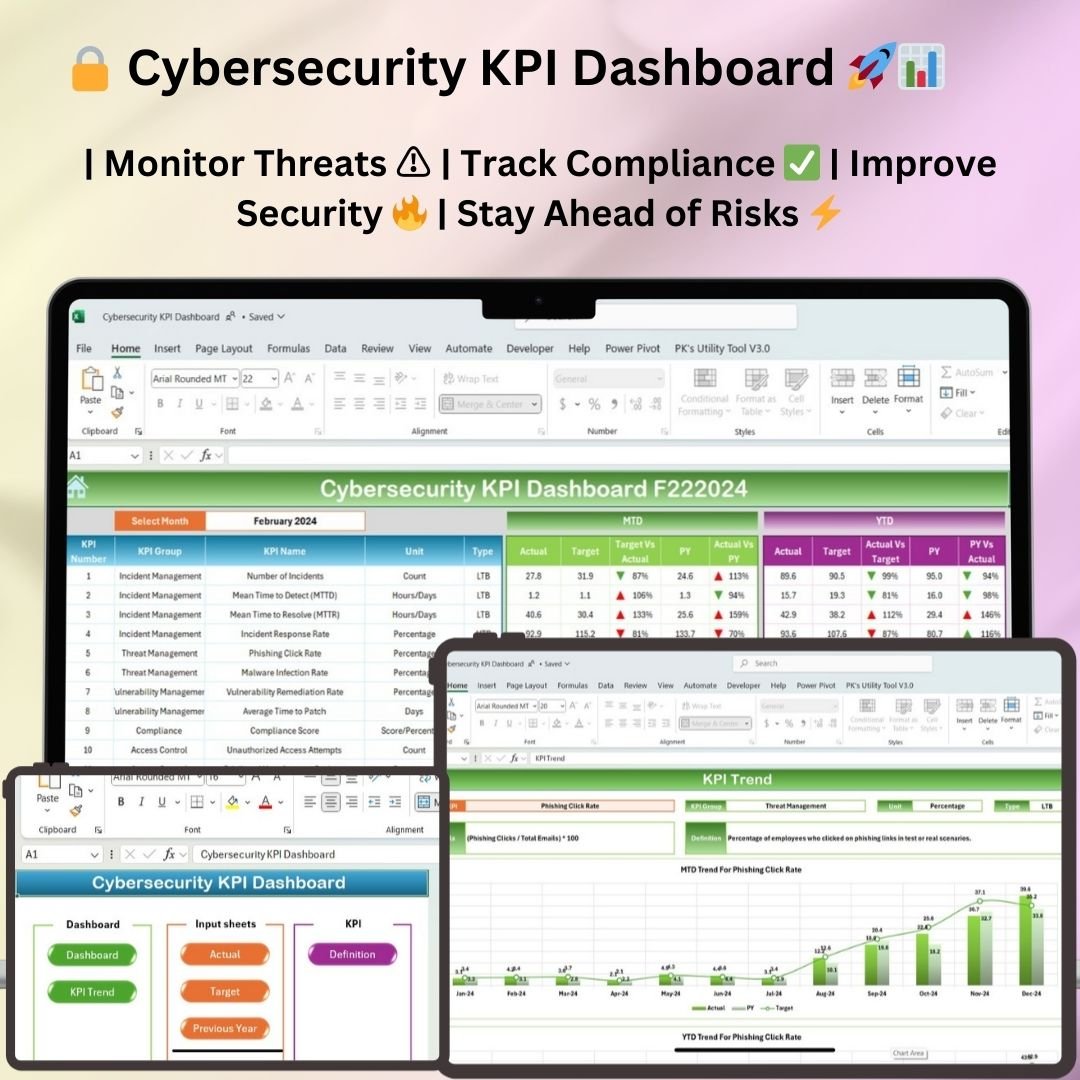 Cybersecurity KPI Dashboard in Excel
Education Dashboard in Excel (Excel)
Enrolment, attendance, grades and academic performance analytics.
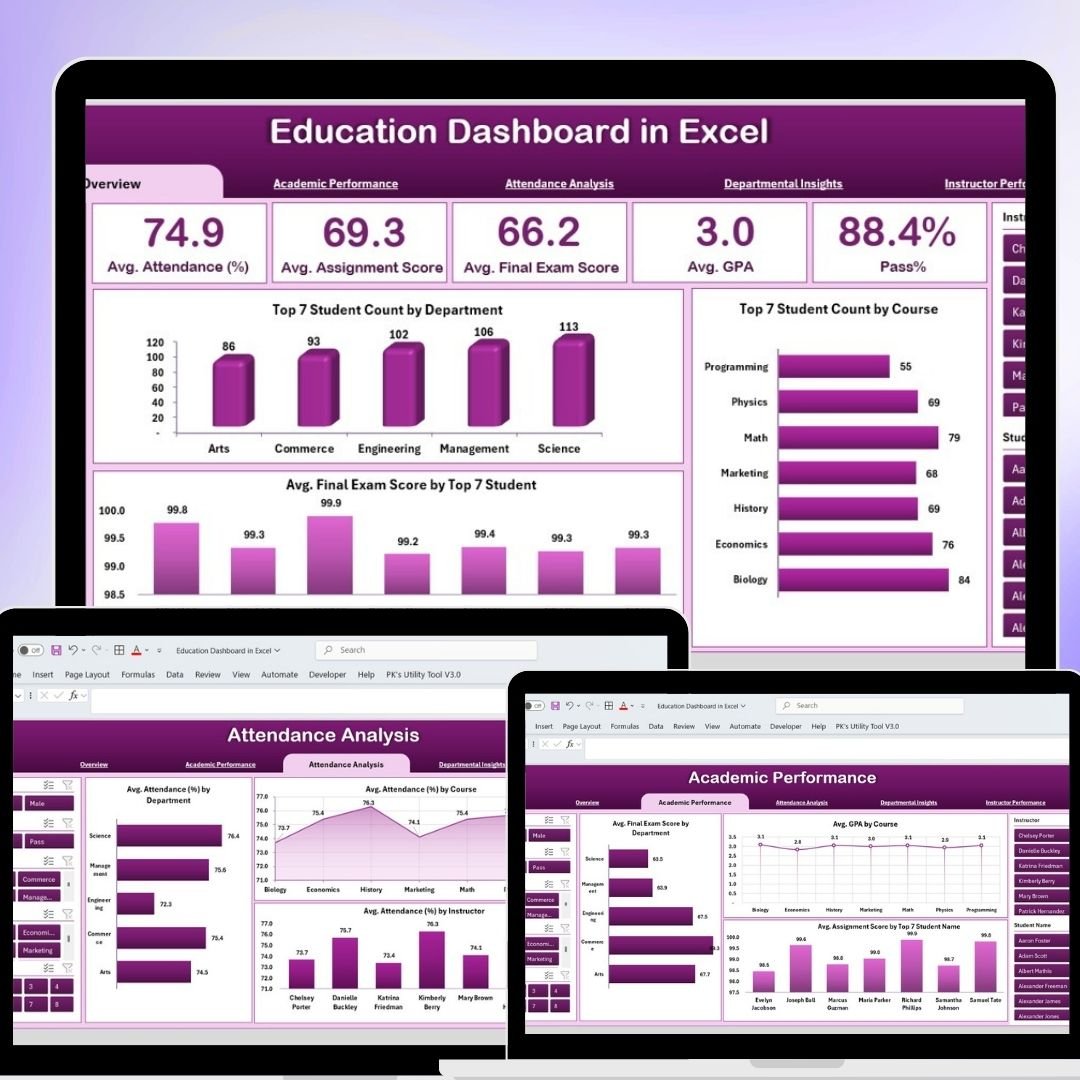 Education Dashboard in Excel
Smart Comparison — Individual vs Bundle
| # | Template | Platform | Price |
|---|---|---|---|
| 1 | Manufacturing Dashboard in Excel | Excel | $17.99 |
| 2 | Finance Summary Dashboard in Excel | Excel | $17.99 |
| 3 | Advanced Inventory Management System V1.0 | Excel (VBA) | $19.99 |
| 4 | Employee Turnover Dashboard in Excel | Excel | $17.99 |
| 5 | Task Management Tracker in Google Sheets | Google Sheets | $6.99 |
| 6 | Procurement Dashboard in Power BI | Power BI | $17.99 |
| 7 | Construction Dashboard in Power BI | Power BI | $17.99 |
| 8 | Incident Report Tracker in Excel | Excel | $6.99 |
| 9 | Healthcare Dashboard in Excel | Excel | $17.99 |
| 10 | Transportation & Logistics Dashboard in Excel | Excel | $17.99 |
| 11 | IT Support Ticket Dashboard in Excel | Excel | $17.99 |
| 12 | Social Media Performance Dashboard in Google Sheets | Google Sheets | $9.99 |
| 13 | Hospital Management System V1.0 | Excel (VBA) | $19.99 |
| 14 | Insurance Dashboard in Excel | Excel | $17.99 |
| 15 | Risk Management Dashboard in Excel | Excel | $17.99 |
| 16 | Cash Flow Template in Excel | Excel | $6.99 |
| 17 | Sales Funnel Dashboard in Excel | Excel | $17.99 |
| 18 | Manufacturing Efficiency Dashboard in Power BI | Power BI | $17.99 |
| 19 | Safety and Compliance Dashboard in Excel | Excel | $17.99 |
| 20 | Customer Service Dashboard in Excel | Excel | $17.99 |
| 21 | Multi-Location Inventory Management in Google Sheets | Google Sheets | $6.99 |
| 22 | Pro Gantt Chart Project Planner in Google Sheets | Google Sheets | $4.99 |
| 23 | Monthly Sales Tracker and Report in Google Sheets | Google Sheets | $6.99 |
| 24 | Cybersecurity KPI Dashboard in Excel | Excel | $12.99 |
| 25 | Education Dashboard in Excel | Excel | $17.99 |
| Individual Total | $372.75 | ||
| Bundle Price | $99.99 | ||
Advantages of Buying the Bundle
- Massive saving: $272.76 off compared with individual purchases.
- One download, whole business: every department covered from day one.
- Platform flexibility: use Excel, Power BI or Google Sheets as each team prefers.
- Consistent quality: uniform formatting and KPI logic across all templates.
- Future-proof library: reuse across projects, clients and reporting cycles.
Best Practices for Deploying the Bundle
- Start with the templates that map to your most urgent reporting need.
- Keep a master copy untouched and work on duplicates per project.
- Standardise your input data format so dashboards refresh cleanly.
- For Power BI files, point the data source to your own dataset and refresh.
- Roll out one department at a time to build adoption.
Explore More Templates
Browse the full catalogue of Excel dashboards, Power BI dashboards and Google Sheets templates on NextGenTemplates.com.
Frequently Asked Questions
How many templates are in the NextGen Ultimate Business Bundle?
The bundle includes 25 templates across Excel, Power BI and Google Sheets.
How much do I save versus buying individually?
The templates total $372.75 individually. The bundle is $99.99 — a saving of $272.76 (73%).
What software do I need?
Microsoft Excel, Power BI Desktop (free) and a Google account for the Google Sheets templates.
Are the management systems included?
Yes — both the Hospital Management System and the Advanced Inventory Management System (VBA) are part of the bundle.
Can I use these for client work?
Yes. Once downloaded, you can use the templates on unlimited internal or client projects.
Do I get future updates?
You keep lifetime access to the files you download. Major new versions may be released as separate products.
Conclusion
The NextGen Ultimate Business Bundle is the simplest, most affordable way to give your entire business professional reporting. 25 templates, three platforms, one download — for less than the price of three individual dashboards.
Get all 25 templates for $99.99 (save $272.76)
▶️ Watch dashboard tutorials on our YouTube channel.