In today’s data-driven world, Non-Profit KPI Dashboard in Excel organizations need effective tools to track their performance and impact. One of the best ways to do this is by using a Non-Profit KPI Dashboard in Excel. This dashboard allows organizations to measure key performance indicators (KPIs) such as financial health, donor retention, and program impact. By leveraging data, non-profits can make informed decisions that drive their mission forward.
Click to buy Non-Profit KPI Dashboard in Excel
In this article, we will walk you through a comprehensive, ready-to-use Non-Profit KPI Dashboard template in Excel. You’ll learn about its key features, how it works, best practices, and opportunities for improvement. We will also answer some frequently asked questions to give you a thorough understanding of this tool.
Key Features of the Non-Profit KPI Dashboard in Excel
Our Non-Profit KPI Dashboard in Excel includes seven sheets, each serving a distinct purpose in tracking and analyzing non-profit KPIs. Let’s go over each of them.
Home Sheet
Click to buy Non-Profit KPI Dashboard in Excel
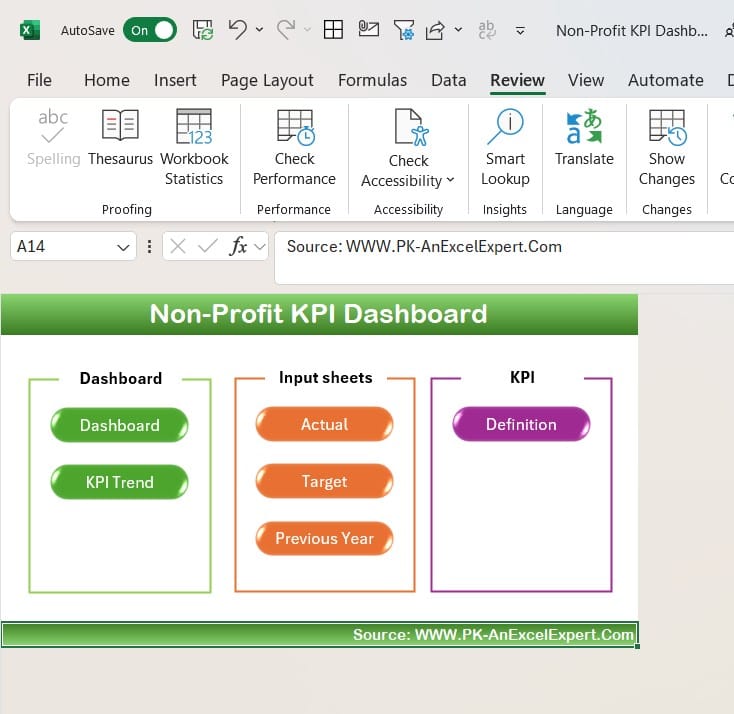
The Home Sheet acts as an index page for the dashboard, providing an easy navigation experience. It contains six buttons, each of which is linked to one of the other worksheets in the dashboard. This intuitive interface allows users to jump to different parts of the dashboard with ease.
Dashboard Sheet Tab

Click to buy Non-Profit KPI Dashboard in Excel
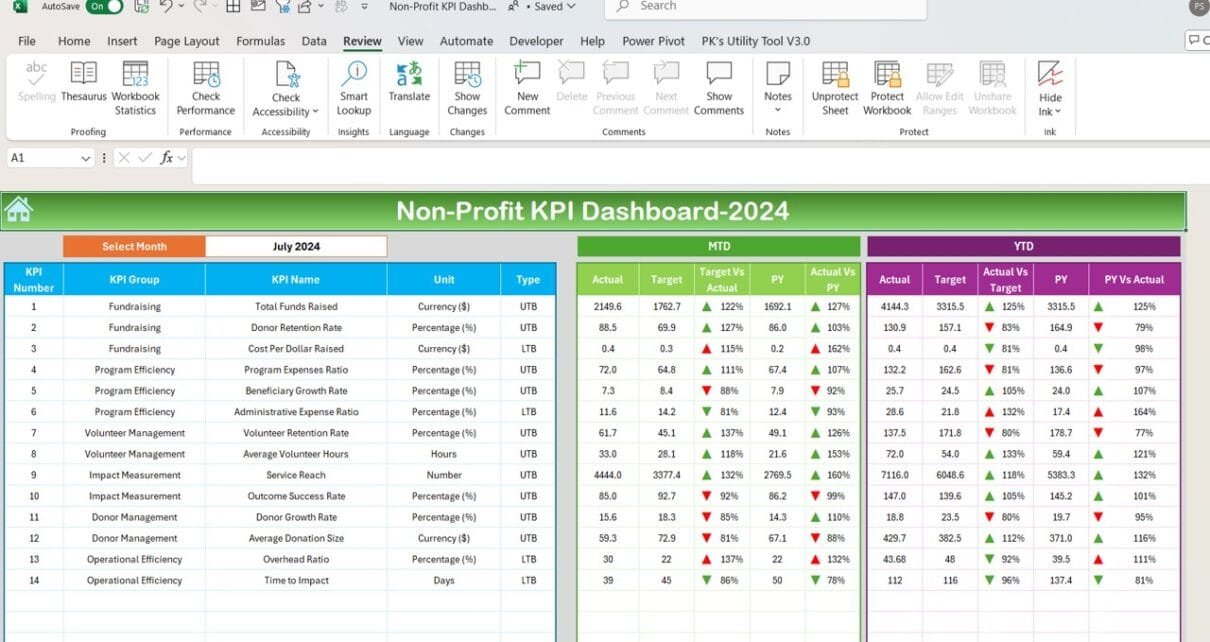
The Dashboard Sheet Tab is the main hub of the dashboard, where you can view all the critical KPI data. This sheet is designed to be interactive and highly visual, allowing users to select a specific month using a drop-down in cell D3. Once a month is selected, all the figures for that period will automatically update.
The sheet shows the MTD (Month-to-Date) and YTD (Year-to-Date) values for both actual and target numbers, as well as previous year (PY) data. You’ll also find conditional formatting in place that uses arrows to indicate whether the actual figures are higher or lower than the target and previous year values. This visual aid makes it easier to spot trends and areas requiring attention.
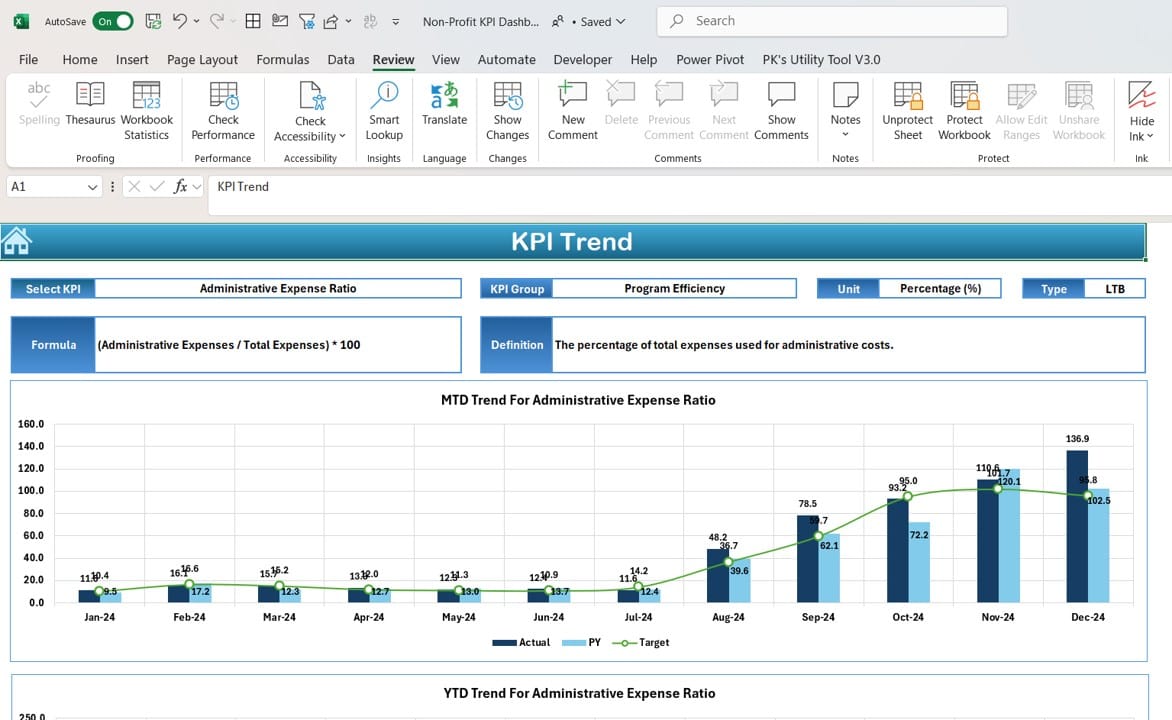
KPI Trend Sheet Tab
Click to buy Non-Profit KPI Dashboard in Excel
In the KPI Trend Sheet Tab, users can select specific KPIs from a drop-down list in cell C3. The selected KPI’s relevant information will populate, including its group, unit, type (whether lower is better or upper is better), and its formula.
This sheet also provides a comprehensive look at the MTD and YTD trends for the selected KPI, with charts comparing actuals, targets, and previous year data. These visual trends offer valuable insights into how well the organization is progressing toward its goals.
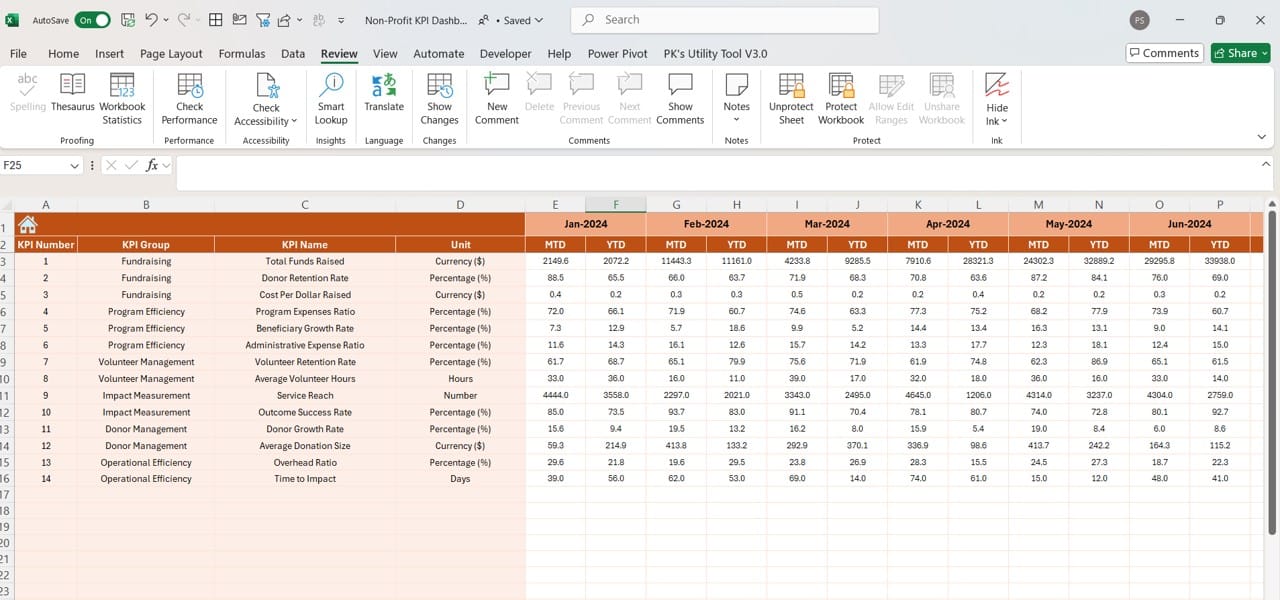
Actual Numbers Input Sheet
Click to buy Non-Profit KPI Dashboard in Excel
The Actual Numbers Input Sheet is where users enter the actual performance data for the organization. It’s designed to capture both MTD and YTD figures. You can adjust the time frame by changing the month in cell E1, which automatically updates the input fields. This functionality makes it easy to keep the data current, ensuring that the dashboard is always up-to-date.
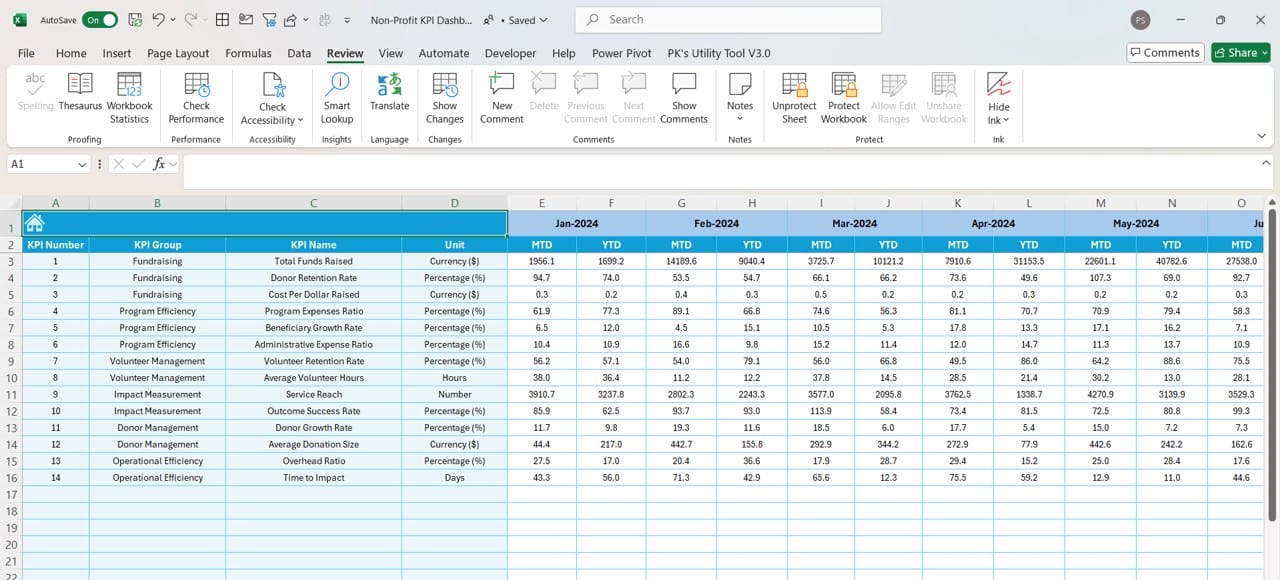
Target Sheet Tab
Click to buy Non-Profit KPI Dashboard in Excel
In the Target Sheet Tab, users can enter target numbers for each KPI on a monthly and yearly basis. This sheet allows you to input both MTD and YTD targets, providing a clear goal to strive for and a benchmark to measure against. By comparing these targets with actual results, non-profits can assess their progress and make adjustments as necessary.
Previous Year Number Sheet Tab

Click to buy Non-Profit KPI Dashboard in Excel
This sheet is dedicated to entering the previous year’s data. By including past performance metrics, the dashboard can display year-over-year comparisons. These comparisons offer valuable context, helping organizations understand how they are performing relative to previous years.
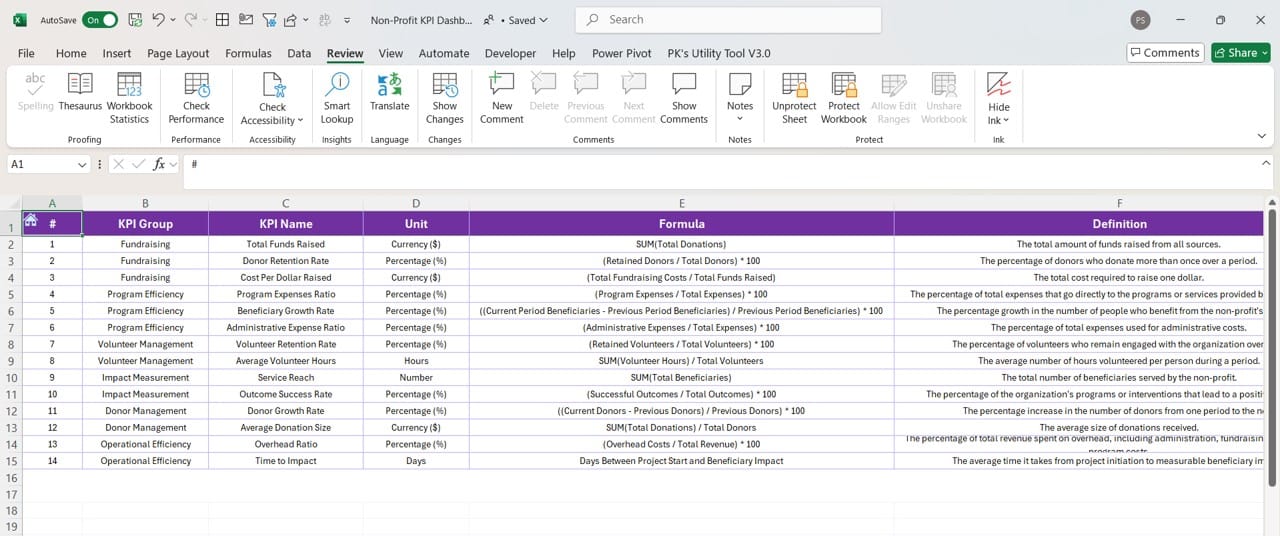
KPI Definition Sheet Tab
Click to buy Non-Profit KPI Dashboard in Excel
The KPI Definition Sheet Tab serves as a reference guide for the KPIs included in the dashboard. For each KPI, you can enter its name, group, unit, formula, and definition. This sheet helps ensure that all team members have a clear understanding of what each KPI measures and how it is calculated.
Advantages of Using a Non-Profit KPI Dashboard
Using a KPI dashboard is invaluable for non-profit organizations that are looking to track and improve their performance. Here are some key advantages:
- Centralized Data Tracking: With a KPI dashboard, all the data related to an organization’s performance is centralized in one place. This makes it easy to monitor progress across various areas such as fundraising, program delivery, and volunteer management.
- Real-Time Insights: The ability to update data in real-time means non-profits can access the most current information at any given moment. This facilitates quicker decision-making and allows organizations to respond more rapidly to challenges or opportunities.
- Improved Accountability: Non-profits rely on transparency to build trust with their donors, volunteers, and beneficiaries. A KPI dashboard offers an accessible way to demonstrate accountability by providing clear and measurable data that shows how resources are being used effectively.
- Enhanced Decision Making: By visualizing trends and patterns in the data, a KPI dashboard helps non-profit leaders make informed decisions that align with the organization’s goals. This ensures that every action taken is backed by concrete evidence, leading to more efficient operations and better outcomes.
- Customization and Flexibility: Non-profits often have unique KPIs that reflect their specific mission and operational goals. The KPI dashboard in Excel is customizable, allowing organizations to tailor it to their needs. Whether you’re tracking donor retention, program outcomes, or operational efficiency, this dashboard can be adjusted to fit your exact requirements.
Click to buy Non-Profit KPI Dashboard in Excel
Best Practices for Using a Non-Profit KPI Dashboard
To make the most of your Non-Profit KPI Dashboard, here are some best practices to follow:
- Define Clear KPIs: Ensure that the KPIs you track are aligned with your organization’s mission and goals. KPIs should be specific, measurable, attainable, relevant, and time-bound (SMART).
- Update Regularly: To keep your data current, make sure the actual performance numbers and target numbers are updated regularly. This will ensure the dashboard reflects real-time performance and helps you take timely actions.
- Share with Stakeholders: A KPI dashboard is a powerful tool for communicating your organization’s performance to stakeholders, including donors, board members, and volunteers. Sharing the dashboard fosters transparency and encourages collective responsibility for achieving your goals.
- Use Visuals Effectively: Leverage the visual elements in your dashboard, such as conditional formatting and charts, to make the data easy to understand at a glance. This is particularly important when presenting to non-technical audiences.
- Analyze Trends Over Time: Rather than focusing solely on individual months, use the dashboard to analyze long-term trends. This will provide insights into whether your organization is improving over time and help identify areas that need attention.
Click to buy Non-Profit KPI Dashboard in Excel
Opportunities for Improvement in Non-Profit KPI Dashboards
While KPI dashboards are incredibly useful, there are always opportunities for improvement. Here are a few areas where you can enhance the performance of your dashboard:
- Automating Data Entry: Manually entering data can be time-consuming and prone to error. By integrating your dashboard with other data management systems, you can automate the input process, reducing the risk of mistakes and saving valuable time.
- Expanding KPI Categories: Non-profits can benefit from tracking a wider range of KPIs. Consider adding more categories to the dashboard, such as social impact metrics or volunteer engagement, to get a more holistic view of the organization’s performance.
- Improving Usability: While Excel is a powerful tool, not everyone may be familiar with how to navigate complex spreadsheets. Simplify the interface and add instructions to make the dashboard more user-friendly for all team members.
Click to buy Non-Profit KPI Dashboard in Excel
Conclusion
The Non-Profit KPI Dashboard in Excel is an essential tool for any organization looking to track and improve its performance. By centralizing data, providing real-time insights, and improving accountability, this dashboard empowers non-profits to make informed decisions that drive meaningful impact. By following best practices and exploring opportunities for improvement, organizations can ensure that they are using their dashboard to its full potential.
Frequently Asked Questions (FAQs)
Q. How often should we update the Non-Profit KPI Dashboard?
It’s best to update the dashboard at least monthly to keep the data current. However, if possible, updating it in real-time or weekly provides even more accurate insights.
Q. Can I customize the KPIs in the dashboard?
Yes, the Non-Profit KPI Dashboard in Excel is fully customizable. You can add or remove KPIs based on the specific needs of your organization.
Q. Do I need advanced Excel skills to use the dashboard?
No, the dashboard is designed to be user-friendly. While a basic understanding of Excel is helpful, the template includes intuitive features such as drop-down menus and buttons for easy navigation.
Q. How can this dashboard help with donor retention?
By tracking KPIs related to donor engagement and retention, you can identify patterns and trends that help improve donor relations. For example, you can monitor how often donors contribute and target those who have lapsed in giving.
Q. What types of KPIs should a non-profit organization track?
Common KPIs include fundraising efficiency, program impact, donor retention rate, volunteer engagement, and operational efficiency. However, your specific KPIs should align with your organizational goals.
Q. Is this dashboard suitable for small non-profits?
Absolutely! This dashboard is designed to be flexible and scalable, making it suitable for non-profits of all sizes.
Click to buy Non-Profit KPI Dashboard in Excel
By implementing the Non-Profit KPI Dashboard in Excel you’ll be better equipped to track your organization’s progress, meet your goals, and make data-driven decisions that lead to greater success.
Visit our YouTube channel to learn step-by-step video tutorials
Click to buy Non-Profit KPI Dashboard in Excel