An Organic Search KPI (Key Performance Indicator) Dashboard in Excel is a powerful tool for tracking and optimizing the performance of your website’s organic search traffic. Organic search traffic refers to the visitors who land on your website through unpaid search engine results. Tracking these key metrics will help you understand how well your website is performing in search engine rankings, what areas need improvement, and how to refine your SEO (Search Engine Optimization) strategies to increase visibility and traffic.
In this article, we will guide you through an Organic Search KPI Dashboard in Excel. We will cover the essential KPIs to track, how to aggregate data, and how to use this dashboard to make data-driven decisions that boost your organic search efforts.
Why Use an Organic Search KPI Dashboard?
An Organic Search KPI Dashboard simplifies the process of monitoring your SEO efforts. By tracking important metrics like keyword rankings, traffic, and conversions, you can determine whether your SEO strategy is yielding the desired results. Excel dashboards allow you to visualize this data and compare it with your set targets, historical data, and industry benchmarks, providing actionable insights that you can use to adjust your strategy.
Key Features of the Organic Search KPI Dashboard
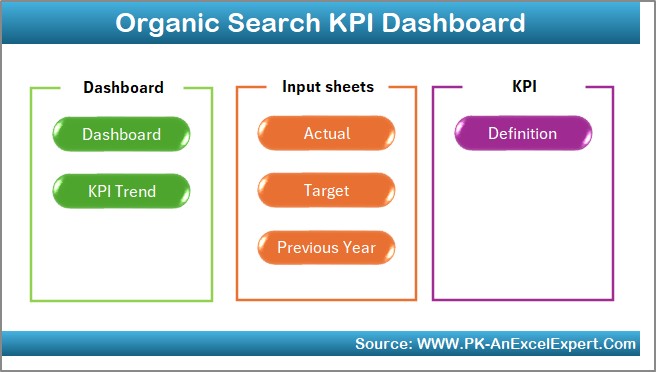
Our Organic Search KPI Dashboard in Excel includes 7 distinct worksheets, each serving a specific purpose to help you manage and track your key metrics effectively. Here’s an overview:
Home Sheet Tab
This is the starting point of your dashboard. You can easily navigate to the other sheets by clicking on the respective links. It’s a user-friendly layout that keeps your workflow smooth and simple.
Click to buy Organic Search KPI Dashboard in Excel
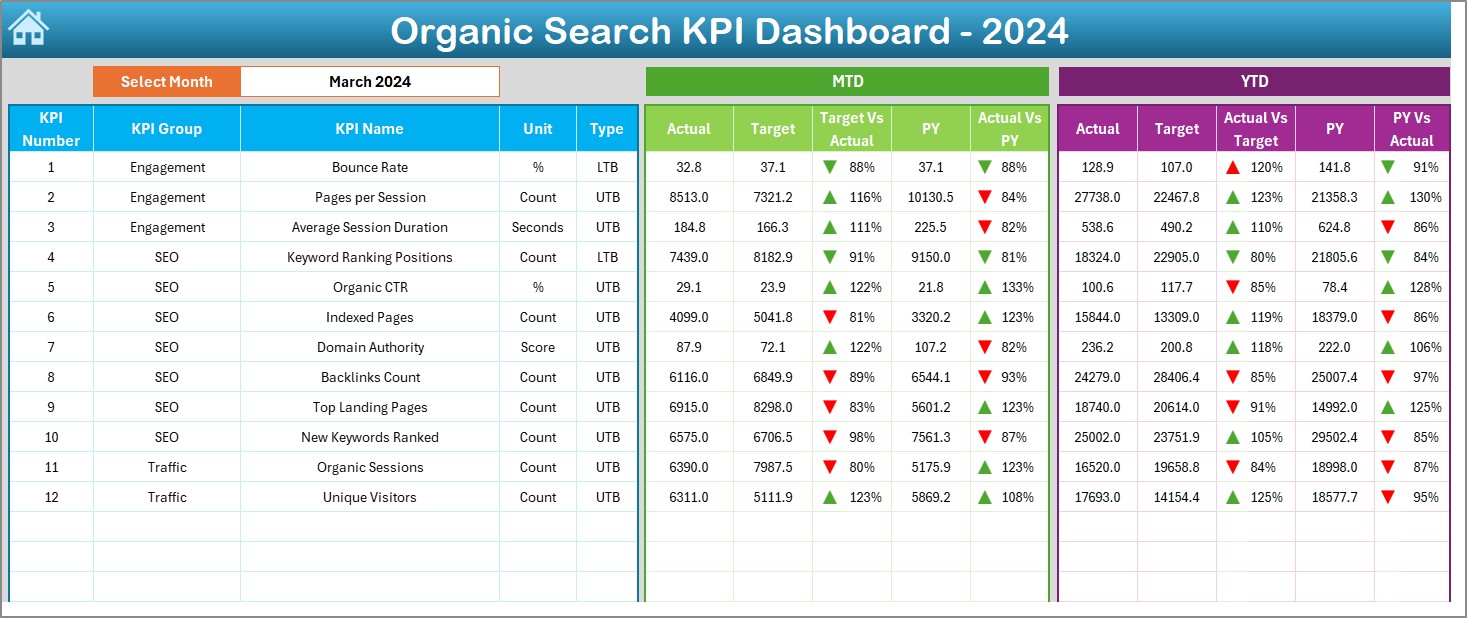
Dashboard Sheet Tab
This is the main tab where all your key performance indicators (KPIs) are displayed. You can select a specific month from a drop-down menu (located at range D3), and all the data will update accordingly. The dashboard shows:
- MTD (Month-to-Date) Actual: Displays the actual data for the selected month.
- Target: Displays the target values.
- Previous Year (PY): Displays data from the previous year for comparison.
- Target vs. Actual: A visual comparison to highlight any discrepancies.
- PY vs. Actual: A comparison of this year’s performance against last year’s, with conditional formatting using up and down arrows to easily identify trends.
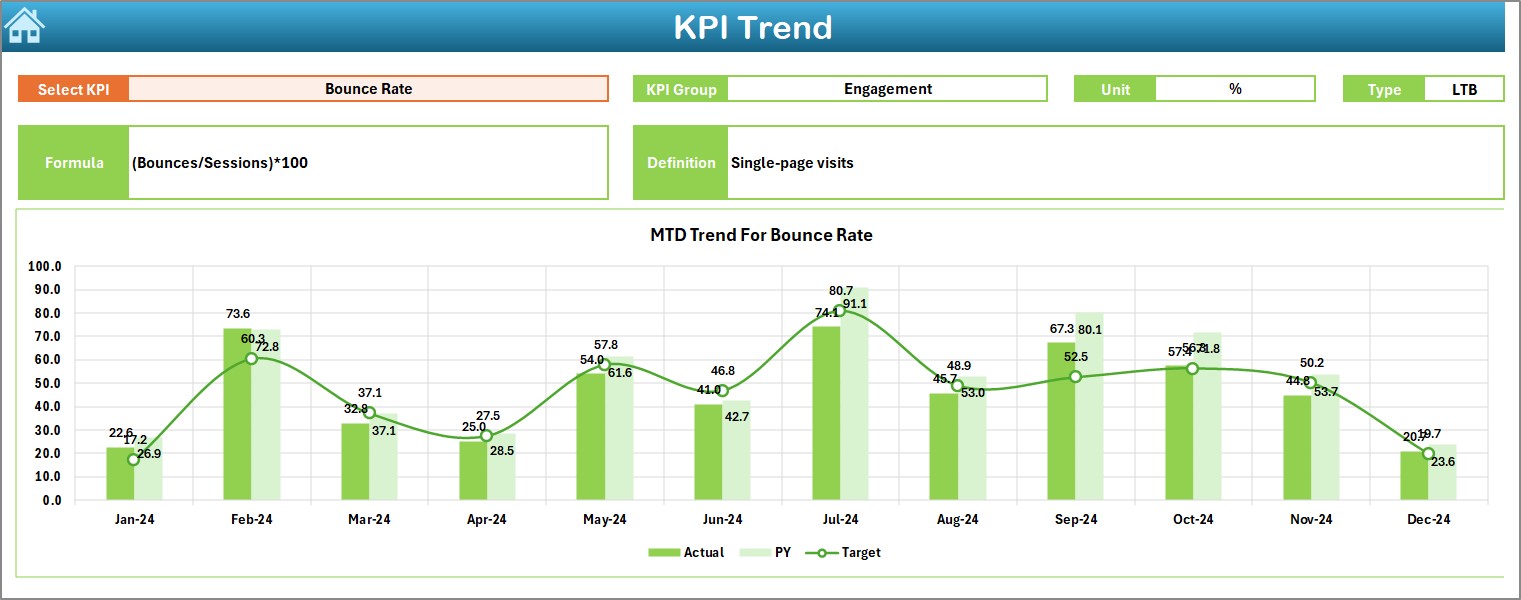
KPI Trend Sheet Tab
This tab allows you to track the trend of each KPI over time. You can select the KPI from a drop-down list, and the sheet will show:
- KPI Group: The group to which the KPI belongs.
- Unit of KPI: The unit in which the KPI is measured (e.g., sessions, clicks, bounce rate).
- Type of KPI: Whether it’s a “lower the better” or “upper the better” KPI.
- Formula: The formula used to calculate the KPI.
- KPI Definition: A brief description of what the KPI measures.
Click to buy Organic Search KPI Dashboard in Excel
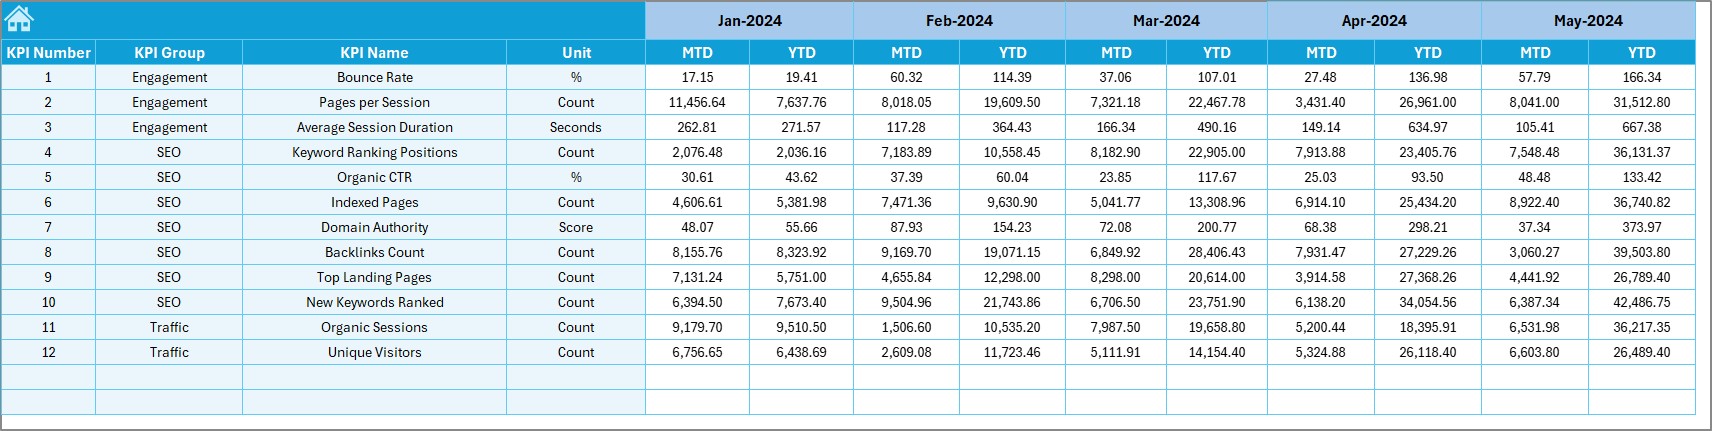
Actual Numbers Sheet Tab
This sheet is where you enter your actual performance data. You can input values for both MTD and YTD (Year-to-Date). The month can be selected from range E1, and this will automatically update all relevant data across the dashboard.
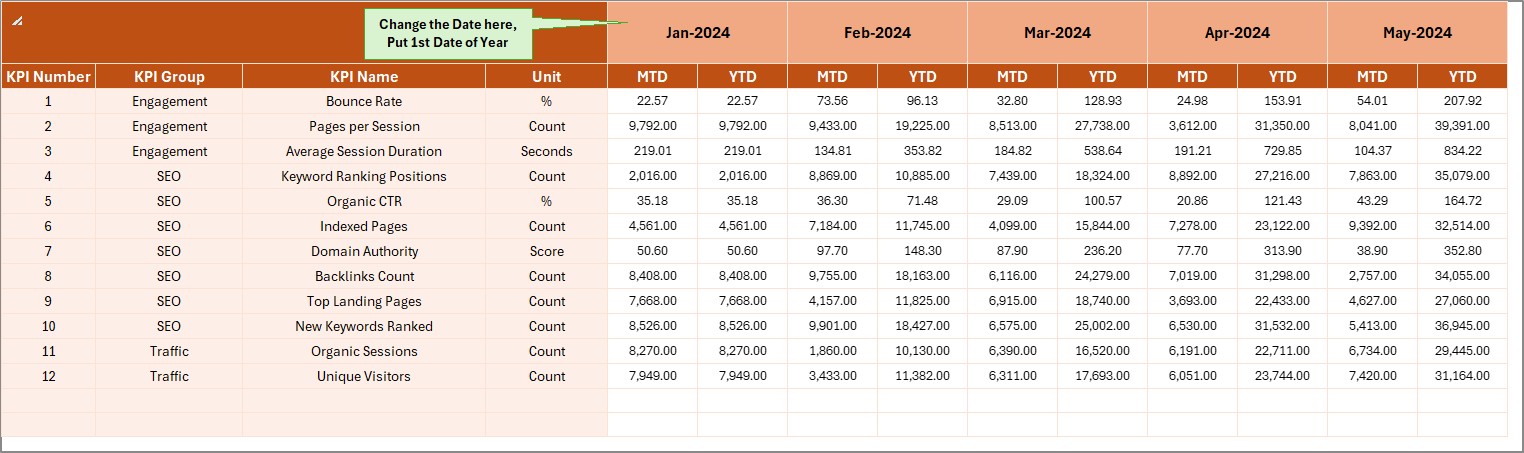
Target Sheet Tab
This is where you enter your target values for each KPI, both for MTD and YTD. Setting realistic targets is essential to measuring success and understanding how your performance compares to expectations.
Click to buy Organic Search KPI Dashboard in Excel
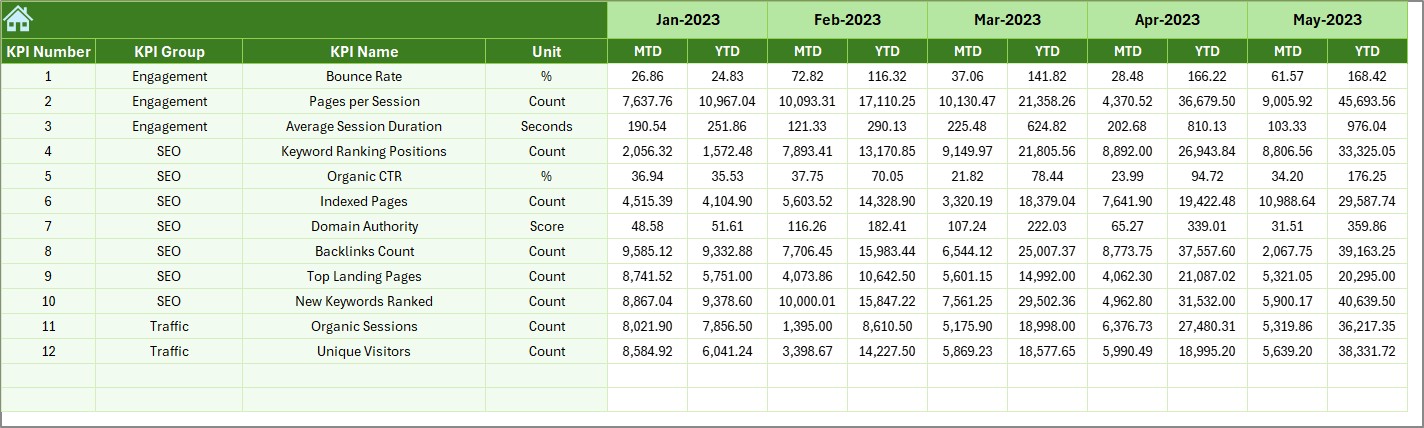
Previous Year Numbers Sheet Tab
This sheet is used to input data for the previous year. By comparing current performance with historical data, you can better understand trends and identify areas for improvement.
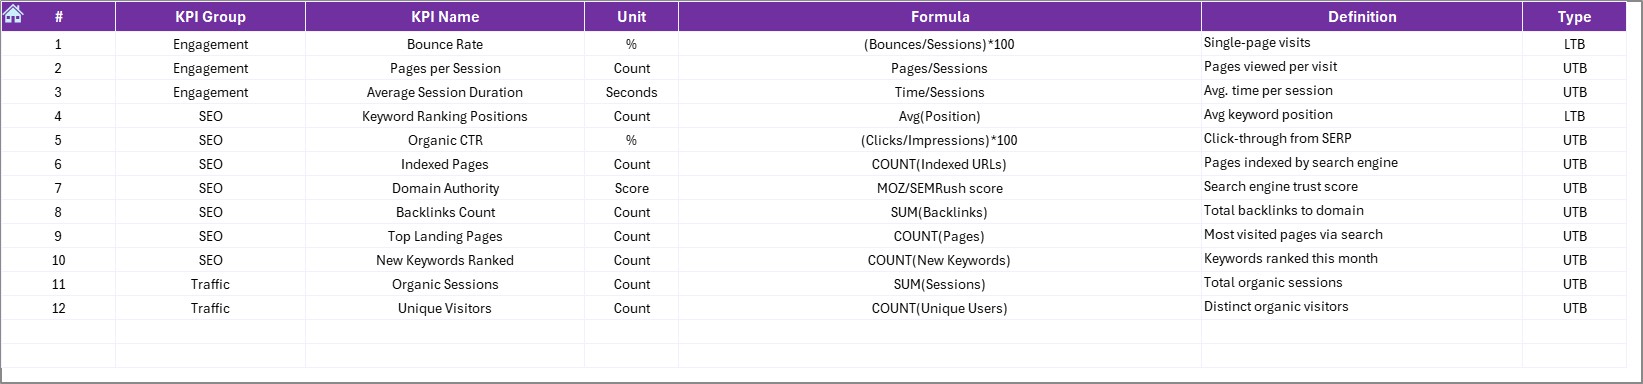
KPI Definition Sheet Tab
This sheet serves as a reference for all KPIs. It contains:
- KPI Name: The name of the KPI.
- KPI Group: The category the KPI belongs to (e.g., traffic, conversion rate).
- Unit: The unit of measurement for the KPI.
- Formula: The calculation method.
- KPI Definition: A description of what the KPI measures.
Click to buy Organic Search KPI Dashboard in Excel
Advantages of Organic Search KPI Dashboard in Excel
Using an Organic Search KPI Dashboard in Excel offers several benefits, including:
-
Centralized Data Tracking: All relevant organic search data is stored and visualized in one place, making it easy to monitor performance.
-
Better Decision-Making: By tracking key metrics like search rankings, traffic, and conversions, you can make more informed decisions about your SEO strategy.
-
Customizable: Excel dashboards are highly customizable, allowing you to tailor the dashboard to your specific needs and metrics.
-
Time-Saving: With a single, well-organized dashboard, you don’t need to jump between different reports and tools to gather data. This saves time and reduces the risk of errors.
-
Data Comparisons: You can easily compare your current performance with your set targets and historical data, enabling you to identify trends and opportunities for improvement.
Opportunities for Improvement in Organic Search KPI Dashboard
While the Organic Search KPI Dashboard in Excel provides a comprehensive view of your performance, there are always opportunities to enhance it further:
-
Integration with Google Analytics: You can improve the dashboard by linking it with your Google Analytics account for real-time data updates.
-
Advanced Data Visualization: Adding more advanced charts, such as sparklines or heatmaps, can enhance the dashboard’s ability to display trends and patterns.
-
Automation: Automating the data entry process through APIs or Excel macros can save you time and reduce manual effort.
-
More KPIs: Depending on your business needs, you can add more KPIs, such as organic search conversion rate or organic bounce rate, to provide deeper insights.
Best Practices for Using the Organic Search KPI Dashboard
Click to buy Organic Search KPI Dashboard in Excel
To make the most out of your Organic Search KPI Dashboard, follow these best practices:
-
Set Realistic Targets: Your targets should be based on historical data, industry standards, and competitive benchmarks. Setting achievable goals ensures you’re measuring progress accurately.
-
Regularly Update Data: Make sure the data in your dashboard is updated regularly (preferably monthly) to ensure you’re working with the most current information.
-
Monitor Trends: Focus on trends rather than individual data points. This allows you to identify patterns and make long-term improvements rather than reacting to short-term fluctuations.
-
Use Conditional Formatting Effectively: Leverage Excel’s conditional formatting to highlight KPIs that require attention. For example, using green for KPIs that exceed the target and red for those that fall short can make it easy to spot performance issues at a glance.
-
Leverage Multiple Views: Use the different views in the dashboard (MTD, YTD, PY vs. Actual) to get a comprehensive picture of your performance over different time periods.
Conclusion
An Organic Search KPI Dashboard in Excel is an essential tool for tracking and improving your SEO performance. By monitoring key metrics like keyword rankings, organic traffic, and conversion rates, you can optimize your strategy and increase your website’s visibility. The dashboard’s customizable features, trend tracking, and data comparisons provide a comprehensive view of your SEO efforts, enabling you to make data-driven decisions that drive better results.
By following best practices, regularly updating your data, and exploring opportunities for improvement, you can continually refine your SEO strategies to stay ahead of the competition.
Frequently Asked Questions (FAQs)
Click to buy Organic Search KPI Dashboard in Excel
1. What are the main KPIs to track in an Organic Search KPI Dashboard?
The main KPIs to track include organic traffic, keyword rankings, bounce rate, organic conversion rate, and click-through rate (CTR).
2. How can I customize the Organic Search KPI Dashboard in Excel?
You can customize the dashboard by adding or removing KPIs, adjusting target values, and applying custom formatting to suit your specific SEO goals.
3. Is it possible to link this dashboard with Google Analytics?
Yes, you can link your Excel dashboard to Google Analytics using APIs or manual data imports to get real-time data updates.
4. Can I track my website’s SEO performance over time?
Absolutely! The dashboard allows you to track performance over multiple time periods, including month-to-date (MTD), year-to-date (YTD), and previous year comparisons.
5. What should I do if I notice a drop in organic traffic?
Investigate the causes by looking at the affected keywords, on-page SEO factors, and any recent algorithm changes that might have impacted your rankings. Adjust your strategy accordingly.
Visit our YouTube channel to learn step-by-step video tutorials
Youtube.com/@NeotechNavigators
Watch the step-by-step video Demo:
Click to buy Organic Search KPI Dashboard in Excel