
Managing inventory effectively is crucial for businesses to prevent stockouts and maintain customer satisfaction. The Out-of-Stock Rate KPI Dashboard in Excel is a powerful tool that helps businesses track their stock levels, analyze trends, and make data-driven decisions. This ready-to-use template simplifies KPI monitoring with automated calculations, dynamic charts, and an interactive dashboard.
In this article, we will explore the features, advantages, and best practices for using the Out-of-Stock Rate KPI Dashboard in Excel to enhance inventory management.
Click to Out-of-Stock Rate KPI
What is an Out-of-Stock Rate KPI Dashboard?
The Out-of-Stock Rate KPI Dashboard is an Excel-based tool designed to monitor inventory performance by tracking stock availability. It provides an overview of stock levels across various timeframes, comparing monthly actuals, targets, and previous year data.
This dashboard ensures businesses can proactively manage inventory, avoid lost sales, and improve supply chain efficiency.
Key Features of the Out-of-Stock Rate KPI Dashboard
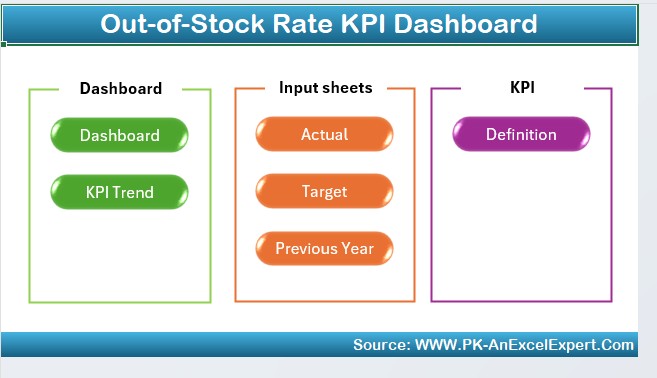
This dashboard consists of seven worksheets, each serving a specific function to enhance inventory tracking and analysis:
Home Sheet
- Acts as an index page for easy navigation.
- Includes six buttons to jump to different sheets, ensuring a user-friendly experience.
Dashboard Sheet Tab
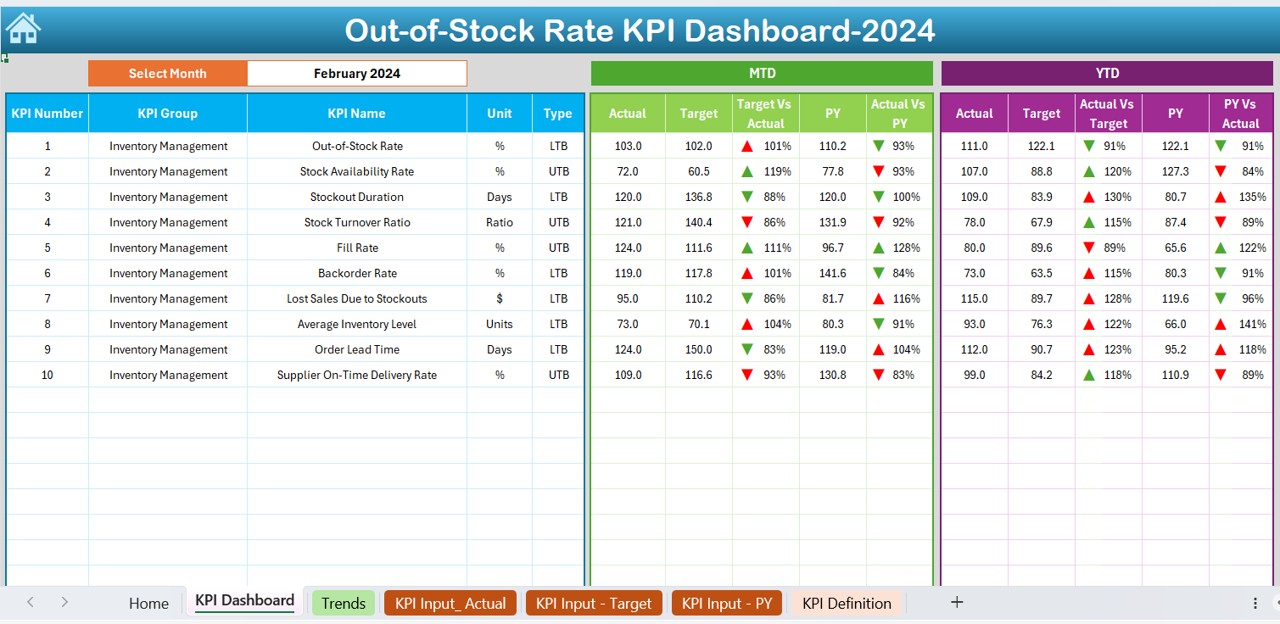
- Main dashboard displaying key metrics and insights.
- Drop-down selector at D3 to choose the desired month.
- Displays MTD (Month-to-Date) and YTD (Year-to-Date) actuals, targets, and previous year data.
- Uses conditional formatting with up/down arrows to indicate performance trends.
- Compares Target vs. Actual and PY vs. Actual dynamically.
Click to Out-of-Stock Rate KPI
KPI Trend Sheet Tab
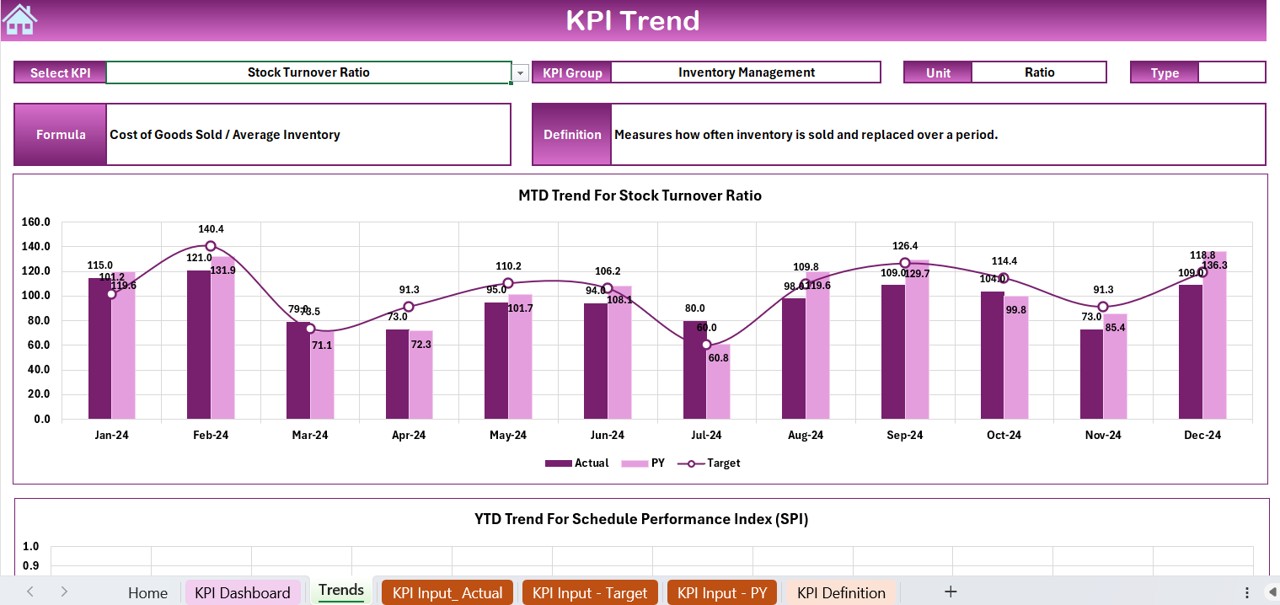
- Allows users to select a specific KPI using a drop-down menu (C3).
- Displays essential KPI details:
- KPI Group
- Unit of Measurement
- Type of KPI (Lower is Better / Upper is Better)
- Formula and Definition
- Provides MTD and YTD trend charts for actuals, targets, and previous year data.
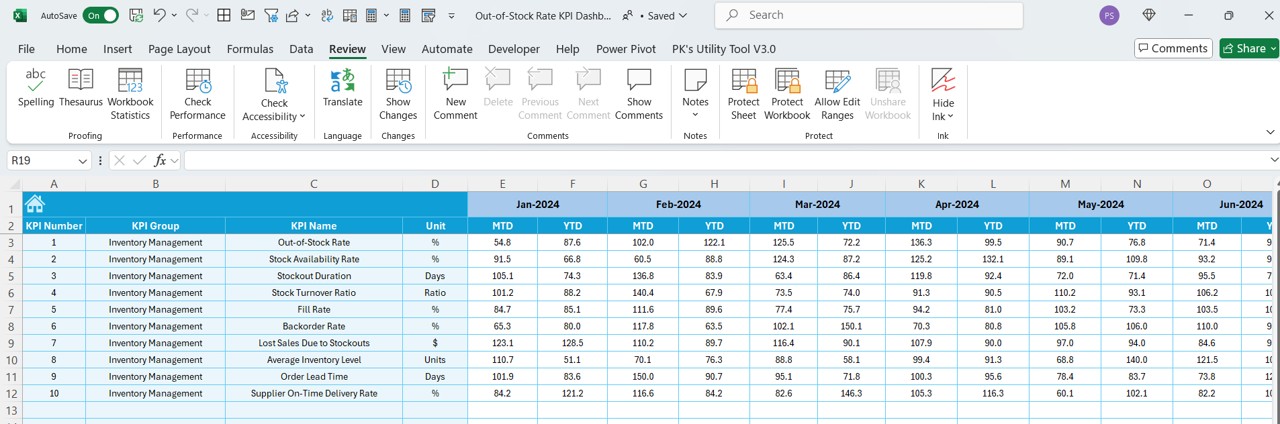
Actual Numbers Input Sheet
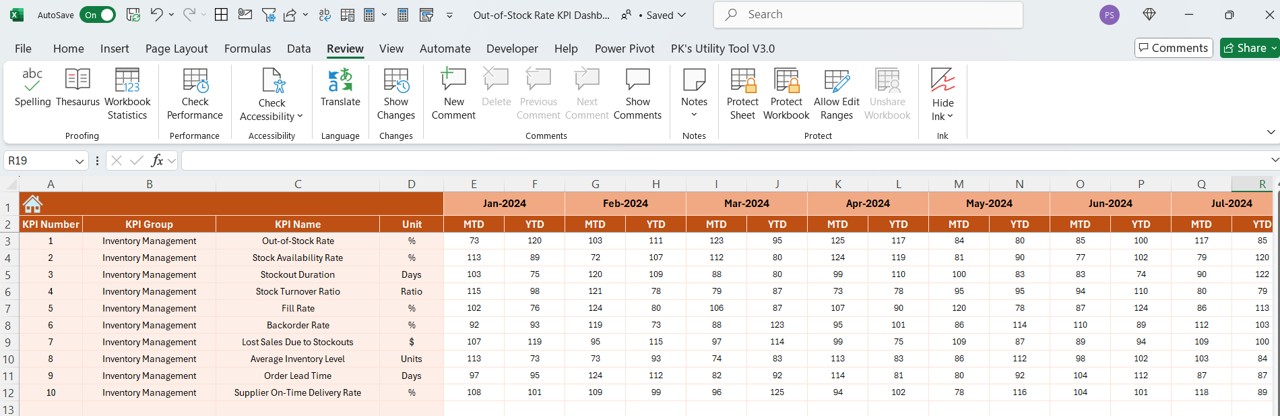
- User inputs actual inventory performance numbers for MTD and YTD.
- Dynamic month selection at E1 enables easy tracking of historical data.
Click to Out-of-Stock Rate KPI
Target Sheet Tab
- Users enter monthly target numbers for each KPI.
- Includes fields for both MTD and YTD targets.
Previous Year Number Sheet Tab
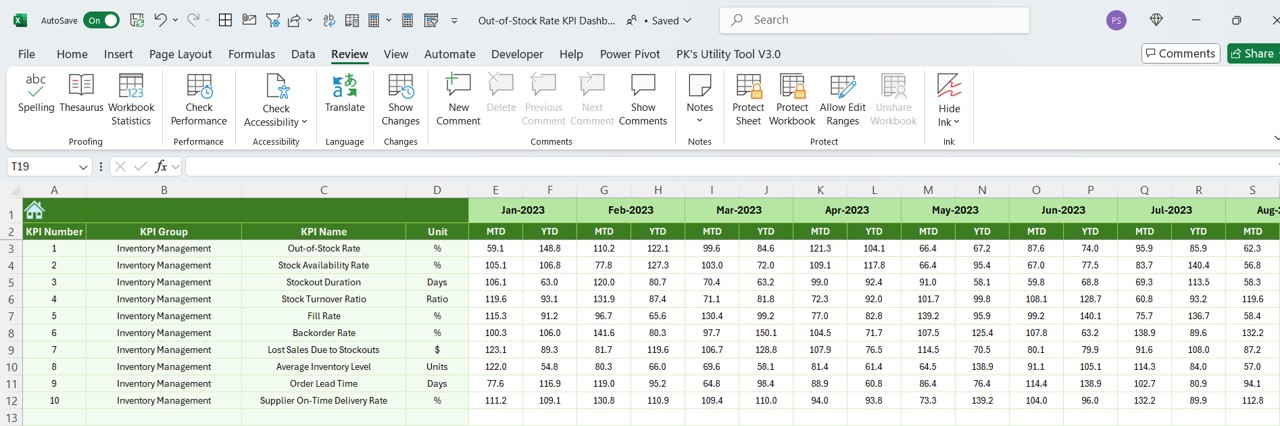
- Users enter data for the same period from the previous year.
- Helps in analyzing performance trends over time.
KPI Definition Sheet Tab
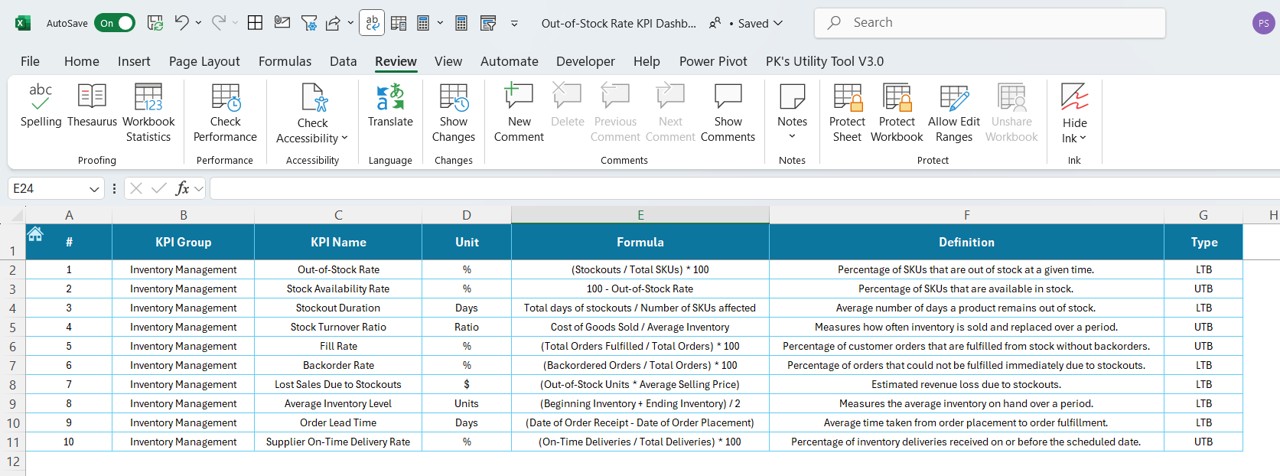
Stores detailed information about each KPI, including:
- KPI Name
- KPI Group
- Unit of Measurement
- Formula for Calculation
- KPI Definition
Click to Out-of-Stock Rate KPI
Advantages of the Out-of-Stock Rate KPI Dashboard
Using this KPI dashboard in Excel offers several benefits for businesses aiming to optimize inventory management:
Improved Inventory Visibility
- Provides a comprehensive view of stock levels across different timeframes.
- Helps in identifying patterns and trends to mitigate stockout risks.
Time-Saving and Automation
- Automates KPI calculations and reduces manual errors.
- Simplifies data input and visualization with dynamic charts.
Enhanced Decision-Making
- Compares MTD, YTD, and previous year data for better forecasting.
- Helps businesses set realistic targets and monitor performance effectively.
Real-Time Updates
- Any changes in actual, target, or previous year numbers instantly reflect on the dashboard.
- Drop-down selection allows quick month-to-month comparisons.
Easy Customization
- The dashboard is fully customizable, allowing businesses to adapt it to their specific needs.
- Additional KPIs or charts can be easily added based on business requirements.
Best Practices for Using the Out-of-Stock Rate KPI Dashboard
To maximize the effectiveness of this KPI dashboard, follow these best practices:
Regularly Update Data
- Ensure actual numbers, targets, and previous year data are entered accurately each month.
Monitor Trends Over Time
- Utilize the KPI Trend sheet to analyze patterns and forecast stock demands.
Set Realistic and Achievable Targets
- Use historical data and current performance to set realistic goals.
- Regularly review and adjust targets based on market conditions.
Leverage Conditional Formatting
- Pay attention to up/down arrows in the dashboard to identify stockout risks.
- Use these indicators to take proactive measures to prevent shortages.
Customize the Dashboard as Needed
- Modify charts, KPIs, and formulas to align with your business requirements.
Conclusion
The Out-of-Stock Rate KPI Dashboard in Excel is a powerful and efficient tool for managing inventory performance. By tracking key metrics, analyzing trends, and comparing performance over time, businesses can reduce stockouts, improve supply chain efficiency, and enhance overall operational success.
Frequently Asked Questions (FAQs)
What is the Out-of-Stock Rate KPI?
The Out-of-Stock Rate KPI measures the percentage of time a product is unavailable for sale. It helps businesses assess how effectively they manage inventory and meet customer demand.
How can I use the KPI Dashboard in Excel?
- This dashboard allows users to:
- Input actual numbers and targets
- Analyze trends over different timeframes
- Compare performance with previous years
- Identify inventory issues using conditional formatting indicators
Can I customize this dashboard for my business?
- Yes! This Excel dashboard is fully customizable. You can:
- Add new KPIs and data fields
- Modify charts and reports
- Adjust formulas based on business needs
How often should I update my KPI Dashboard?
For best results, update your dashboard at least once a month. Regular updates ensure accurate tracking and enable timely decision-making.
Why is it important to track Out-of-Stock Rate?
- Monitoring Out-of-Stock Rate KPI helps businesses:
- Reduce lost sales and improve revenue
- Enhance customer satisfaction
- Optimize inventory management and restocking strategies
Click to Out-of-Stock Rate KPI
Visit our YouTube channel to learn step-by-step video tutorials


