In today’s environmentally conscious world, businesses are making great efforts to reduce their environmental footprint. Packaging plays a vital role in this mission. However, monitoring and improving packaging sustainability isn’t just about making claims—it’s about tracking measurable results. That’s exactly where the Packaging Sustainability KPI Dashboard in Excel comes in. This smart, ready-to-use template helps you track, analyze, and improve your packaging performance.
In this detailed guide, we’ll walk you through everything you need to know about this powerful Excel-based KPI Dashboard.
Click to Packaging Sustainability KPI
What Is a Packaging Sustainability KPI Dashboard?
A Packaging Sustainability KPI Dashboard is a visual tool used to track key performance indicators (KPIs) related to sustainable packaging. These KPIs include metrics such as packaging material usage, recycled content, packaging weight, carbon footprint, and more. The goal is to help organizations monitor performance against sustainability goals in real-time and make better decisions.
When powered by Excel, this dashboard becomes even more flexible, customizable, and user-friendly. That means businesses of all sizes can start tracking their environmental goals without investing in expensive software.
Key Features of the Packaging Sustainability KPI Dashboard in Excel
This dashboard template comes with 7 thoughtfully designed worksheets, each with its own purpose:
Home Sheet

- This is the control center of the entire workbook.
- You’ll find 6 clickable buttons that instantly take you to the relevant sheet.
- It simplifies navigation and boosts user-friendliness.
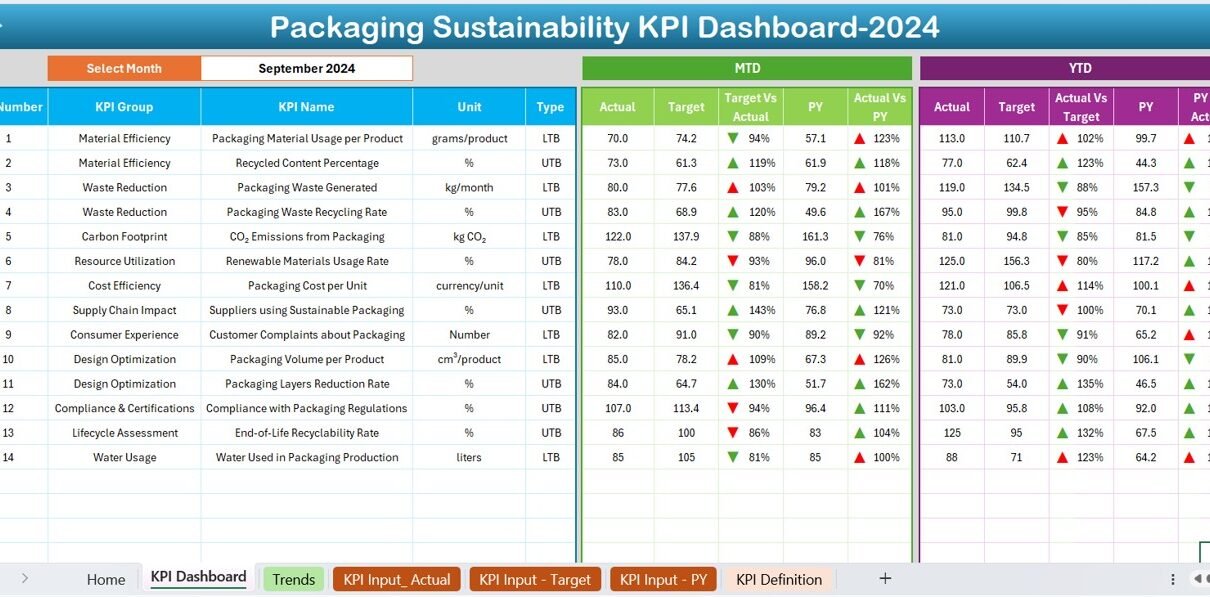
Dashboard Sheet

- This is the heart of the system where all the KPIs come together.
- At cell D3, you can select a month from a drop-down menu.
- The entire dashboard refreshes automatically to show metrics for that selected month.
- Displays Month-to-Date (MTD) and Year-to-Date (YTD) Actual, Target, and Previous Year data.
- Uses conditional formatting with arrows to show performance trends (e.g., target vs actual, previous year vs actual).
Click to Packaging Sustainability KPI
KPI Trend Sheet

- Select the KPI name from a drop-down list at cell C3.
- Shows detailed information for each KPI:
- KPI Group
- Unit of measurement
- Type (“Lower the Better” or “Upper the Better”)
Formula
- Definition
- Includes dynamic charts for MTD and YTD trends across Actual, Target, and Previous Year numbers.
Actual Numbers Input Sheet

- Enter MTD and YTD actual figures for each KPI.
- Use cell E1 to change the first month of the year.
- This sheet forms the backbone of your real-time tracking.
Target Sheet

- Input monthly and yearly target values for each KPI.
- These values are used to compare performance on the dashboard.
Previous Year Number Sheet

- Enter data for the same KPIs from the previous year.
- Enables year-over-year comparison and improvement analysis.
KPI Definition Sheet

- Create or modify your KPI list.
- Specify details such as:
- KPI Name
- Group
- Unit
- Formula
- Full definition
Why Should You Track Packaging Sustainability KPIs?
Tracking KPIs gives you a clear picture of your packaging impact. More importantly, it helps you make improvements where they matter the most. Some essential reasons to track packaging sustainability include:
- Identify waste and reduce material usage
- Improve recycling and compostability rates
- Comply with environmental regulations
- Make smarter decisions based on real data
- Boost brand reputation among eco-conscious customers
Advantages of the Packaging Sustainability KPI Dashboard in Excel
Let’s take a closer look at what makes this Excel template so powerful:
🚀 Easy to Use: You don’t need to be an Excel expert. The dashboard comes with pre-set formulas and drop-downs, making it accessible for all.
🌐 Real-Time Tracking: Switch between months and view updated metrics instantly, helping you stay on top of performance.
🏆 Target vs. Actual Performance: Get a clear view of where you stand against your sustainability targets and how far you’ve come from the previous year.
📈 Visual KPIs and Trends: With built-in charts and conditional formatting, spotting trends becomes quick and easy.
👨📋 Customizable and Scalable: You can add or remove KPIs, adjust targets, and personalize definitions to match your company’s goals.
🚀 Cost-Effective Solution: No need for pricey sustainability tracking software. Excel provides everything in one familiar place.
Best Practices for Using the Packaging Sustainability KPI Dashboard
To make the most of this tool, follow these best practices:
Set SMART KPIs
Your KPIs should be:
- Specific
- Measurable
- Achievable
- Relevant
- Time-bound
Update Data Regularly: Always enter the actual, target, and previous year numbers before reviewing the dashboard. Set monthly reminders.
Review Trends: Use the KPI Trend sheet to see how performance changes over time. Identify spikes or drops and find the root causes.
Align with Sustainability Goals: Make sure every KPI aligns with your larger environmental goals. Don’t track metrics just for the sake of it.
Train Your Team: Ensure all users understand how to use the dashboard. Provide quick guides or mini-training sessions.
Final Thoughts
Sustainability is not just a trend—it’s a responsibility. And tracking packaging-related KPIs is one of the smartest steps you can take. With this Excel-based Packaging Sustainability KPI Dashboard, you have everything you need to stay on track, stay compliant, and most importantly, stay green.
So why wait? Download your dashboard, plug in your data, and start your journey toward more sustainable packaging today!
Frequently Asked Questions (FAQs)
What KPIs should I include in the Packaging Sustainability Dashboard?
Include KPIs such as:
- Percentage of recyclable materials used
- Packaging material weight
- Packaging cost per unit
- Carbon emissions from packaging
- Percentage of compostable packaging
Can I use this dashboard for monthly and yearly tracking?
Click to Packaging Sustainability KPI
Yes. The dashboard allows Month-to-Date and Year-to-Date views, making it perfect for both monthly check-ins and annual reviews.
Is this dashboard suitable for small businesses?
Absolutely! It’s designed to be simple and budget-friendly, ideal for small and mid-sized companies aiming to improve packaging sustainability.
Can I add my own KPIs?
Yes, you can. Use the “KPI Definition” sheet to add or edit KPI names, formulas, and other details.
How often should I update the actual data?
It’s best to update your MTD and YTD numbers monthly. Regular updates keep your dashboard accurate and useful.
Do I need Excel expertise to use this?
Not at all. The dashboard is user-friendly, with drop-down menus, auto-updating charts, and simple input sheets.
Click to Packaging Sustainability KPI
Visit our YouTube channel to learn step-by-step video tutorials