Managing pension funds efficiently requires robust tracking of key performance indicators (KPIs). A Pension Fund KPI Dashboard in Excel is a powerful tool that provides real-time insights into fund performance, investment growth, and compliance with regulations. With the right dashboard, financial analysts, pension fund managers, and investors can make data-driven decisions effectively.
In this article, we will explore the Pension Fund KPI Dashboard in Excel, highlighting its features, advantages, best practices, and frequently asked questions.
Click to Pension Fund KPI
What is a Pension Fund KPI Dashboard in Excel?
A Pension Fund KPI Dashboard in Excel is a ready-to-use tool designed to track and visualize key pension fund performance metrics. It consolidates data in one place, allowing users to analyze trends, compare targets with actuals, and make informed decisions.
Key Features of the Pension Fund KPI Dashboard
This dashboard consists of seven worksheets, each serving a distinct purpose:
Home Sheet
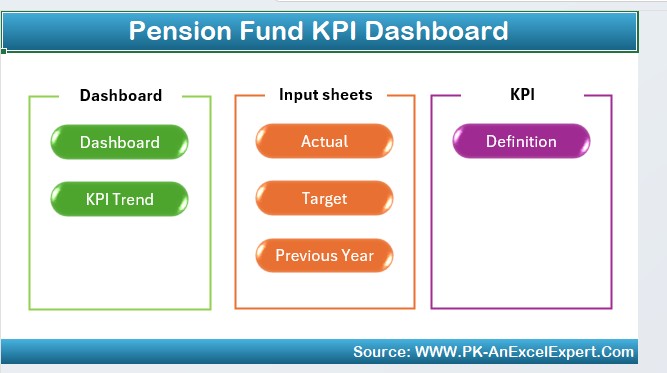
- Acts as the index page with navigation buttons for quick access to different sections.
- Contains six buttons linked to other sheets, ensuring easy usability.
Dashboard Sheet Tab
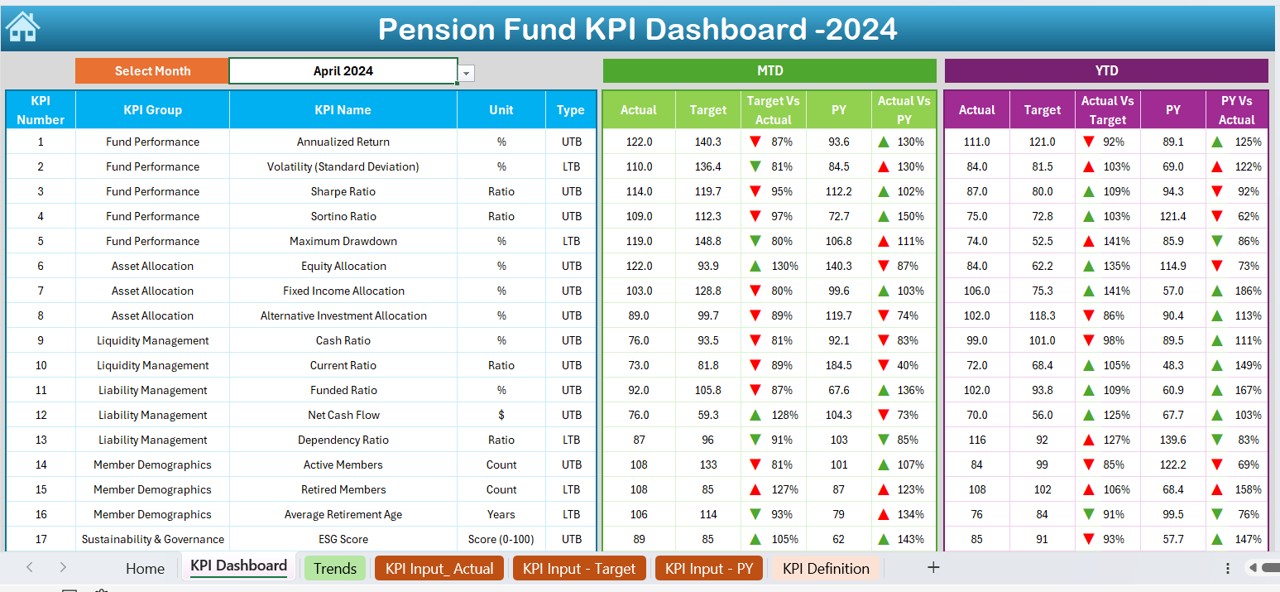
- The main reporting sheet that displays all KPIs visually.
- Users can select a month from a dropdown in D3, dynamically updating the dashboard.
- MTD (Month-to-Date) and YTD (Year-to-Date) comparisons:
- Actual vs. Target
- Actual vs. Previous Year (PY)
- Conditional formatting with up/down arrows for better visualization of trends.
Click to Pension Fund KPI
KPI Trend Sheet Tab
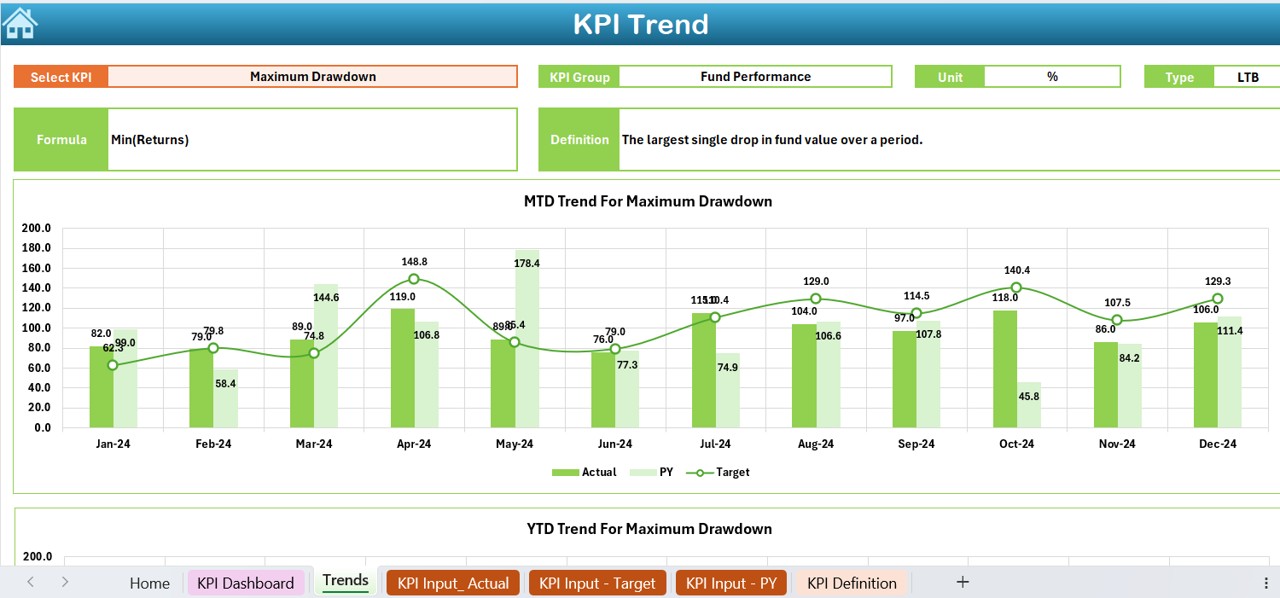
- Allows users to select a KPI from a dropdown in C3.
- Displays relevant KPI details:
- KPI Group
- Unit of measurement
- Performance type (Lower is better or Upper is better)
- KPI formula and definition
- Includes a trend chart comparing Actual, Target, and Previous Year values.
Actual Numbers Input Sheet
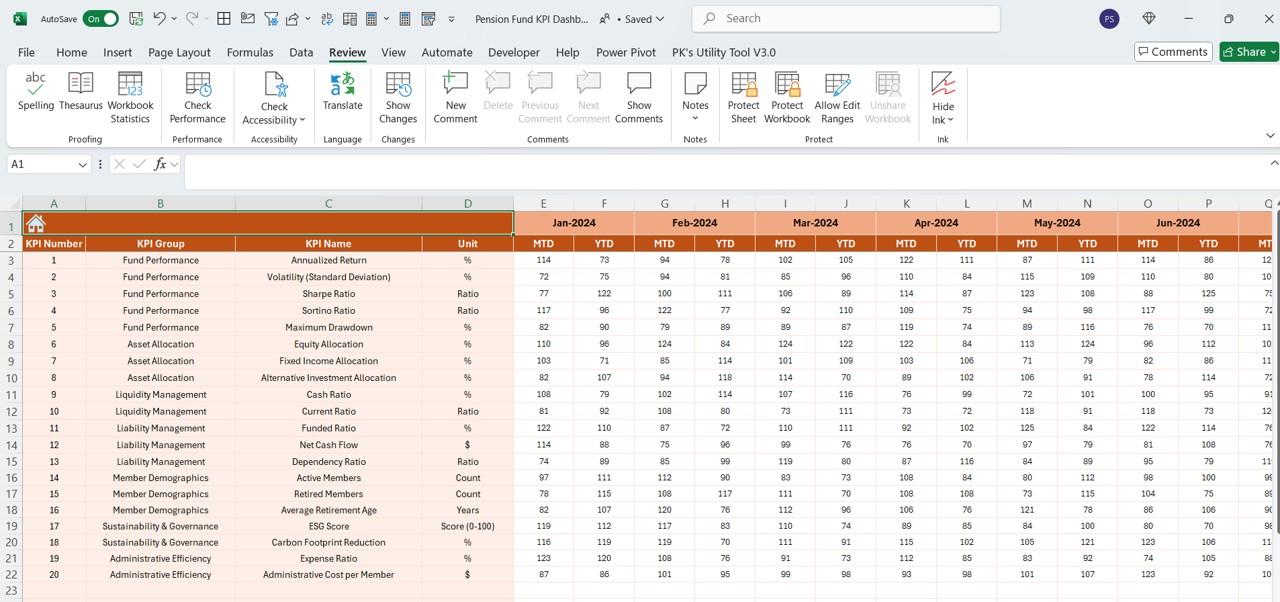
- Users input actual performance data for MTD and YTD.
- The month selection field (E1) allows users to enter the first month of the year, ensuring accurate reporting.
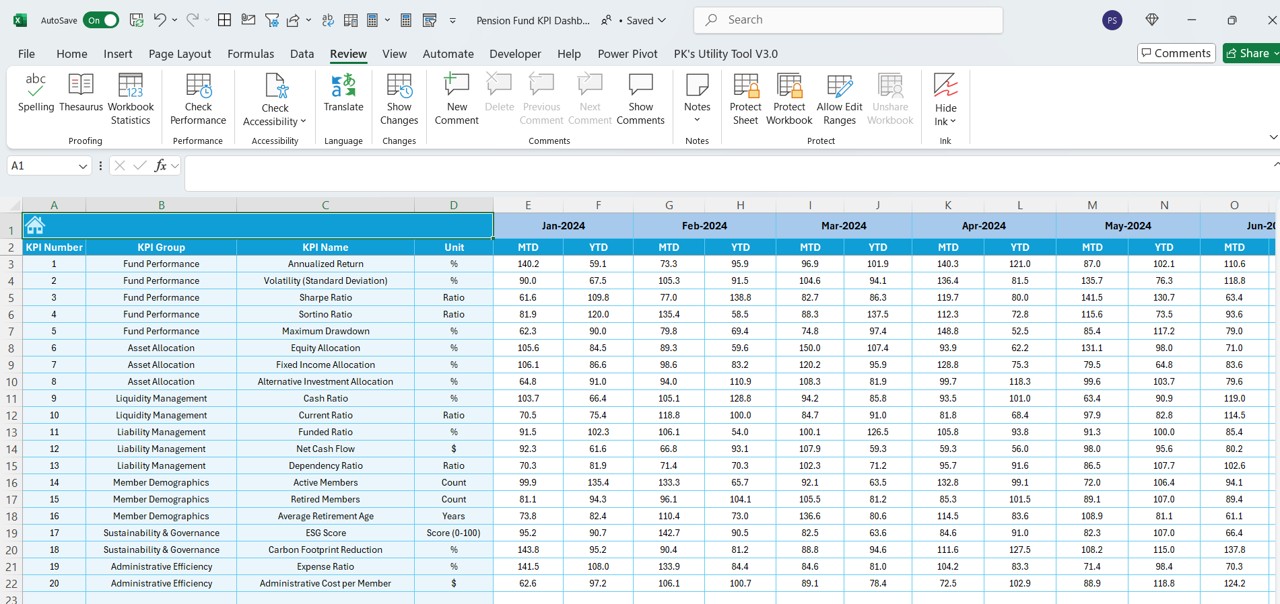
Target Sheet Tab
Click to Pension Fund KPI
- Stores the Target values for each KPI.
- Separate fields for MTD and YTD target values.
Previous Year Number Sheet Tab
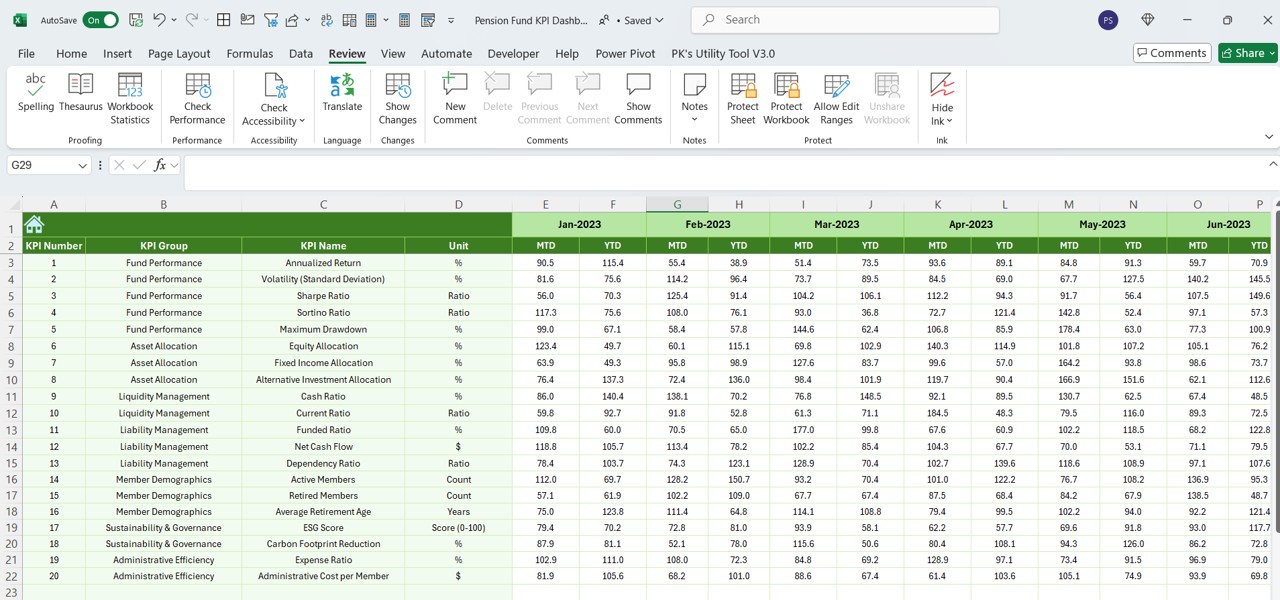
- Stores historical data from the previous year, following the same format as the current year’s input.
KPI Definition Sheet Tab
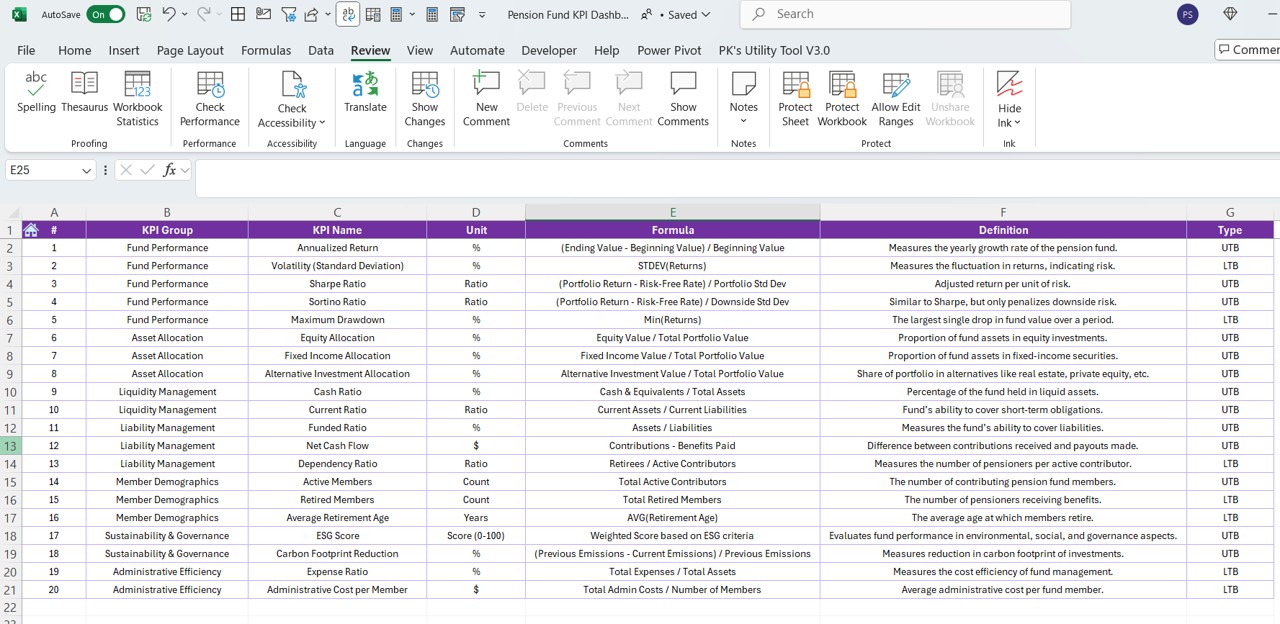
- Users define KPIs by entering:
- KPI Name
- KPI Group
- Unit of Measurement
- Formula
- Definition
Click to Pension Fund KPI
Advantages of Using a Pension Fund KPI Dashboard in Excel
Data Consolidation
Organizes all pension fund KPIs in a single, easy-to-use file.
Real-time Performance Tracking
Instantly updates financial trends based on actual vs. target values.
Historical Comparisons
Helps users compare performance across different years for better forecasting.
Informed Decision-Making
Empowers pension fund managers to make data-driven investment choices.
Customizable and Scalable
Can be tailored to include additional KPIs and reports as required.
Best Practices for Using the Pension Fund KPI Dashboard
Keep Data Updated
Regularly input actual numbers, target values, and previous year data to maintain accuracy.
Utilize Conditional Formatting
Use color codes and arrows to highlight areas needing attention.
Review KPI Trends Frequently
Analyze MTD and YTD trends to identify performance gaps early.
Customize KPIs as Needed
Modify KPI formulas and units to align with changing fund policies.
Automate Data Inputs Where Possible
Use Excel Power Query or VBA macros to reduce manual data entry errors.
Frequently Asked Questions (FAQs)
Who should use this Pension Fund KPI Dashboard?
This dashboard is ideal for pension fund managers, financial analysts, investment firms, and compliance officers who need a structured way to track fund performance.
Can I add more KPIs to the dashboard?
Yes! The dashboard is fully customizable. You can add new KPIs by updating the KPI Definition sheet and modifying the formulas in the Dashboard Sheet.
Click to Pension Fund KPI
How do I update the dashboard for a new financial year?
- To update the dashboard:
- Clear previous year’s data from the Actual Numbers Input sheet.
- Enter the new target values in the Target Sheet.
- Update historical data in the Previous Year Number Sheet.
Can I share this dashboard with my team?
Yes! You can share the Excel file with your team. However, to prevent accidental edits, consider protecting worksheets and using drop-down validations.
Does this dashboard support automation?
- Yes, you can enhance automation by using:
- Power Query for real-time data import.
- Excel VBA Macros for automated calculations.
- Pivot Tables and Slicers for interactive reporting.
Conclusion
A Pension Fund KPI Dashboard in Excel is a must-have tool for efficient fund management, performance tracking, and compliance reporting. It simplifies data visualization, supports historical comparisons, and enables financial experts to make data-driven investment decisions.
Click to Pension Fund KPI
Visit our YouTube channel to learn step-by-step video tutorials
View this post on Instagram