Performance appraisals play a crucial role in evaluating employee effectiveness and productivity. To simplify and streamline this process, a Performance Appraisal KPI Dashboard in Excel can be a game-changer. It allows organizations to measure key performance indicators (KPIs) efficiently and make data-driven decisions.
In this article, we will explore the features, advantages, and best practices for using a Performance Appraisal KPI Dashboard in Excel. We will also provide insights into setting up the dashboard and addressing common queries related to its implementation.
Click to Performance Appraisal KPI
What is a Performance Appraisal KPI Dashboard?
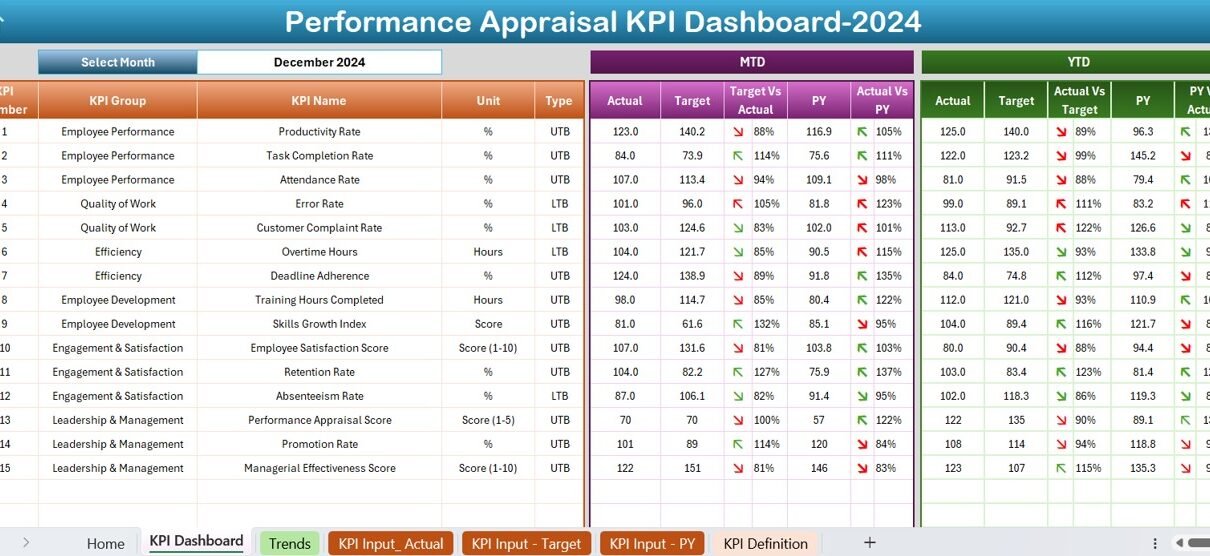
A Performance Appraisal KPI Dashboard is a structured tool in Excel that tracks employee performance using predefined Key Performance Indicators (KPIs). It provides a visual representation of the data, enabling HR professionals and managers to evaluate performance trends, set targets, and monitor achievements.
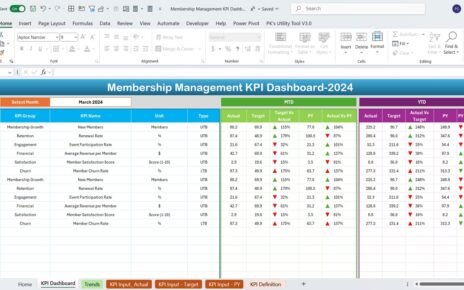
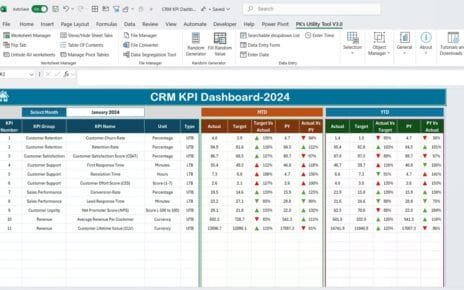
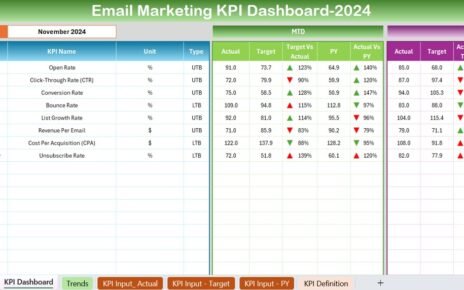
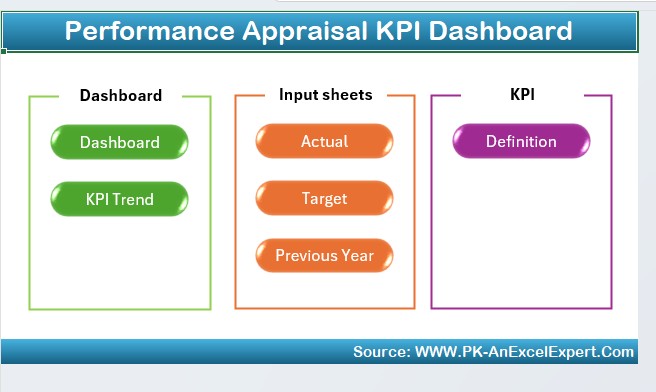
This dashboard typically consists of multiple sheets that store and display data in an organized manner. It includes input sheets, trend analysis charts, and summary views to facilitate better decision-making.
Key Features of the Performance Appraisal KPI Dashboard
The Performance Appraisal KPI Dashboard in Excel consists of 7 key worksheets, each serving a specific purpose:
Click to Performance Appraisal KPI
Home Sheet
- This is the index sheet of the dashboard.
- It provides six navigation buttons to jump to the respective sheets.
- Users can quickly access different sections of the dashboard for seamless usability.
Dashboard Sheet Tab
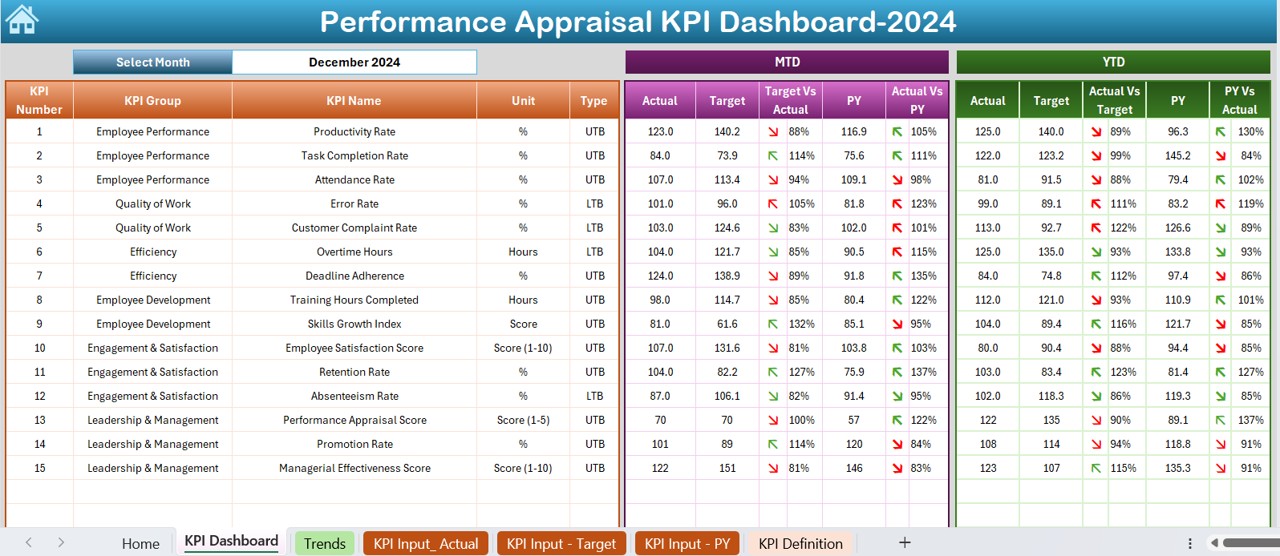
- The main sheet tab displaying the overall performance of all KPIs.
- Users can select a month from the drop-down in D3 to view performance data.
It includes:
- MTD (Month-to-Date) Actual, Target, and Previous Year Data
- YTD (Year-to-Date) Actual, Target, and Previous Year Data
- Comparisons of Target vs Actual & Previous Year vs Actual
- Conditional Formatting with Up/Down Arrows for trend insights
KPI Trend Sheet Tab
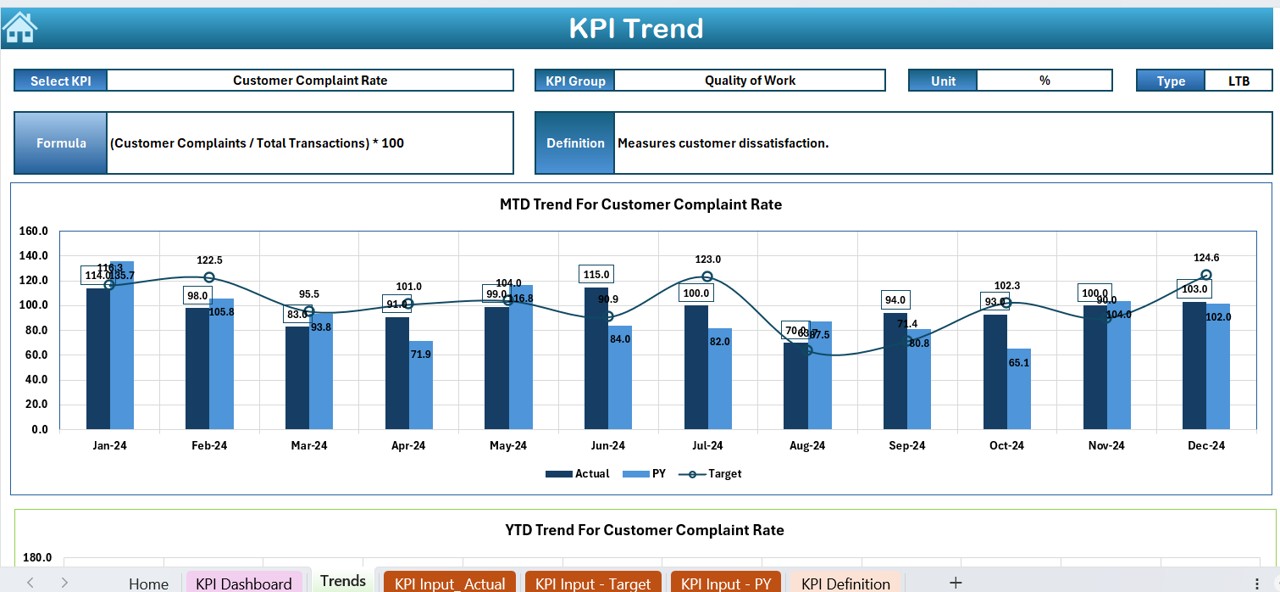
- Users can select a KPI from the drop-down in C3 to view trends.
- Displays critical KPI details:
- KPI Group
- Unit of Measurement
- KPI Type (Lower the Better or Upper the Better)
- Formula & Definition
- Trend charts showcasing MTD and YTD progress over time.
Click to Performance Appraisal KPI
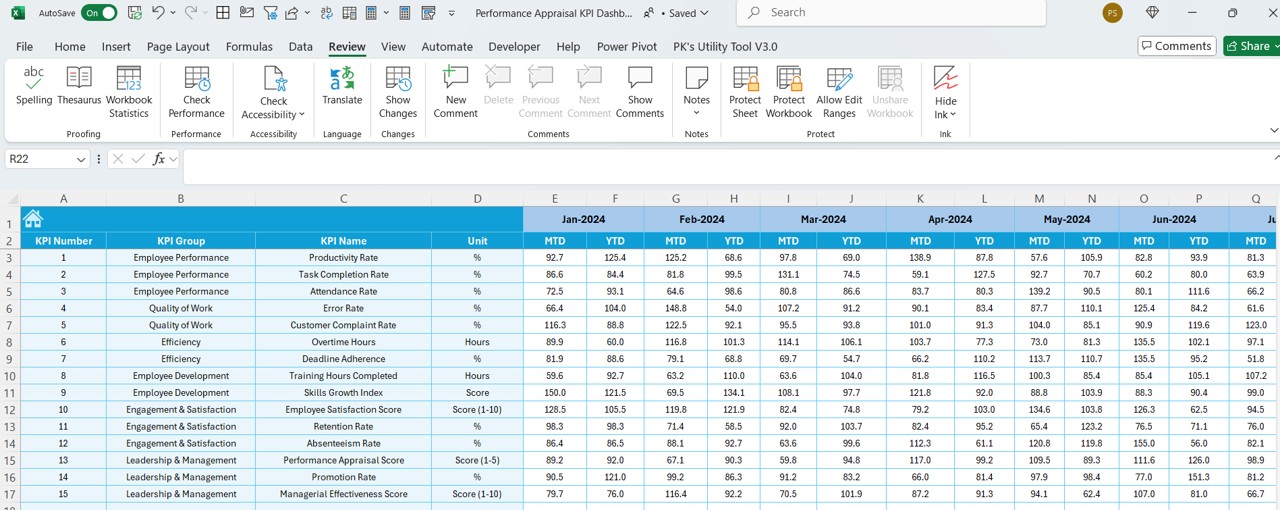
Actual Numbers Input Sheet
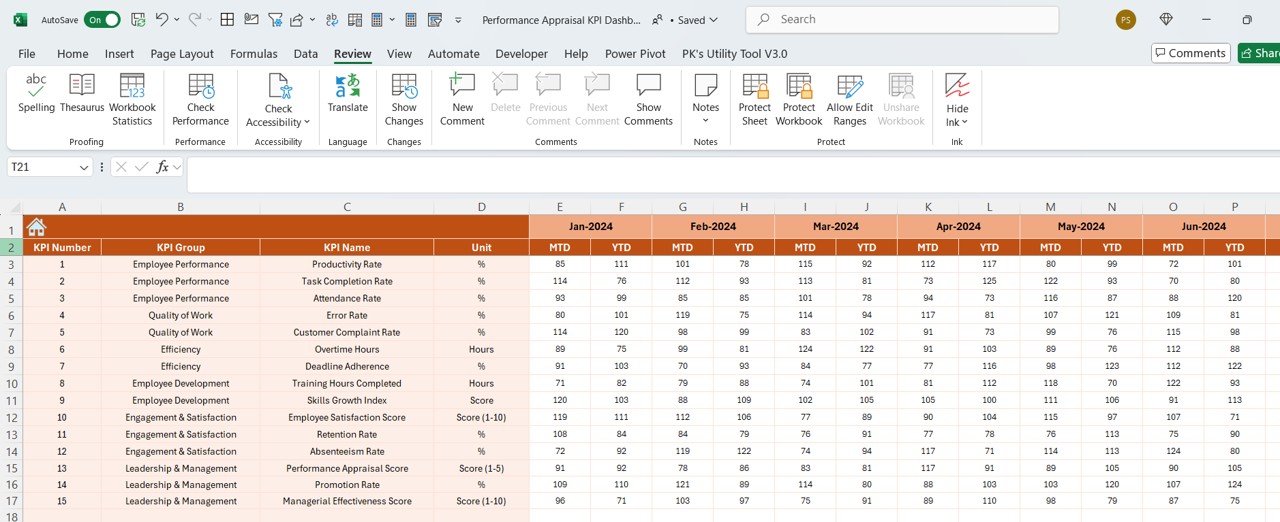
- This sheet captures monthly actual performance data.
- Users enter MTD and YTD values for each KPI.
- The first month of the year is set in E1, and all other months adjust accordingly.
Target Sheet Tab
- Here, users enter monthly performance targets for each KPI.
- Both MTD and YTD targets are recorded for analysis.
Previous Year Number Sheet Tab
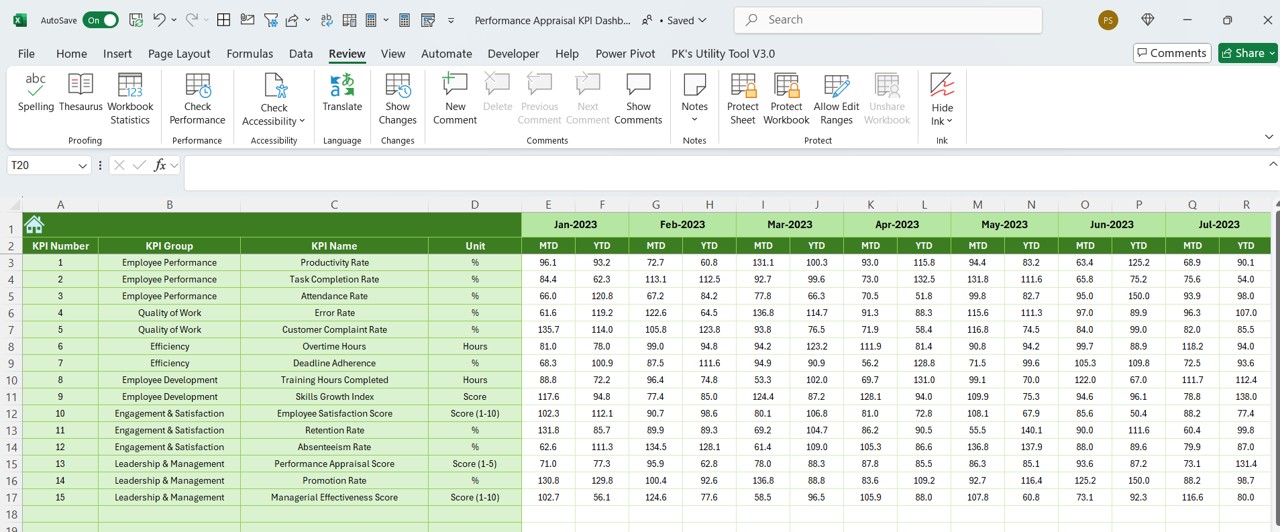
- Stores previous year’s MTD and YTD KPI data.
- Helps in performance comparison over different periods.
KPI Definition Sheet Tab
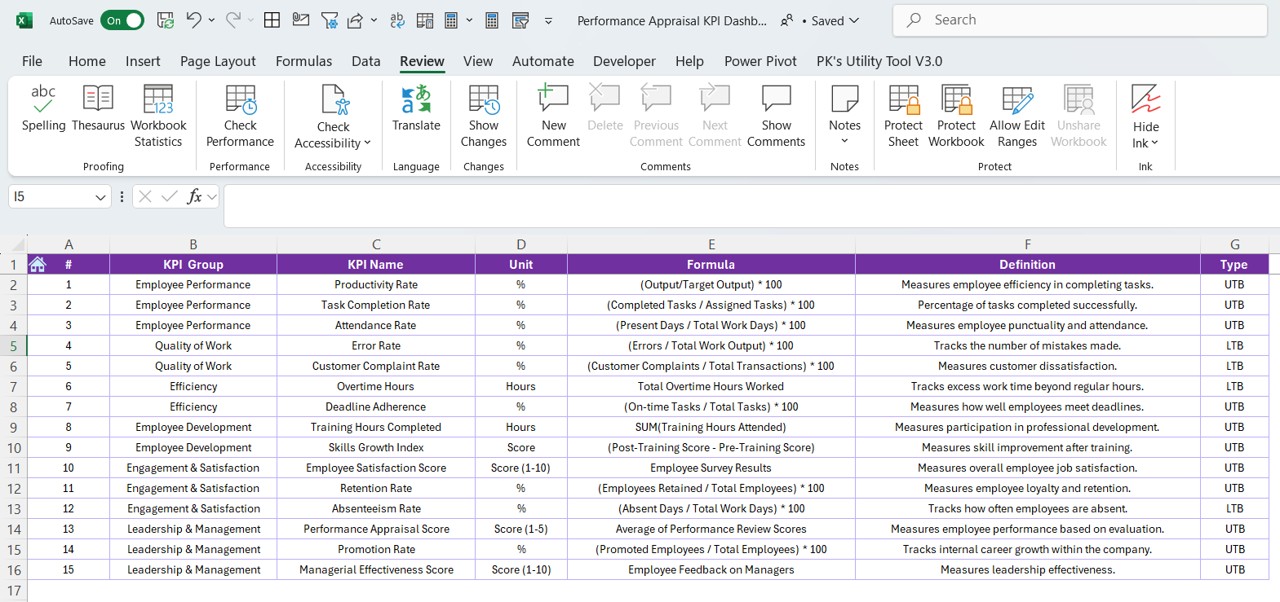
- Maintains a structured list of KPI Names, Groups, Units, and Formulas.
- Ensures clarity by defining what each KPI measures.
Click to Performance Appraisal KPI
Advantages of the Performance Appraisal KPI Dashboard
Enhanced Decision-Making
- Provides a clear visual representation of employee performance.
- Enables managers to make data-driven decisions.
Time-Saving & Efficiency
- Automates calculations and data aggregation.
- Eliminates manual tracking, reducing errors and saving time.
Improved Performance Tracking
- Offers real-time performance insights.
- Allows HR professionals to identify improvement areas quickly.
Customizable for Any Organization
- The KPI dashboard is fully customizable to match business-specific needs.
- Works for small, medium, and large organizations.
Easy Comparison & Benchmarking
- Compares MTD and YTD data with previous year’s numbers.
- Identifies trends using conditional formatting and graphical representation.
User-Friendly & Interactive
- Intuitive navigation with an easy-to-use interface.
- Drop-down selections and automated calculations enhance usability.
Best Practices for Using the Performance Appraisal KPI Dashboard
Define Clear and Relevant KPIs
- Ensure selected KPIs align with organizational goals.
- Use both quantitative and qualitative indicators.
Regular Data Updates
- Keep the dashboard updated with monthly actual and target values.
- Use a consistent data entry format to maintain accuracy.
Utilize Conditional Formatting for Insights
- Apply color codes, trend arrows, and alert indicators.
- Helps in identifying performance gaps instantly.
Leverage Visuals & Charts
- Use graphs and trend lines for a quick performance overview.
- Avoid information overload by keeping charts simple and to the point.
Monitor & Improve the Dashboard Regularly
- Periodically assess dashboard usability and effectiveness.
- Adapt the dashboard as per evolving business needs.
Click to Performance Appraisal KPI
Conclusion
A Performance Appraisal KPI Dashboard in Excel is an excellent tool for tracking employee performance efficiently. It provides a structured, data-driven approach to performance evaluations while offering real-time insights into key metrics.
Frequently Asked Questions (FAQs)
Why should I use a Performance Appraisal KPI Dashboard?
Using a KPI Dashboard helps organizations evaluate performance efficiently, make informed decisions, and streamline the appraisal process. It eliminates manual calculations and provides accurate performance insights.
Can I customize the dashboard for my organization?
Yes, the Performance Appraisal KPI Dashboard in Excel is fully customizable. You can add new KPIs, modify formulas, and tailor it according to your business requirements.
How often should I update the dashboard?
To ensure accurate tracking, update the dashboard monthly by entering actual and target values. Regular updates help in tracking trends effectively.
Can I integrate this dashboard with other HR tools?
Yes, you can export data from the Excel dashboard and integrate it with other HR software for a comprehensive performance management system.
Is this dashboard suitable for small businesses?
Absolutely! Whether you have a small team or a large enterprise, this dashboard is scalable and adaptable for any organization.
Click to Performance Appraisal KPI
Visit our YouTube channel to learn step-by-step video tutorials
View this post on Instagram