Performance marketing has become a central strategy for many businesses looking to optimize their marketing efforts, track their return on investment (ROI), and ensure that every dollar spent is contributing to measurable outcomes. One of the most effective tools for monitoring and improving performance marketing campaigns is a Performance Marketing KPI Dashboard. When integrated with Power BI, this dashboard becomes a dynamic and interactive tool that provides real-time insights into key performance indicators (KPIs), helping marketing teams make informed decisions and maximize their impact.
This article will walk you through the features, benefits, and best practices of using a Performance Marketing KPI Dashboard in Power BI, showcasing how it can transform the way businesses track and manage their marketing performance.
What is a Performance Marketing KPI Dashboard in Power BI?
A Performance Marketing KPI Dashboard in Power BI is an interactive visual tool designed to track key metrics related to performance marketing campaigns. These KPIs typically include metrics like click-through rates, conversion rates, return on ad spend (ROAS), customer acquisition cost (CAC), and other important indicators that help marketers assess how well their campaigns are performing.
With Power BI, the dashboard becomes more than just a static report. It allows users to interact with the data, filter by different criteria (such as month or campaign type), and gain real-time insights into their marketing efforts. This dynamic dashboard enables marketing teams to continuously monitor their performance, identify areas of improvement, and make data-driven decisions that optimize the impact of their campaigns.
Key Features of the Performance Marketing KPI Dashboard in Power BI
The Performance Marketing KPI Dashboard in Power BI template is comprehensive and easy to use. Below are the key features that make this dashboard an essential tool for tracking and improving your marketing performance:
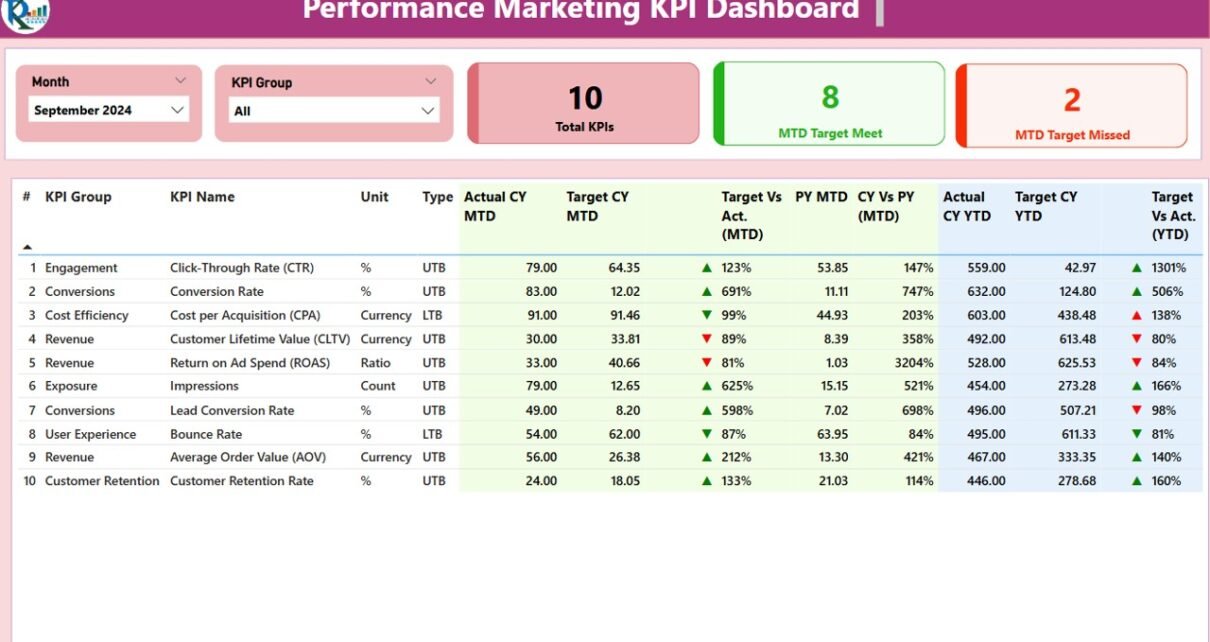
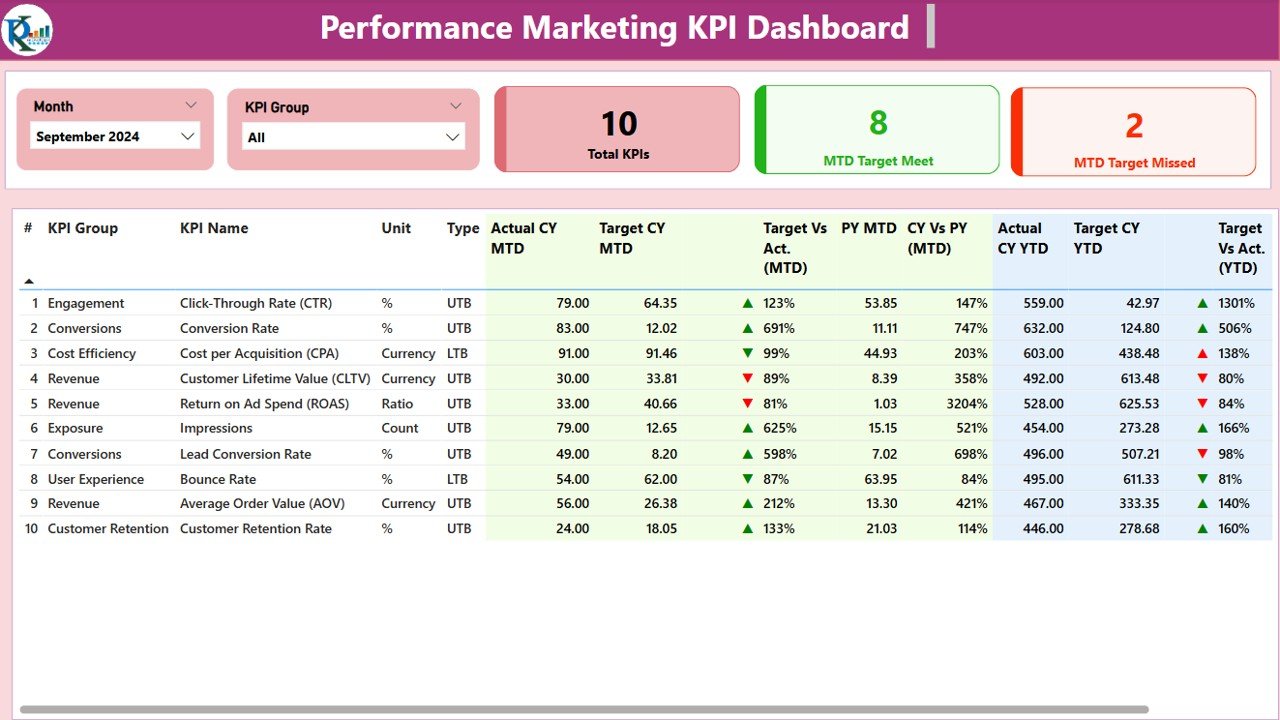
1. Summary Page
The Summary Page serves as the main page of the dashboard, providing an overview of your performance marketing KPIs. Here are the key elements of the summary page:
Month and KPI Group Slicer: These slicers allow you to filter data by month and by the group of KPIs you want to analyze. This feature adds flexibility to your analysis and enables you to focus on specific aspects of your campaigns.
KPIs Cards: Three cards display critical metrics:
- Total KPIs Count: The total number of KPIs being tracked in the dashboard.
- MTD Target Met Count: The number of KPIs where the Month-To-Date (MTD) target has been met.
- MTD Target Missed Count: The number of KPIs where the MTD target has been missed.
KPI Table: This table provides detailed information about each KPI, including:
- KPI Number: A unique sequential number for each KPI.
- KPI Group: The group or category to which the KPI belongs.
- KPI Name: The name of the performance marketing KPI.
- Unit: The unit of measurement for the KPI (e.g., percentage, dollar value).
- Type: Whether the KPI is “Lower the Better” (LTB) or “Upper the Better” (UTB).
- Actual CY MTD: The actual value for the current year’s MTD.
- Target CY MTD: The target value for the current year’s MTD.
- MTD Icon: Green and red arrows (▼ and ▲) indicate whether the KPI is meeting its MTD target.
- Target vs Actual (MTD): The percentage comparison between the actual MTD number and the target MTD number.
- PY MTD: The MTD number for the same period last year.
- CY vs PY (MTD): The percentage comparison between the current MTD and the previous year’s MTD.
- Actual CY YTD: The actual value for the current year’s Year-To-Date (YTD).
- Target CY YTD: The target value for the current year’s YTD.
- YTD Icon: Similar to MTD, showing whether the YTD target has been met (green) or missed (red).
- Target vs Actual (YTD): The percentage comparison between the actual YTD number and the target YTD number.
- PY YTD: The YTD number for the previous year.
- CY vs PY (YTD): The percentage comparison between the current year’s YTD and the previous year’s YTD.
Click to Purchase Performance Marketing KPI Dashboard in Power BI
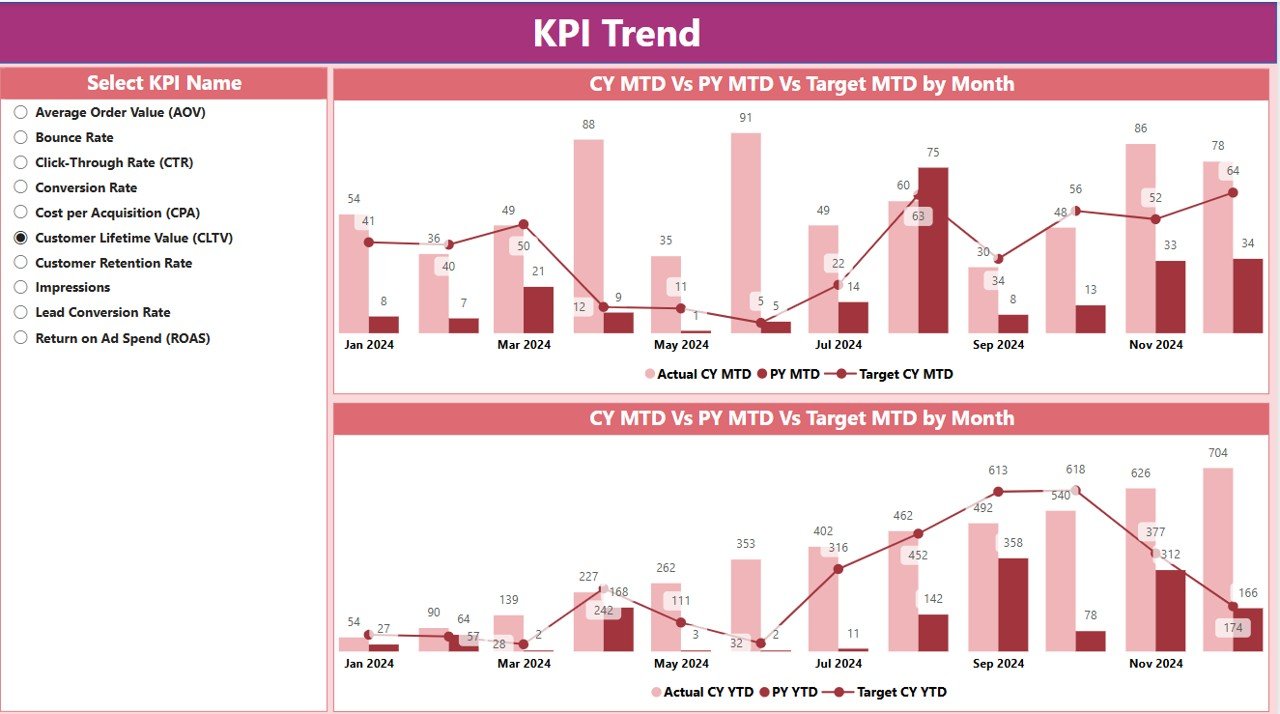
2. KPI Trend Page
The KPI Trend Page offers an in-depth view of how your KPIs are performing over time. It includes:
- Combo Charts: Two combo charts that show actual numbers for the Current Year (CY), Previous Year (PY), and Targets for both MTD and YTD.
- KPI Slicer: On the left side, there’s a slicer that lets you select a specific KPI to analyze. This feature enables you to track the performance of individual metrics over time.
The KPI Trend Page provides valuable insights into trends and patterns in your marketing performance, helping you understand how various metrics evolve throughout the year.
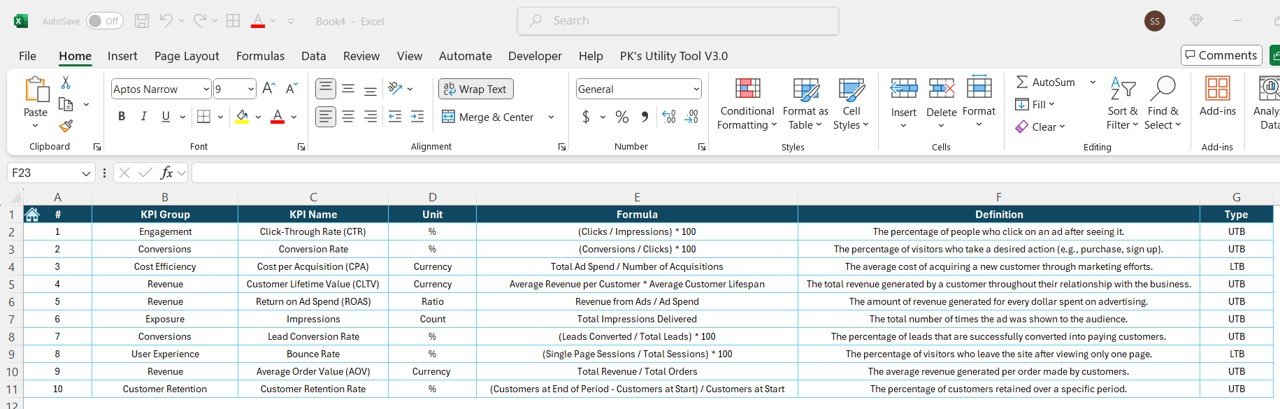
3. KPI Definition Page
The KPI Definition Page serves as a drill-through page that provides detailed information about each KPI. This page is hidden by default but can be accessed by drilling down from the Summary Page. On this page, you’ll find:
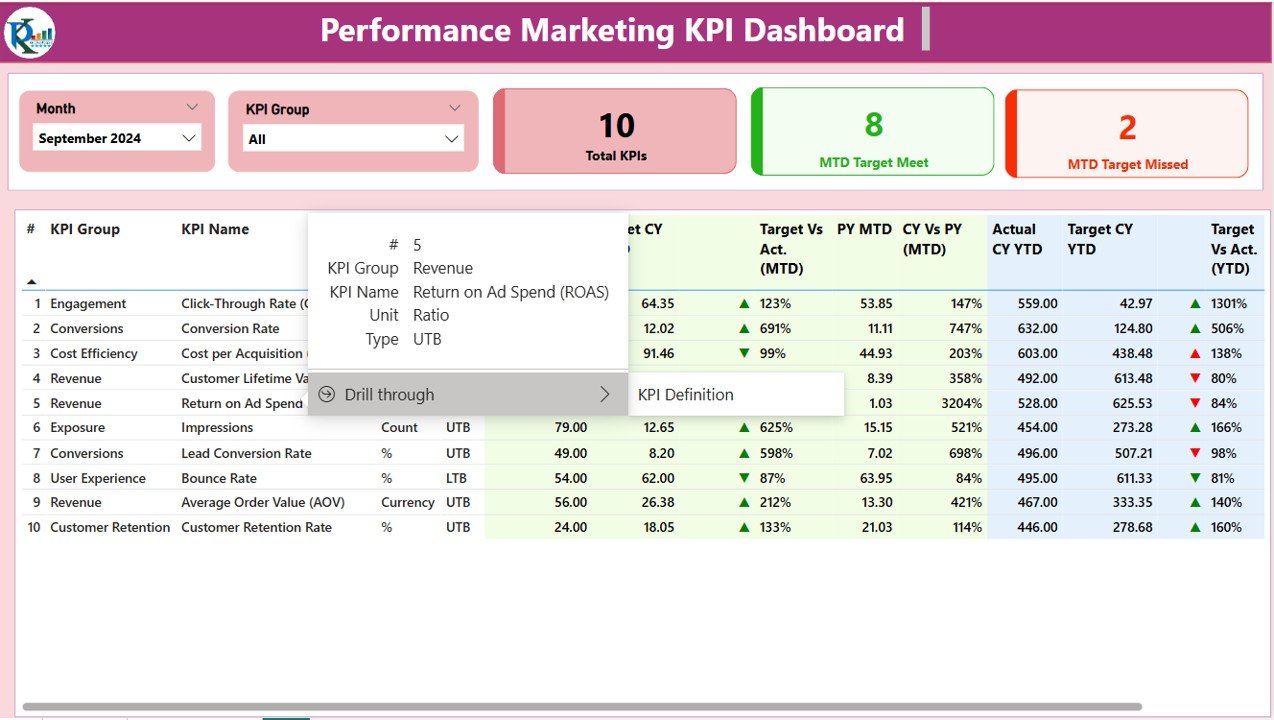
- KPI Formula and Definition: The formula used to calculate each KPI, along with a clear definition explaining what the KPI measures and why it’s important.
- Back Button: A button located in the top left corner that lets you quickly return to the Summary Page.

Click to Purchase Performance Marketing KPI Dashboard in Power BI
4. Excel Data Integration
The Performance Marketing KPI Dashboard uses an Excel data source, making it easy to input and update data. The Excel file consists of three main worksheets:
- Input_Actual Sheet: Where you input the actual values for each KPI, including MTD and YTD numbers.
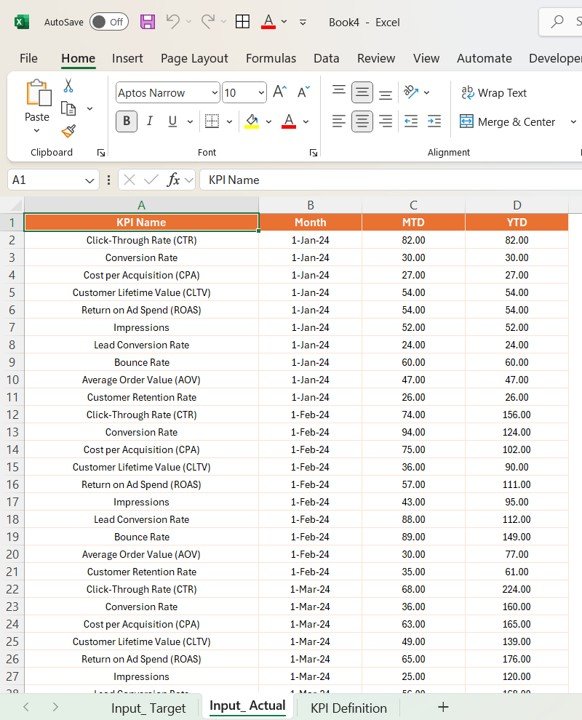
- Input_Target Sheet: Where you input the target values for each KPI, used to compare against the actual numbers.
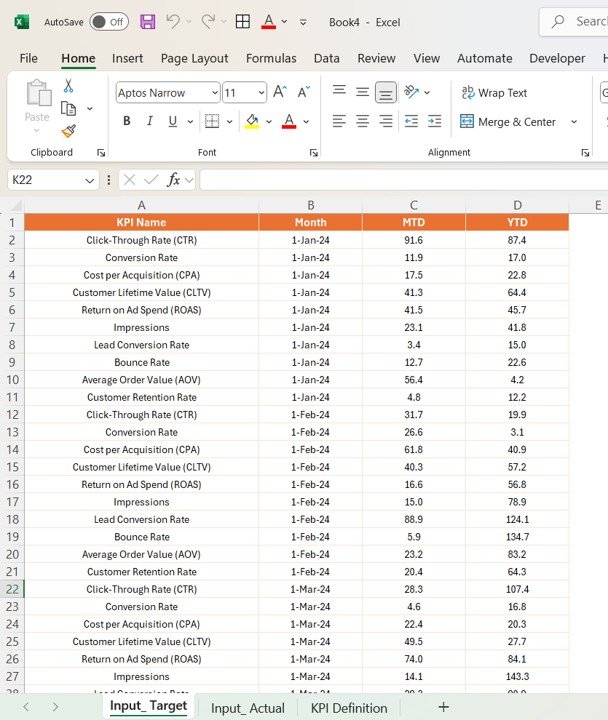
- KPI Definition Sheet: Contains details about each KPI, including its number, group, name, unit, formula, and type.
Advantages of Using the Performance Marketing KPI Dashboard in Power BI
The Performance Marketing KPI Dashboard in Power BI offers several key advantages that help marketers track performance and optimize their campaigns effectively:
- Centralized Tracking of Key Metrics: The dashboard consolidates all important marketing KPIs into one centralized platform, making it easier to monitor and compare data across different marketing channels.
- Real-Time Insights: The Power BI dashboard updates in real time, ensuring that marketers always have access to the most current data. As data is entered into Excel, it automatically reflects in Power BI, providing immediate insights.
- Visual Performance Indicators: Visual elements like green and red arrows, progress bars, and percentage comparisons help marketers quickly interpret their performance data and take immediate action if needed.
- Easy Data Exploration and Customization: Power BI allows marketers to easily explore the data by filtering and drilling down into specific KPIs. This customization capability enables a more detailed and tailored view of the performance data.
- Scalable and Flexible: The Performance Marketing KPI Dashboard is scalable and flexible, allowing you to track a wide range of KPIs for different marketing channels, campaigns, and periods.
Opportunity for Improvement in the Performance Marketing KPI Dashboard
While the Performance Marketing KPI Dashboard is highly effective, there are opportunities to improve its functionality further:
- Integration with Additional Data Sources: Integrating the dashboard with more data sources, such as your CRM, social media platforms, or Google Analytics, could provide a more holistic view of your marketing performance.
- Automating Data Updates: You can automate data updates by connecting Power BI to other systems via APIs or using tools like Microsoft Flow. This would reduce the need for manual data entry and ensure more accurate reporting.
- Add More Advanced Analytics Features: You could expand the dashboard to include more advanced analytics, such as predictive analytics or cohort analysis, to uncover deeper insights into your marketing performance.
Best Practices for Using the Performance Marketing KPI Dashboard
To maximize the effectiveness of the Performance Marketing KPI Dashboard, follow these best practices:
- Regularly Update the Data: Ensure that the data is updated regularly to keep the dashboard accurate and relevant. Schedule frequent data updates to maintain up-to-date insights.
- Set Clear Marketing Goals: Define clear, measurable marketing goals and use the dashboard to track your progress against them. This will help ensure that your marketing efforts stay aligned with overall business objectives.
- Analyze Long-Term Trends: Use the KPI Trend Page to track long-term trends in your marketing data. This can help identify emerging patterns and give you the opportunity to adjust strategies before issues escalate.
- Share the Dashboard with Key Stakeholders: Share the dashboard with your marketing team, executives, and other key stakeholders to keep everyone aligned on the status of your marketing campaigns and performance.
Conclusion
The Performance Marketing KPI Dashboard in Power BI is an essential tool for any organization looking to optimize its marketing performance. It provides a clear, real-time view of key marketing metrics, helping marketers stay on top of their campaigns, track ROI, and make data-driven decisions. With its user-friendly design, interactive features, and powerful analytics capabilities, the dashboard empowers marketing teams to drive results and continuously improve their strategies.
Frequently Asked Questions (FAQs)
1. What is a Performance Marketing KPI Dashboard in Power BI?
It’s an interactive tool that helps businesses track and analyze the performance of their marketing campaigns by monitoring key KPIs like ROI, conversion rates, and customer acquisition cost.
2. How can I customize the dashboard for my needs?
The dashboard can be customized by adding or removing KPIs, adjusting visual elements, and integrating additional data sources like social media or Google Analytics.
3. Can this dashboard help track ROI and other marketing metrics?
Yes, the dashboard tracks key performance metrics such as Return on Ad Spend (ROAS), Customer Acquisition Cost (CAC), Conversion Rates, and more, making it ideal for evaluating marketing ROI.
4. How do I update the data in the Performance Marketing KPI Dashboard?
You update the data by inputting values into the Excel file, which is linked to Power BI. Once the data is entered, it automatically updates the dashboard.
5. Is the dashboard suitable for large marketing teams or businesses?
Absolutely! The Performance Marketing KPI Dashboard is designed to scale for businesses of all sizes, allowing multiple users to access and collaborate on the data.
Visit our YouTube channel to learn step-by-step video tutorials
View this post on Instagram