In the fast-paced world of personal finance, tracking and managing your investments can feel overwhelming. But what if there was a way to simplify this process, allowing you to easily track key metrics and optimize your investment strategy? That’s where a Personal Investment KPI Dashboard comes into play. This powerful tool provides you with a clear, actionable view of your investments, enabling you to make informed decisions that align with your financial goals.
In this article, we will explore everything you need to know about creating and using a Personal Investment KPI Dashboard, from understanding the key performance indicators (KPIs) that matter most to how to use the dashboard effectively. We’ll break down the features, benefits, and best practices of using this tool and provide tips on how you can implement it into your personal finance strategy.
What is a Personal Investment KPI Dashboard?
A Personal Investment KPI Dashboard is a visually appealing and data-driven tool that allows investors to track the performance of their investments in real-time. By displaying key metrics and trends, this dashboard helps you gauge the health of your investment portfolio and make informed decisions. With a Personal Investment KPI Dashboard, you can track everything from portfolio diversification to return on investment (ROI) and risk levels.
Why You Need a Personal Investment KPI Dashboard
When it comes to personal finance, staying on top of your investments is crucial. Many investors find themselves overwhelmed by the complexity of managing multiple assets, from stocks and bonds to real estate and retirement accounts. A Personal Investment KPI Dashboard simplifies this process by providing a consolidated view of your investment data in one place. Here’s why it’s essential for every investor:
- Improved Decision Making: A dashboard gives you real-time insights into the performance of your investments, helping you make timely and informed decisions.
- Simplified Tracking: Instead of manually calculating the performance of each investment, the dashboard tracks your KPIs for you, saving time and reducing errors.
- Better Risk Management: With key metrics such as volatility and beta, you can better assess the risk levels of your investments and adjust your strategy accordingly.
Key Features of a Personal Investment KPI Dashboard
A Personal Investment KPI Dashboard typically includes several key features designed to help you track and manage your investments effectively. Below, we’ll dive into the specific elements that make up the dashboard and how they help you manage your investments.
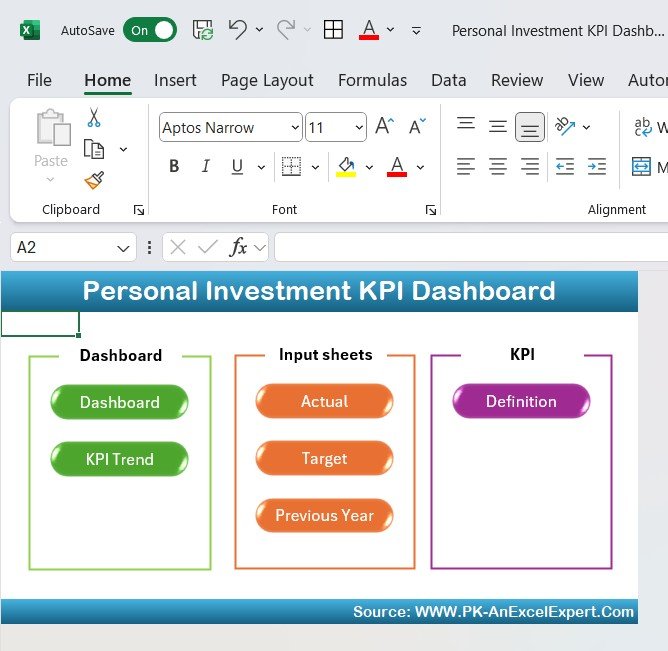
1. Home Sheet
The Home Sheet serves as the index of your dashboard. It acts as a central hub where you can quickly navigate to different sections of the dashboard. With six buttons, you can easily jump to specific sheets such as the Dashboard Sheet, KPI Trend Sheet, Actual Number Sheet, and more.
Click to buy Personal Investment KPI Dashboard in Excel
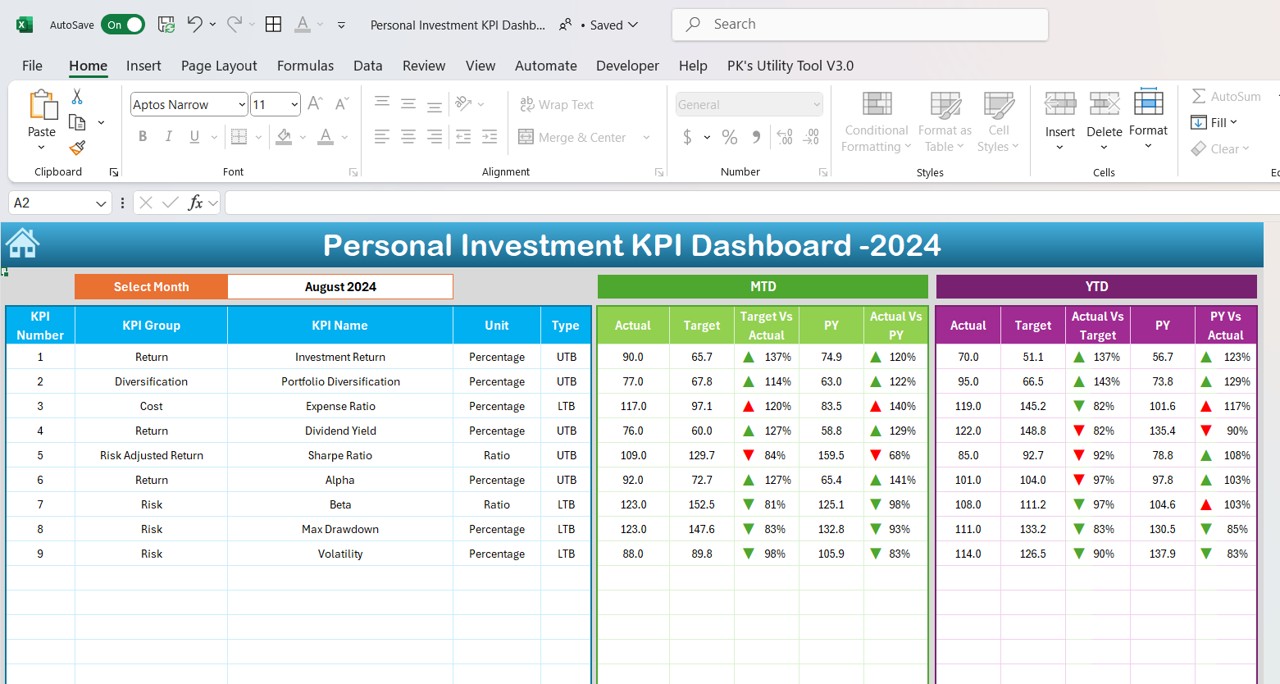
2. Dashboard Sheet Tab
This is the main tab of your Personal Investment KPI Dashboard, where all of your key data is displayed. The dashboard is interactive, allowing you to select the month from a drop-down menu. Once the month is selected, all the numbers in the dashboard will automatically update for that particular month.
On this sheet, you’ll find the following KPIs:
Click to buy Personal Investment KPI Dashboard in Excel
-
MTD (Month-To-Date) Actual, Target, and Previous Year Data: These figures allow you to track the performance of your investments in the current month against your target and the previous year’s data. The Target vs Actual and Previous Year vs Actual comparisons are displayed using conditional formatting, with up/down arrows indicating positive or negative trends.
-
YTD (Year-To-Date) Actual, Target, and Previous Year Data: The same comparison metrics are displayed for year-to-date data, providing you with a broader view of your investment performance.
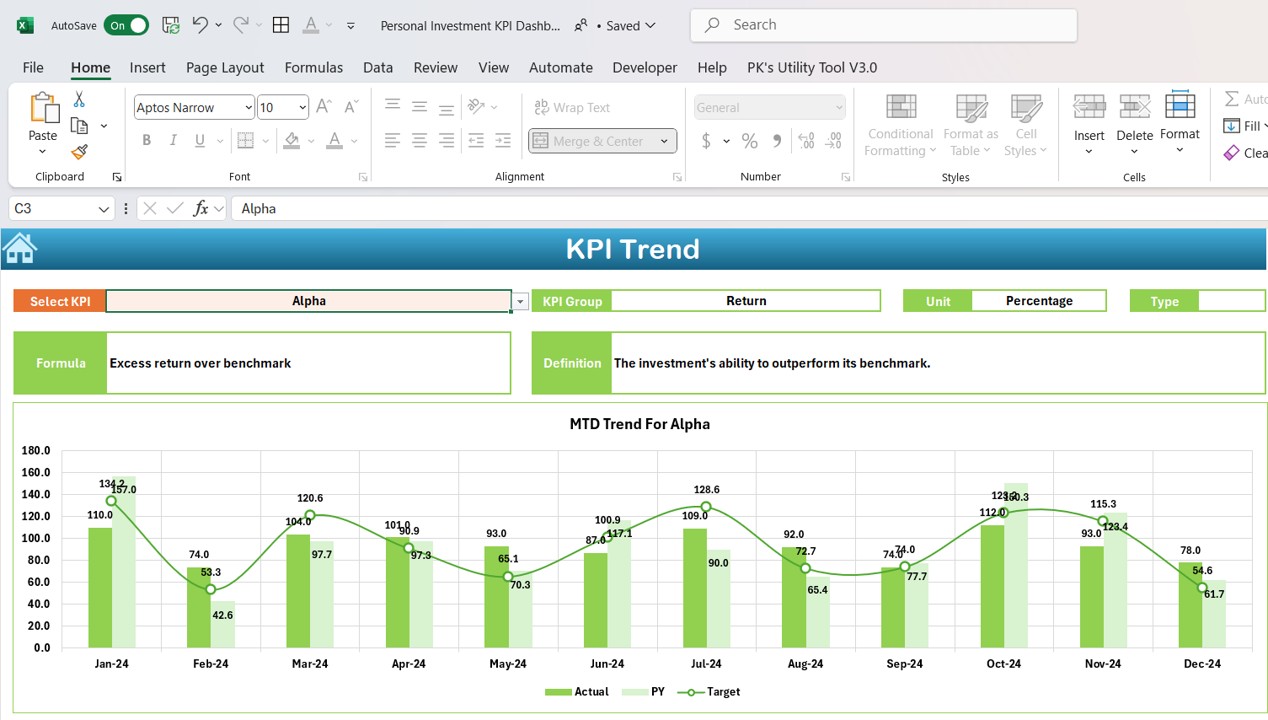
3. KPI Trend Sheet Tab
The KPI Trend Sheet allows you to track individual KPIs over time. In this sheet, you can select a KPI name from a drop-down menu in cell C3, and the following information will be displayed:
- KPI Group: Identifying the type of KPI (e.g., Return, Risk, Diversification).
- Unit: The measurement unit for the KPI (e.g., Percentage, Ratio).
- KPI Type: Whether the KPI is “Lower the Better” or “Upper the Better.”
- Formula: The formula used to calculate the KPI.
- Definition: A brief definition of the KPI to help you understand its significance.
Click to buy Personal Investment KPI Dashboard in Excel
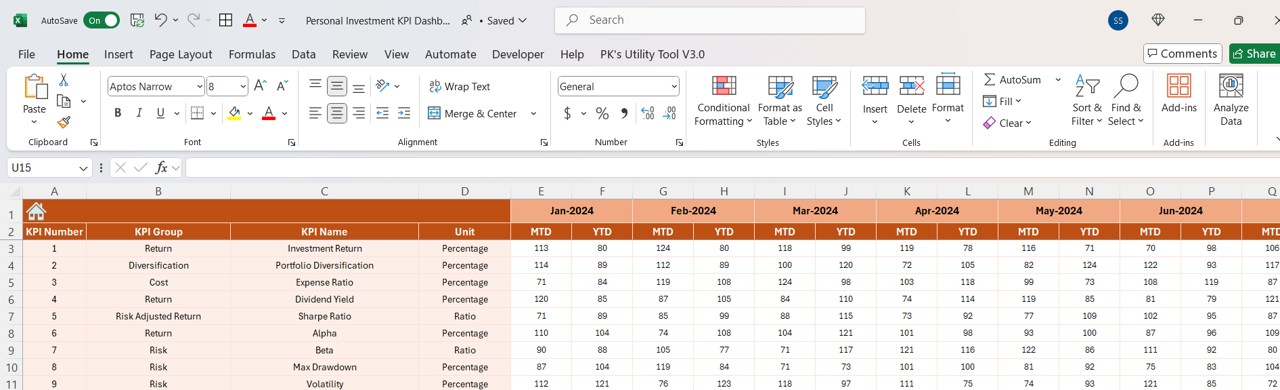
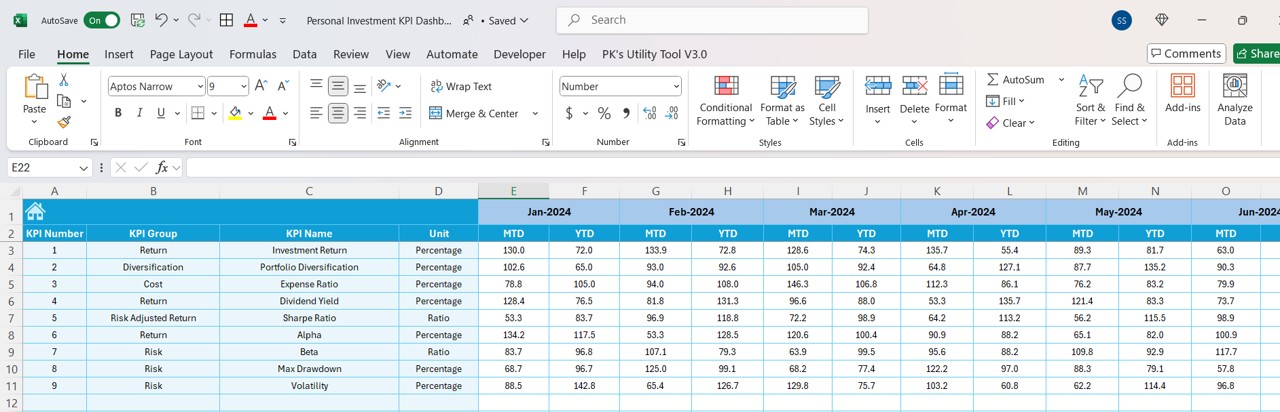
4. Actual Number Sheet Tab
In the Actual Number Sheet, you’ll enter the actual data for both YTD and MTD metrics. This tab allows you to manually update the data for the current month and year. You can change the month by adjusting the value in E1, and the dashboard will update accordingly.
Click to buy Personal Investment KPI Dashboard in Excel
5. Target Sheet Tab
This sheet is where you’ll input the target numbers for each KPI for the current month, as well as for the year-to-date. By inputting these target values, you can compare your actual performance against the targets you set.
Click to buy Personal Investment KPI Dashboard in Excel
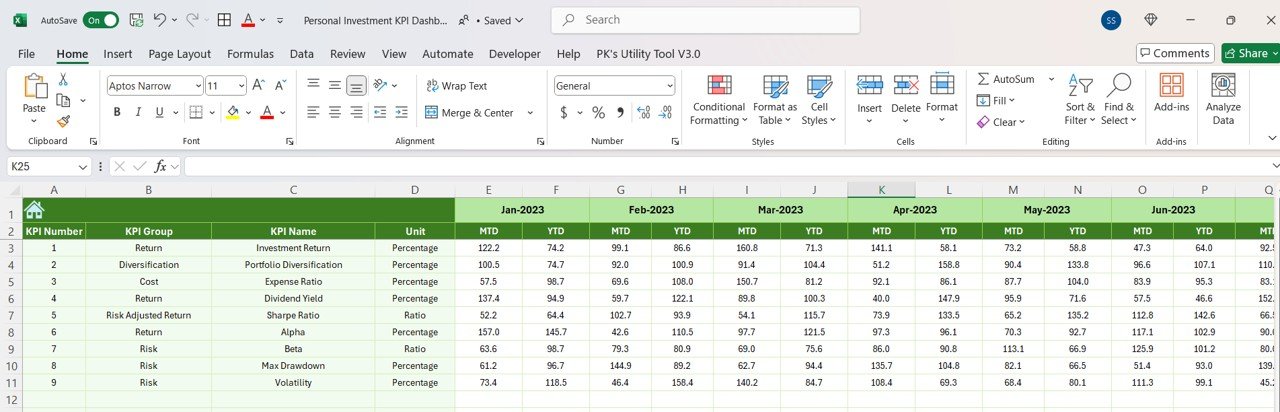
6. Previous Year Number Sheet Tab
This tab allows you to input the previous year’s data for the KPIs. By comparing current performance with the previous year’s data, you can identify growth trends and areas that need improvement.
Click to buy Personal Investment KPI Dashboard in Excel
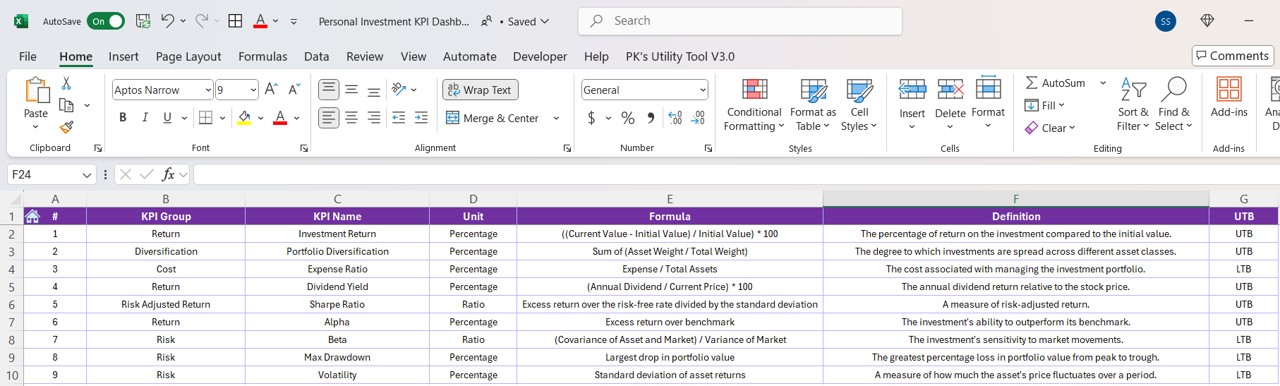
7. KPI Definition Sheet Tab
The KPI Definition Sheet provides detailed information about each KPI, including the KPI name, group, unit of measurement, formula, and a brief definition. This sheet helps you gain a deeper understanding of each KPI and how it contributes to the overall performance of your investments.
Click to buy Personal Investment KPI Dashboard in Excel
Advantages of Using a Personal Investment KPI Dashboard
The use of a Personal Investment KPI Dashboard offers several advantages for investors:
- Real-Time Insights: You can monitor the performance of your investments in real time, allowing you to make timely decisions.
- Comprehensive Overview: The dashboard aggregates all relevant investment data into one central location, making it easy to view and analyze.
- Risk Management: By tracking KPIs such as volatility and beta, you can identify and manage risks in your investment portfolio.
- Customizable: The dashboard is fully customizable, allowing you to adjust it to fit your unique investment strategy and goals.
Opportunities for Improvement in Personal Investment KPI Dashboard
While a Personal Investment KPI Dashboard is an invaluable tool, there are always opportunities for improvement:
- Integration with Other Tools: Integrating the dashboard with other financial software or apps can help you track your investments even more effectively.
- Data Sources: Ensuring that you’re pulling data from reliable and up-to-date sources is crucial for accurate reporting.
- Automating Data Entry: Automating the entry of actual numbers and targets can save time and reduce human error.
Best Practices for Using a Personal Investment KPI Dashboard
To get the most out of your Personal Investment KPI Dashboard, follow these best practices:
- Update Regularly: Ensure that you update the actual numbers and target data regularly to keep the dashboard accurate.
- Use Conditional Formatting: Conditional formatting (e.g., up/down arrows) helps quickly identify trends and make comparisons easier.
- Focus on Key Metrics: While the dashboard may track many KPIs, focus on the metrics that matter most to your investment strategy.
- Review Periodically: Regularly review your dashboard to assess your investment performance and make any necessary adjustments.
Conclusion
A Personal Investment KPI Dashboard is an essential tool for investors who want to track their investments, assess performance, and make informed decisions. By monitoring KPIs such as investment return, portfolio diversification, and risk metrics, you can optimize your investment strategy and work towards achieving your financial goals.
Frequently Asked Questions (FAQs)
1. What is a Personal Investment KPI Dashboard? A Personal Investment KPI Dashboard is a tool that helps investors track the performance of their investments by displaying key performance indicators (KPIs) in a centralized and visually appealing format.
2. What KPIs should I track in my Personal Investment KPI Dashboard? The key KPIs to track include investment return, portfolio diversification, expense ratio, dividend yield, sharpe ratio, alpha, beta, max drawdown, and volatility.
3. How do I use the Personal Investment KPI Dashboard? The dashboard allows you to input data such as actual numbers, targets, and previous year data, which can then be compared to assess your investment performance.
4. Can I customize my Personal Investment KPI Dashboard? Yes, the dashboard is highly customizable. You can add or remove KPIs, adjust target values, and tailor the dashboard to fit your specific investment strategy.
5. How often should I update the data in my Personal Investment KPI Dashboard? You should update the data regularly, especially the actual numbers and targets, to ensure that your dashboard reflects the most accurate and up-to-date information.
Visit our YouTube channel to learn step-by-step video tutorials
Youtube.com/@NeotechNavigators
Click to buy Personal Investment KPI Dashboard in Excel