Part of the free Module 10: Pivot Tables · Lesson 3 of 20 · Full Excel course
Updated on 5 September 2026 · Works in Excel 365, 2021, 2019 and 2016 unless noted.
A pivot table filter shows only the products, people or periods you care about without touching the source data. Excel offers four kinds: the Report Filter area above the table, Label Filters on names and dates, Value Filters on calculated totals, and the Top 10 filter for the best or worst N items. This lesson shows how to use each one and how to combine them.
The four filter types in a pivot table compared
| Filter type | Where you find it | What it tests | Example |
|---|---|---|---|
| Report Filter | Filters area of the Fields pane; drop-down above the report | Any field, whole report | Show only Product – 3 |
| Label Filter | Row or Column Labels drop-down > Label Filters (Date Filters for dates) | The item name or date | Employees whose name begins with A; dates in this quarter |
| Value Filter | Row or Column Labels drop-down > Value Filters | A summarised number | Supervisors with Sum of Revenue greater than 50,000 |
| Top 10 | Value Filters > Top 10 | Rank, percent or cumulative sum of a value field | Top 5 employees by revenue |
| Manual tick boxes | The item list in any label drop-down | Individual items | Untick two products |
Report filters remove data from every calculation. Label and value filters hide items from the display, and by default the Grand Total still reflects only the visible items; the exception is a Data Model pivot table, where Include filtered items in totals can be switched on in PivotTable Options.
How to use the Report Filter area
- Drag the field you want to filter by, here Product, into the Filters area of the PivotTable Fields pane. A row appears above the report showing Product (All).
- Click the drop-down arrow in cell B1 and select Product – 3. To pick several products at once, tick Select Multiple Items first and then tick each product you need.
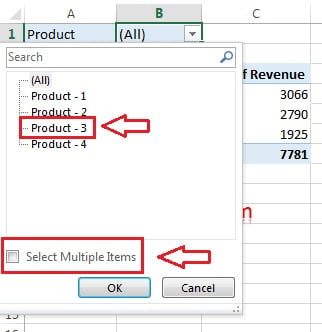
- Click OK. The supervisor totals now include only Product – 3 transactions and the filter cell shows the selected item, or (Multiple Items) when more than one is chosen.
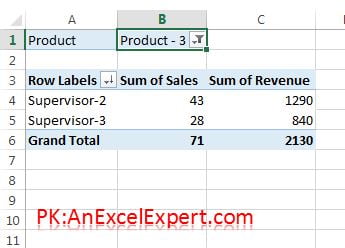
Two report filter extras are worth knowing. PivotTable Analyze > PivotTable > Options > Show Report Filter Pages creates one copy of the report per filter item, each on its own sheet, which is the fastest way to produce a page per supervisor. And when you have several fields in the Filters area, PivotTable Options > Layout & Format > Display fields in report filter area lets you arrange them down or across.
How to apply a Top 10 filter by value
Suppose the pivot table lists every employee with Sum of Sales and Sum of Revenue and you need the five employees who earned the most revenue.
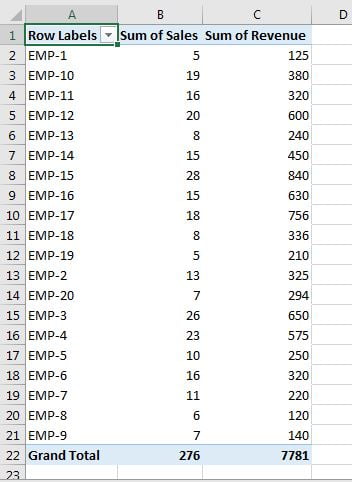
- Click the drop-down arrow on the Row Labels header, point to Value Filters and click Top 10.
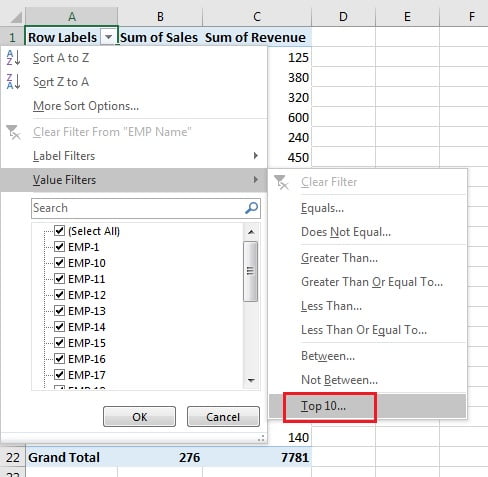
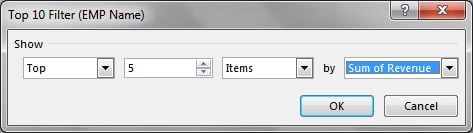
- In the Top 10 Filter dialog choose Top, type 5, keep Items and select Sum of Revenue in the last box. The second box can also be set to Percent (the top 20% of employees) or Sum (the fewest employees whose revenue adds up to a target such as 500,000).
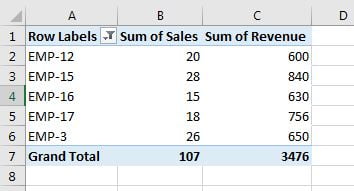
- Click OK. Only the five highest-revenue employees remain, and a funnel icon on the Row Labels header shows that a filter is active.
Choose Bottom in the first box to find the weakest performers. Ties are kept, so a Top 5 can show six rows when two employees share fifth place.
Label filters, date filters and the search box
Open the Row Labels drop-down and choose Label Filters to filter items by text conditions: Equals, Begins With, Contains, Between and their opposites. Wildcards work: *Ltd keeps every item ending in Ltd and ? stands for one character. When the field holds dates, the menu is called Date Filters and adds Before, After, This Month, Last Quarter, Year to Date and similar presets.
The Search box in the same drop-down is the quickest way to find one item in a long list. Type part of the name, and Excel ticks only the matches. Tick Add current selection to filter before clicking OK to keep earlier selections and build up a set in several passes.
Value Filters use the same drop-down and test a summarised number: Greater Than, Less Than, Between, Equals, plus Top 10. A value filter always asks which value field to test, so with Sum of Sales and Sum of Revenue both present you pick one.
Worked example: supervisors above a revenue threshold, then the best product
Take this summary of the practice data with Supervisor Name in Rows and Product in Columns:
| Supervisor | Laptop | Printer | Mouse | Grand Total |
|---|---|---|---|---|
| Priya | 45,000 | 16,000 | 3,000 | 64,000 |
| Rahul | 90,000 | 24,000 | 5,000 | 119,000 |
| Meena | 30,000 | 8,000 | 2,000 | 40,000 |
| Grand Total | 165,000 | 48,000 | 10,000 | 223,000 |
- Open the Row Labels drop-down, choose Value Filters > Greater Than, pick Sum of Revenue and type 50000. Meena disappears and the Grand Total becomes 183,000.
- Open the Column Labels drop-down, choose Value Filters > Top 10, set Top 1 Items by Sum of Revenue. Only the Laptop column stays: Priya 45,000, Rahul 90,000.
- Press PivotTable Analyze > Actions > Clear > Clear Filters to return to the full report.
The value filter on rows is evaluated on the Grand Total column, not on the visible columns, because it tests the row’s total for the selected value field.
Filters versus slicers
Slicers and timelines (covered in later chapters) are buttons that sit on the sheet and can drive several pivot tables at once. Use a report filter when you need a compact drop-down, when the report will be printed, or when you want Show Report Filter Pages. Use a slicer when a reader must see at a glance what is selected, or when one click should filter a dashboard of many pivot tables and charts.
Tips and common mistakes
- One label and one value filter per field. To combine, say, Begins With and Greater Than on the same field, open PivotTable Options > Totals & Filters and tick Allow multiple filters per field.
- Clear filters before sharing. Right-click the field and choose Clear Filter From, or use PivotTable Analyze > Clear > Clear Filters to reset everything.
- Top 10 respects other filters. If a report filter is active, the Top 10 is calculated on the filtered data only, which is usually what you want.
- Grand Total and filtered rows. In a normal pivot table the Grand Total sums the visible items only. Add a second Values field with Show Values As set to % of Grand Total if you need each visible row as a share of the full total.
- Filtered items still appear in the drop-down. Old items that no longer exist in the source stay in the list until you set Number of items to retain per field to None in PivotTable Options > Data and refresh.
- Filtering a date field by year. Group the dates first, or use Date Filters, rather than ticking hundreds of individual days.
- The funnel icon tells you where a filter is active. Hover over the icon to read the filter description.
Errors and how to fix them
| Problem | Cause | Fix |
|---|---|---|
| Value Filters are greyed out | No value field in the Values area | Add a numeric field to Values first |
| Top 10 shows more than N rows | Ties at the boundary | Expected; sort descending to see the tie, or add a second value field to break it |
| Applying a second filter removes the first | Allow multiple filters per field is off | Tick it in PivotTable Options > Totals & Filters |
| Report filter shows (Multiple Items) and you cannot see which | Several items ticked | Open the drop-down to review, or replace the report filter with a slicer |
| Date Filters missing, only Label Filters shown | Dates stored as text in the source | Convert the column to real dates and refresh |
| Filter does not update after new data | Pivot table not refreshed | Press Alt + F5; a Top 10 filter is recalculated on refresh |
Practice exercise
Open the practice file Pivot-Table.xlsx and build an employee-wise pivot table with Sum of Sales and Sum of Revenue.
- Add Product to Filters and find the top three sellers of each product by switching the report filter.
- Apply a Value Filter of Sum of Sales less than 100 to list low-volume employees, then clear it.
- Use Top 10 with Percent to show the employees who make up the top 20% by revenue.
- Turn on Allow multiple filters per field and combine a Label Filter (name begins with a letter of your choice) with a Value Filter on revenue.
- Use Show Report Filter Pages to create one sheet per product, then delete the extra sheets.
Key takeaways
- Report filters sit above the table and affect every number; label and value filters hide items in the row or column area.
- Top 10 can work by Items, Percent or Sum, Top or Bottom, on any value field, and keeps ties.
- Label Filters test names and dates; Value Filters test summarised totals.
- Tick Allow multiple filters per field to stack a label filter and a value filter on one field.
- Clear everything with PivotTable Analyze > Clear > Clear Filters before sharing a report.
Related lessons
- Pivot Table course hub
- Sort data in a pivot table
- Slicers: visual filters for pivot tables
- Timeline filter for dates
- PivotTable Options, settings and troubleshooting
- Sort and Filter module for filtering normal ranges
- COUNTIFS function
- Microsoft Support: Use slicers to filter data
Frequently asked questions
How do I filter a pivot table by multiple items?
Click the report filter drop-down, tick Select Multiple Items and then tick each item you want. For row or column fields simply untick the items you do not need in the label drop-down, or type in the Search box and tick Add current selection to filter to build the set in several passes.
Why does the Top 10 filter show more than ten rows?
Ties are included, so if several items share the tenth value they all stay in the report. Subtotal rows for an outer field can also add lines. Sort the field descending to see where the tie falls, or add a second value field so that fewer items share the same number.
Can I filter a pivot table with a cell value?
Not directly with the built-in filters. Use a slicer or timeline for interactive filtering, or record a short VBA macro that sets the PivotField CurrentPage property to the value of a cell and runs on Worksheet_Change. GETPIVOTDATA can also pull one filtered figure into a formula.
What is the difference between a label filter and a value filter?
A label filter tests the item itself, such as the product name or the date, so it needs no numbers. A value filter tests the total that the pivot table has calculated for that item, such as Sum of Revenue greater than 50,000, and always asks which value field to use.
How do I apply two filters to the same field in a pivot table?
Open PivotTable Options from the right-click menu, go to Totals & Filters and tick Allow multiple filters per field. You can then keep one label filter and one value filter on the same field, for example names beginning with S and revenue above 20,000, plus manual tick boxes.
Want the finished version? Ready-made Excel dashboards, trackers and VBA systems are available at NextGenTemplates.com.