Every business needs a solid pricing strategy to remain competitive and profitable. However, keeping track of pricing performance can be quite challenging. That’s where a Pricing Strategy KPI Dashboard in Excel becomes a game-changer. This dashboard allows you to monitor key pricing performance indicators (KPIs) and ensure that your pricing strategies align with your business objectives.
In this article, we will take a detailed look at how to use an Excel-based Pricing Strategy KPI Dashboard effectively. We will also explore its key features, advantages, and best practices to help you make the most of it.
Click to Pricing Strategy KPI
What is a Pricing Strategy KPI Dashboard?
A Pricing Strategy KPI Dashboard is a tool designed to help businesses track, analyze, and improve their pricing strategies. By leveraging key pricing metrics, companies can make informed decisions, spot trends, and identify areas for improvement.
Key Features of the Pricing Strategy KPI Dashboard
This Excel-based Pricing Strategy KPI Dashboard consists of seven worksheets, each serving a specific purpose. Let’s go over them one by one:
Home Sheet
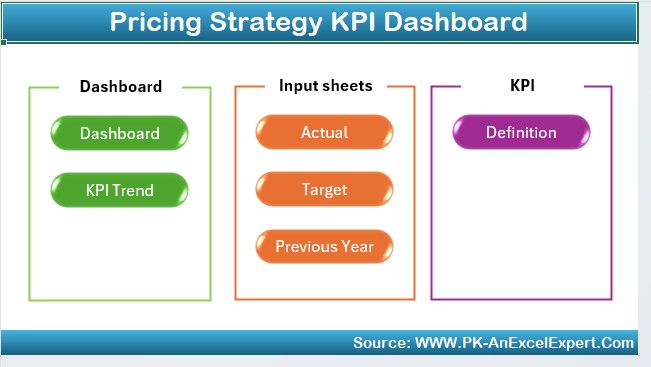
- Acts as an index sheet providing an overview of the dashboard.
- Contains six navigation buttons that allow you to jump to different sheets quickly.
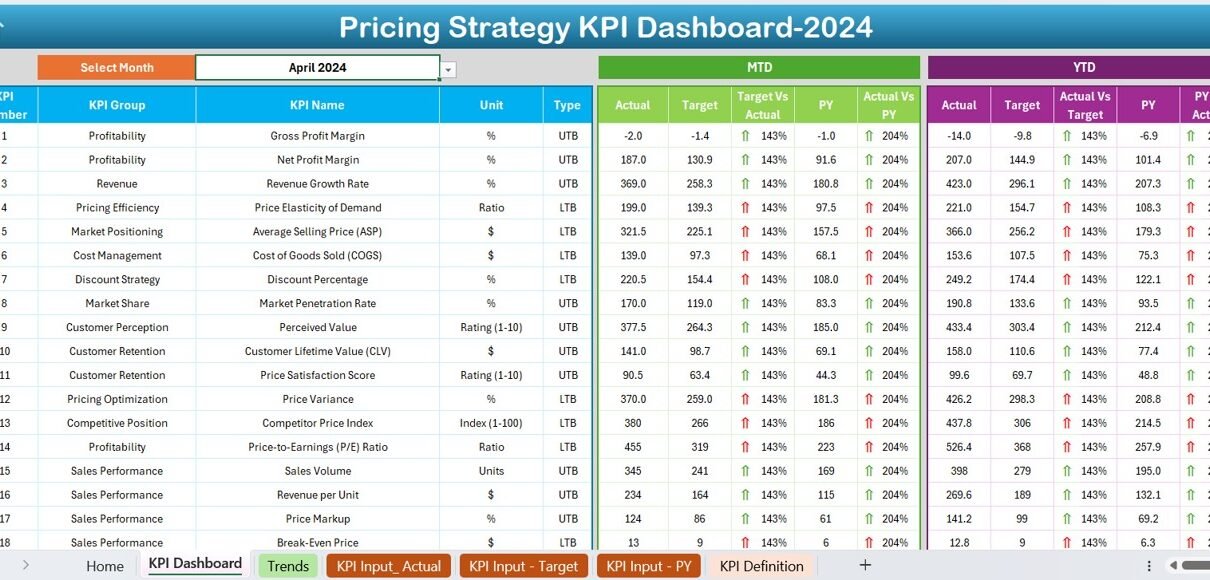
Dashboard Sheet
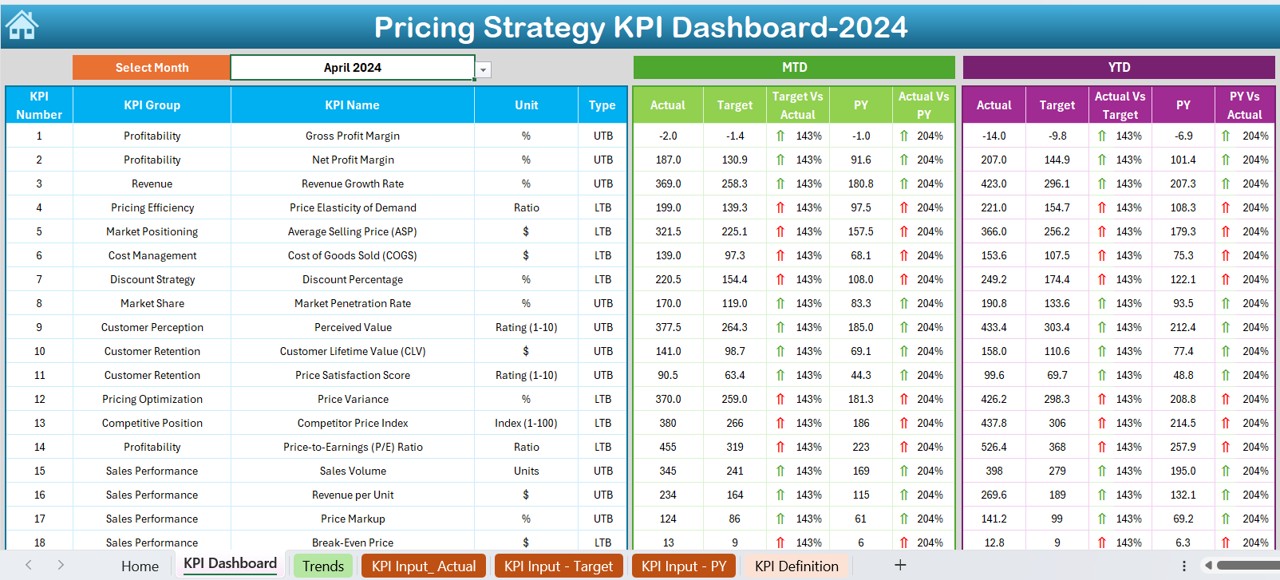
- The main dashboard displaying all KPI data in one place.
- Allows users to select a month from a dropdown menu (D3 cell) to view updated pricing data.
- Displays Month-to-Date (MTD) and Year-to-Date (YTD) Actual vs. Target values.
- Includes a comparison with Previous Year (PY) values.
- Uses conditional formatting arrows to indicate whether trends are moving up or down.
Click to Pricing Strategy KPI
Why is a Pricing Strategy KPI Dashboard Important?
Having an Excel-based Pricing Strategy KPI Dashboard provides a structured approach to monitoring pricing effectiveness. Here’s why it’s important:
Real-Time Pricing Performance Tracking
- Helps businesses keep an eye on pricing trends for different products and services.
- Enables instant MTD and YTD comparisons.
Better Decision-Making
- Empowers managers and business owners to make data-driven pricing decisions.
- Helps identify which pricing strategies are working and which need adjustments.
Competitive Advantage
- Allows businesses to refine pricing strategies based on market trends and competitor analysis.
- Ensures that pricing remains competitive and aligned with customer expectations.
Higher Revenue and Profitability
- Identifies opportunities to increase profit margins.
- Provides a clear picture of how price changes impact overall sales and revenue.
Click to Pricing Strategy KPI
Key KPIs in a Pricing Strategy Dashboard
To make informed pricing decisions, tracking the right KPIs is essential. Here are some crucial ones included in the Pricing Strategy KPI Dashboard:
Revenue Growth Rate: Measures how much revenue has increased over a given period.
- Gross Profit Margin: Shows how much profit remains after deducting the cost of goods sold (COGS).
- Price Elasticity of Demand: Helps determine how a price change affects product demand.
- Discount Impact Analysis: Tracks how discounting strategies influence revenue and profit.
- Competitor Pricing Comparison: Allows businesses to compare their pricing strategies with competitors.
- Customer Lifetime Value (CLV): Measures how much revenue a business can expect from a customer over time.
- Customer Acquisition Cost (CAC): Calculates how much it costs to acquire a new customer through pricing strategies.
Best Practices for Using a Pricing Strategy KPI Dashboard
To maximize the impact of your Pricing Strategy KPI Dashboard, follow these best practices:
Keep Your Data Updated
- Regularly update MTD, YTD, and previous year data to maintain accuracy.
- Automate data entry using Excel formulas or external data sources.
Use Conditional Formatting for Better Insights
- Apply color coding and trend arrows to highlight pricing trends.
- Make it easy to identify areas needing attention.
Compare with Market Trends
- Benchmark your pricing data against industry standards and competitor pricing regularly.
Focus on Customer Behavior
- Analyze price sensitivity and customer buying trends to refine your pricing strategies.
Set Clear Pricing Goals
- Define pricing goals and use the dashboard to track progress against them.
Conclusion
A Pricing Strategy KPI Dashboard in Excel is an invaluable tool for businesses looking to track and improve their pricing strategies. With this dashboard, companies can monitor key pricing metrics, analyze trends, and make better pricing decisions. By following best practices and leveraging Excel’s built-in features, businesses can ensure that their pricing strategies align with their goals and market conditions.
Frequently Asked Questions (FAQs)
What is the Purpose of a Pricing Strategy KPI Dashboard?
A Pricing Strategy KPI Dashboard helps businesses track and analyze pricing performance, ensuring that their pricing strategies align with overall business goals and market trends.
How Does Conditional Formatting Improve a Pricing Dashboard?
Conditional formatting highlights pricing trends with color coding and arrows, making it easier to spot areas that need improvement.
Can I Customize the Pricing Strategy KPI Dashboard?
Yes! You can modify KPIs, add new data points, and adjust formulas and conditional formatting to fit your business needs.
What Are the Most Important Pricing KPIs to Track?
Key pricing KPIs include Revenue Growth Rate, Gross Profit Margin, Price Elasticity of Demand, and Customer Lifetime Value (CLV).
How Often Should the Dashboard Be Updated?
For accurate analysis, update the dashboard weekly or monthly to ensure you are tracking up-to-date pricing performance.
Click to Pricing Strategy KPI
Visit our YouTube channel to learn step-by-step video tutorials
View this post on Instagram