In the digital age, customer feedback plays a critical role in determining a product’s success. Businesses rely on Product Reviews and Ratings KPI Dashboards to analyze and improve their offerings based on user feedback. A well-structured KPI dashboard provides insights into customer satisfaction, product performance, and areas that require attention.
In this article, we introduce a Product Reviews and Ratings KPI Dashboard in Excel, a ready-to-use template that helps businesses track key performance indicators (KPIs) efficiently.
Click to Purchase Product Reviews and Ratings KPI Dashboard in Excel
Key Features of the Product Reviews and Ratings KPI Dashboard
This KPI Dashboard consists of seven worksheets, each serving a specific purpose. Let’s explore these sections in detail.
Home Sheet
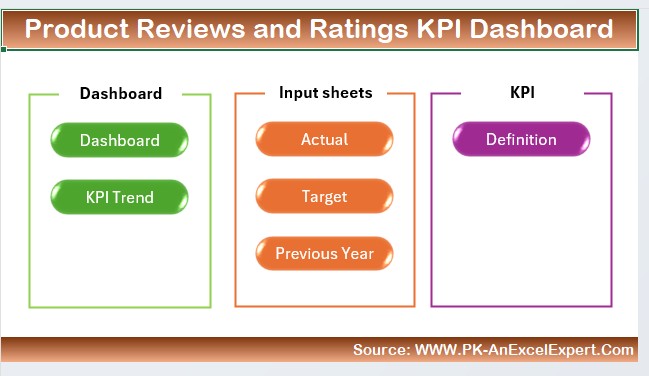
This serves as the index sheet of the dashboard. It contains six buttons that allow users to navigate easily between different sheets. This enhances user experience and ensures seamless data management.
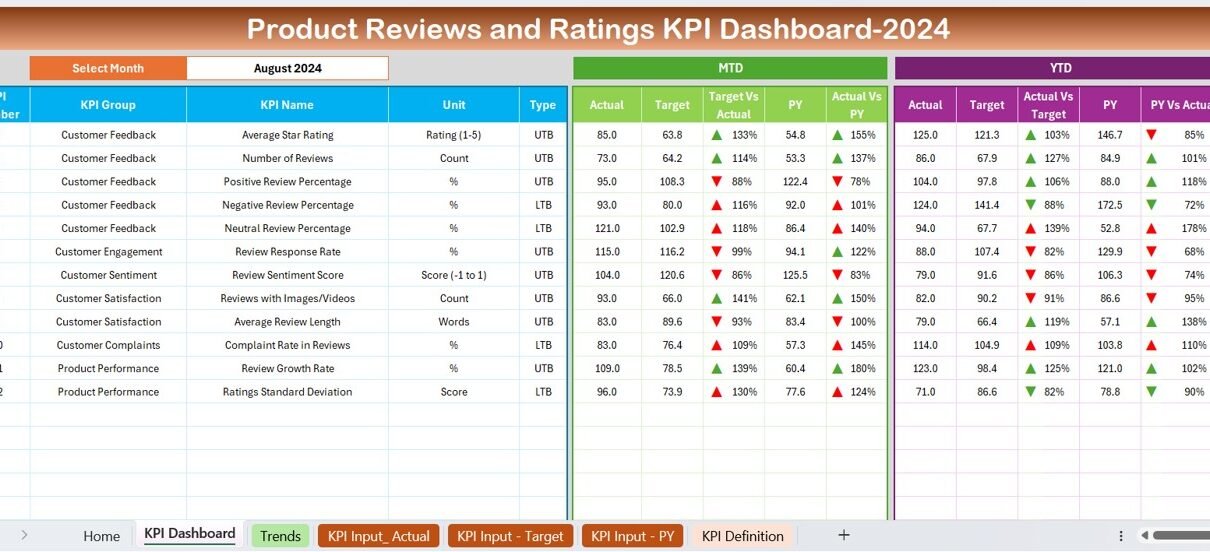
Dashboard Sheet Tab
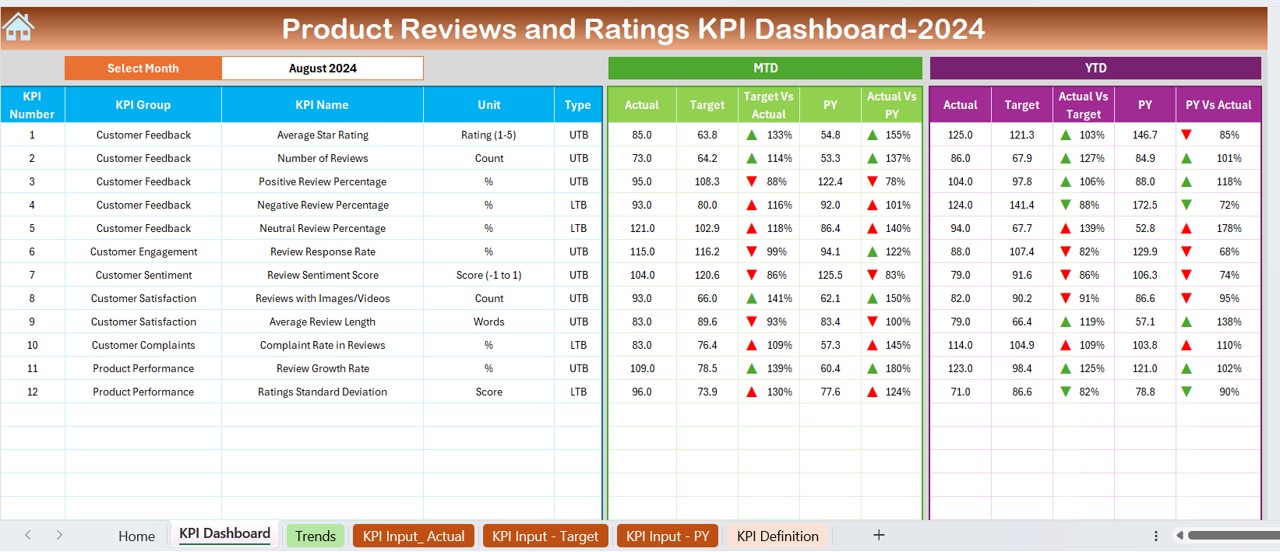
- The main dashboard provides a comprehensive view of all KPIs. It includes:
- A drop-down menu in D3, where users can select a month.
- Automated updates for MTD (Month-to-Date) and YTD (Year-to-Date) Actual, Target, and Previous Year data.
- Conditional formatting with up/down arrows to indicate positive or negative trends.
- Target vs. Actual and PY vs. Actual comparison, making it easy to evaluate performance.
KPI Trend Sheet Tab
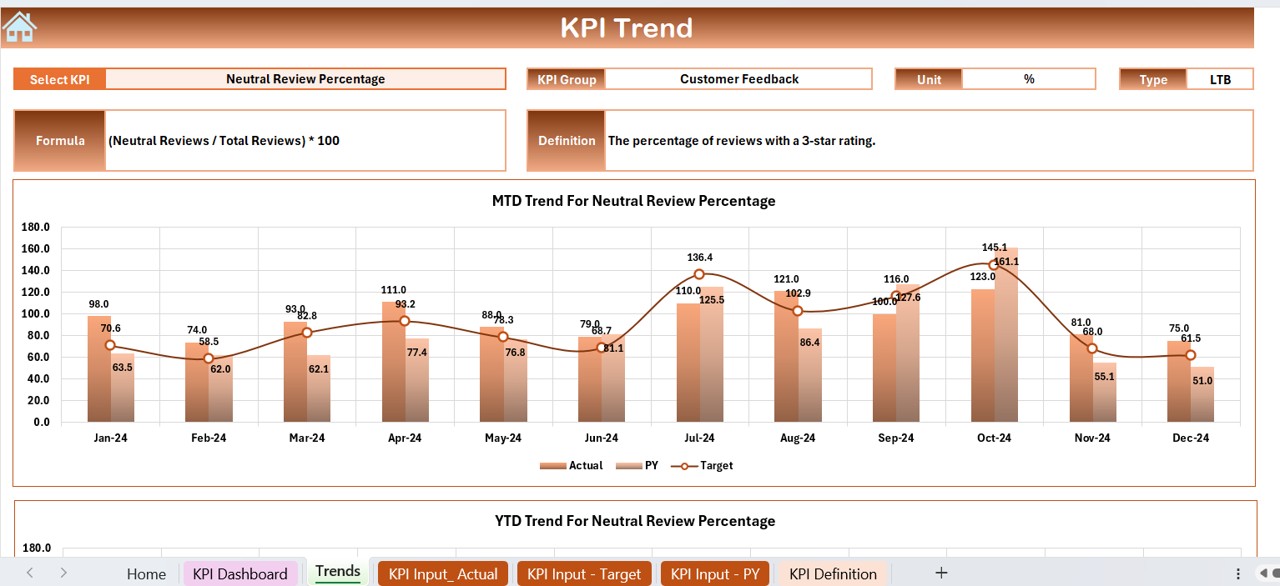
- This tab provides an in-depth view of KPI trends over time. Users can:
- Select a KPI from the drop-down menu in C3.
- View key information like KPI Group, Unit, Type (Lower the Better or Upper the Better), KPI Formula, and Definition.
- Analyze MTD and YTD trends through charts that compare Actual, Target, and Previous Year data.
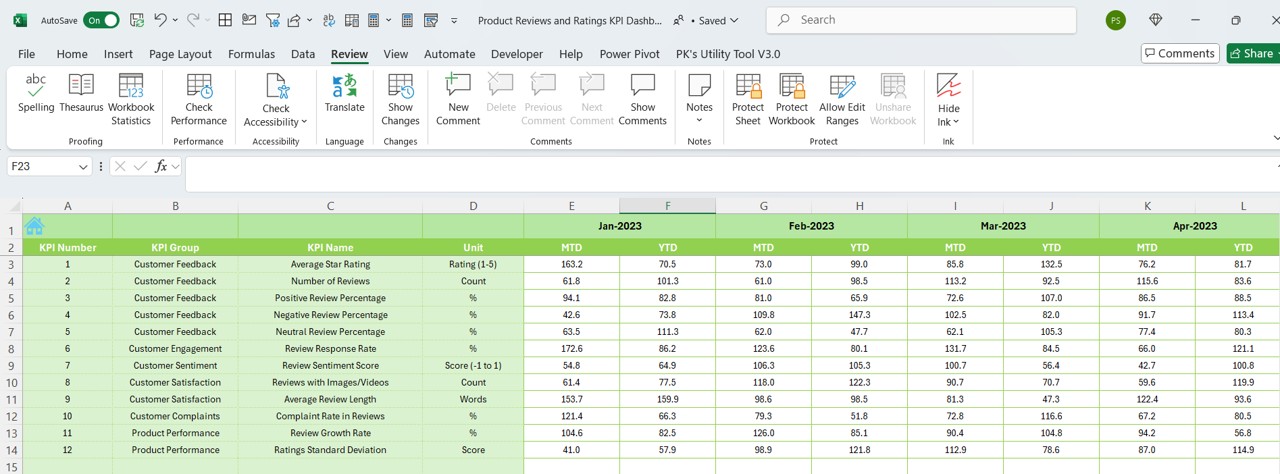
- Actual Numbers Input Sheet
- Data entry is simplified in this sheet. Users need to:
- Input actual numbers for YTD and MTD.
- Select the month by entering the first month of the year in E1.
- Ensure accurate data recording for meaningful insights.
Target Sheet Tab

- This section allows users to set Target values for each KPI. It includes:
- Monthly MTD and YTD target entries.
- Seamless alignment with Actual numbers for accurate performance tracking.
Previous Year Number Sheet Tab
- To facilitate year-over-year comparisons, users enter:
- Previous year’s data in the same structure as the current year.
- A clear benchmark to assess performance improvements.
KPI Definition Sheet Tab
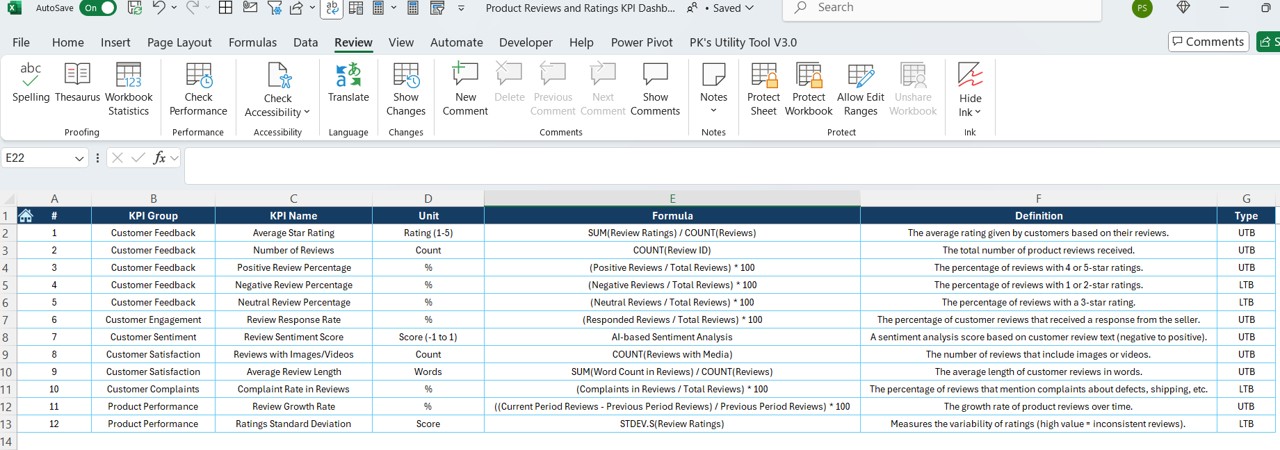
- This section helps in defining each KPI clearly. Users enter:
- KPI Name, Group, Unit, Formula, and Definition.
- Standardized KPI definitions for consistency.
Advantages of Using a Product Reviews and Ratings KPI Dashboard
- Centralized Data Management: Instead of managing multiple spreadsheets, this dashboard centralizes all KPI data in one place, ensuring efficiency.
- Real-Time Performance Tracking: With automated calculations and conditional formatting, users can monitor performance in real-time.
- Year-over-Year Comparison: By comparing previous year’s numbers with current performance, businesses can identify improvement areas.
- Trend Analysis with Charts: Visual representation of KPI trends helps in quick decision-making and performance forecasting.
- User-Friendly Interface: With drop-down menus, navigation buttons, and easy data entry, this dashboard is designed for users of all skill levels.
Best Practices for Managing Product Reviews and Ratings KPI Dashboard
- Ensure Data Accuracy: Always enter precise numbers to avoid misleading insights. Double-check inputs regularly.
- Update Data Regularly: Monthly updates ensure the dashboard reflects the most recent performance metrics.
- Leverage Conditional Formatting: Utilize the up/down arrows to identify performance trends at a glance.
- Compare with Industry Benchmarks: If possible, compare KPIs with industry standards to measure success accurately.
- Customize for Your Needs: Modify formulas and charts to align with your business objectives.
Click to Purchase Product Reviews and Ratings KPI Dashboard in Excel
Conclusion
A Product Reviews and Ratings KPI Dashboard in Excel is a powerful tool that helps businesses track customer feedback effectively. By using this dashboard, companies can identify strengths, weaknesses, and opportunities for growth. The ability to analyze historical trends, compare against targets, and visualize performance makes this an invaluable asset.
Frequently Asked Questions (FAQs)
What is a Product Reviews and Ratings KPI Dashboard?
A Product Reviews and Ratings KPI Dashboard is an Excel-based template that tracks key metrics related to customer reviews and ratings, helping businesses measure product success.
Who can use this KPI Dashboard?
This dashboard is useful for e-commerce businesses, product managers, marketing teams, and analysts who want to track customer feedback efficiently.
How do I enter data into the dashboard?
Data is entered in the Actual Numbers Input, Target, and Previous Year Number sheets. Simply input monthly values, and the dashboard updates automatically.
Can I customize this dashboard for my business?
Yes! You can modify formulas, add new KPIs, or change visualizations to match your business needs.
What are the key benefits of using this dashboard?
- Easy tracking of product performance.
- Comparison with previous years’ data.
- Trend analysis with visual charts.
- Centralized and automated KPI calculations.
Does this dashboard require advanced Excel skills?
No. This dashboard is user-friendly, and basic Excel knowledge is enough to use it effectively.
How often should I update this dashboard?
It is recommended to update monthly for accurate performance tracking.
Visit our YouTube channel to learn step-by-step video tutorials
View this post on Instagram


