In today’s fast-paced business world, monitoring profitability is crucial for decision-making and business growth. One effective way to track profitability is through a Profitability Analysis KPI Dashboard. This dashboard consolidates key performance indicators (KPIs) that help businesses understand their financial health and make data-driven decisions.
This article will explore everything you need to know about the Profitability Analysis KPI Dashboard, including its features, benefits, best practices, and opportunities for improvement. Let’s dive into this essential tool and how it can empower your business.
What is a Profitability Analysis KPI Dashboard?
A Profitability Analysis KPI Dashboard is a visual representation of key profitability metrics that provide insights into a company’s financial performance. By tracking these KPIs, businesses can gauge their financial efficiency, identify areas for improvement, and make informed strategic decisions.
The dashboard compiles various profitability metrics such as profit margins, return on assets, and more, to offer a holistic view of the company’s financial health. It helps executives, managers, and finance teams understand how well the business is doing in terms of generating profits.
Key Features of the Profitability Analysis KPI Dashboard
This Profitability Analysis KPI Dashboard template is a ready-to-use tool, designed to make tracking profitability easy and efficient. Below are the key features of this dashboard:
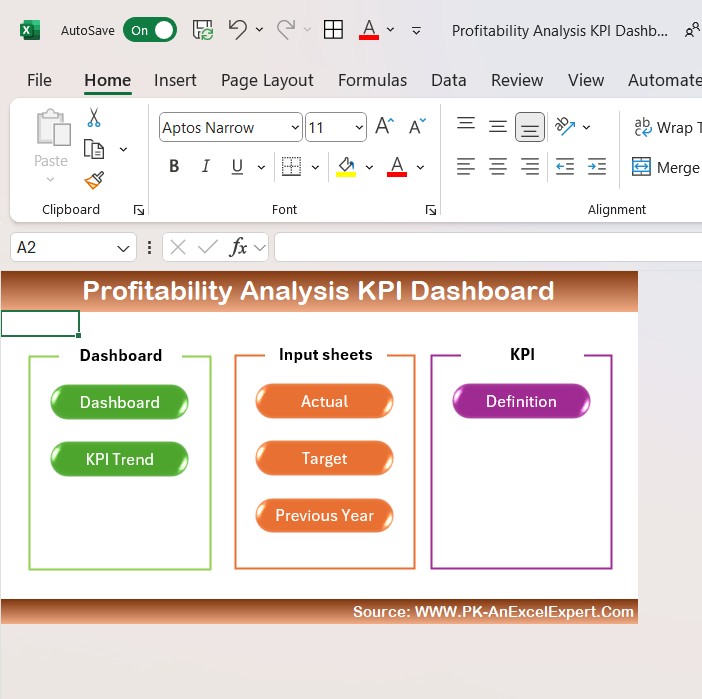
1. Home Sheet
The Home Sheet serves as an index, providing quick access to all the other sheets in the dashboard. It has six buttons, each directing you to the respective sheet, streamlining navigation and saving time.
Click to buy Profitability Analysis KPI Dashboard in Excel
2. Dashboard Sheet Tab
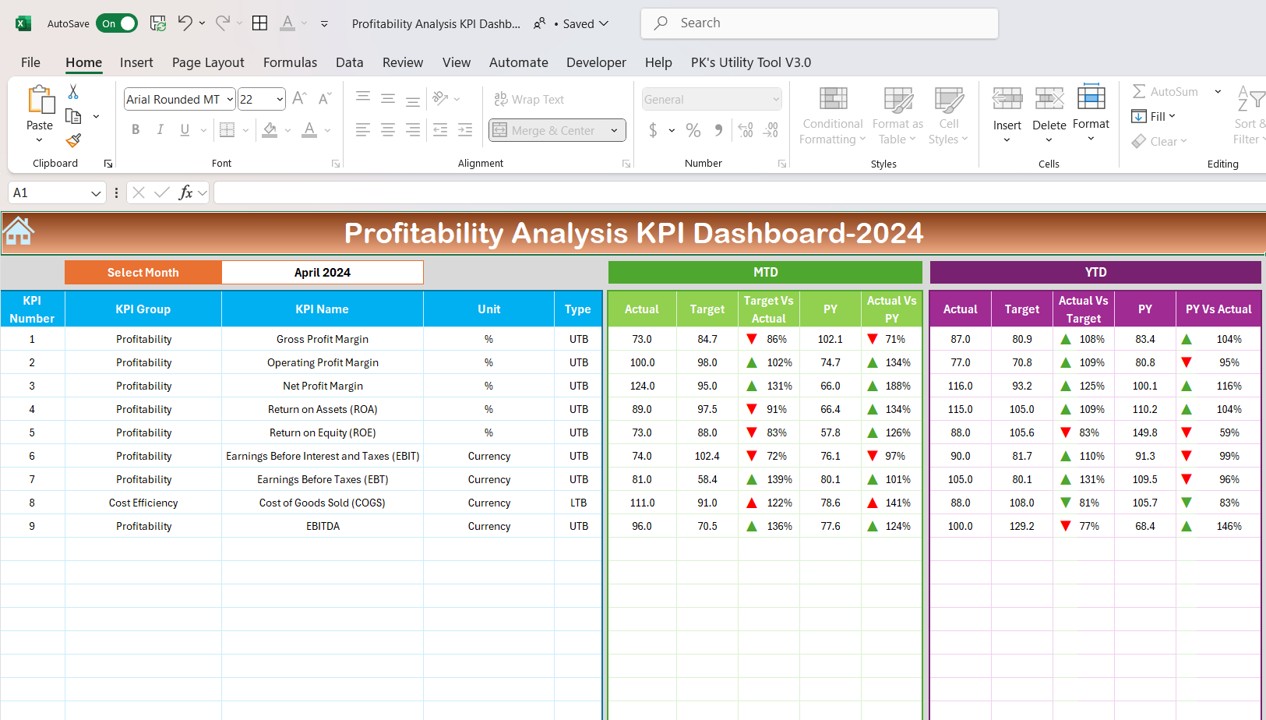
This is the main sheet of the dashboard, where you can view all the key information about your KPIs. It displays:
- MTD (Month-to-Date) Actuals: Shows the current month’s actual data.
- Target: Displays the target values for the current month.
- Previous Year Data: Allows comparison with the previous year’s data.
- Target vs. Actual: A comparison of targets with actuals using conditional formatting for easy visualization.
- YTD (Year-to-Date) Actuals: Shows year-to-date performance compared with targets and previous year data.
The dashboard updates automatically based on the month selected from the drop-down in cell D3, providing up-to-date information for that period.
Click to buy Profitability Analysis KPI Dashboard in Excel
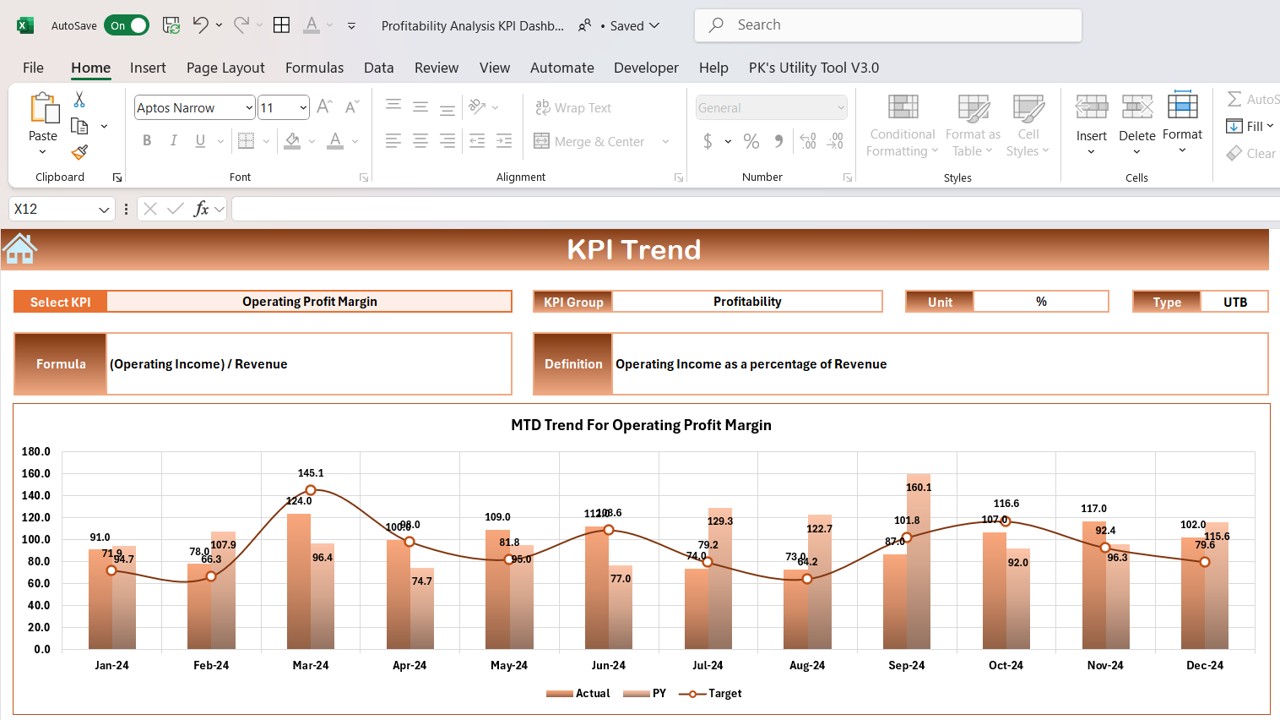
3. KPI Trend Sheet Tab
In this sheet, you can select a specific KPI from the dropdown menu in C3. This sheet shows the following details:
- KPI Group: Categorizes the KPI into different groups like Profitability, Efficiency, etc.
- Unit of KPI: Specifies the unit in which the KPI is measured (e.g., percentage, currency).
- Type of KPI: Whether the KPI is “Lower the Better” or “Upper the Better.”
- Formula and Definition: Provides the formula used to calculate the KPI and its definition.
Click to buy Profitability Analysis KPI Dashboard in Excel
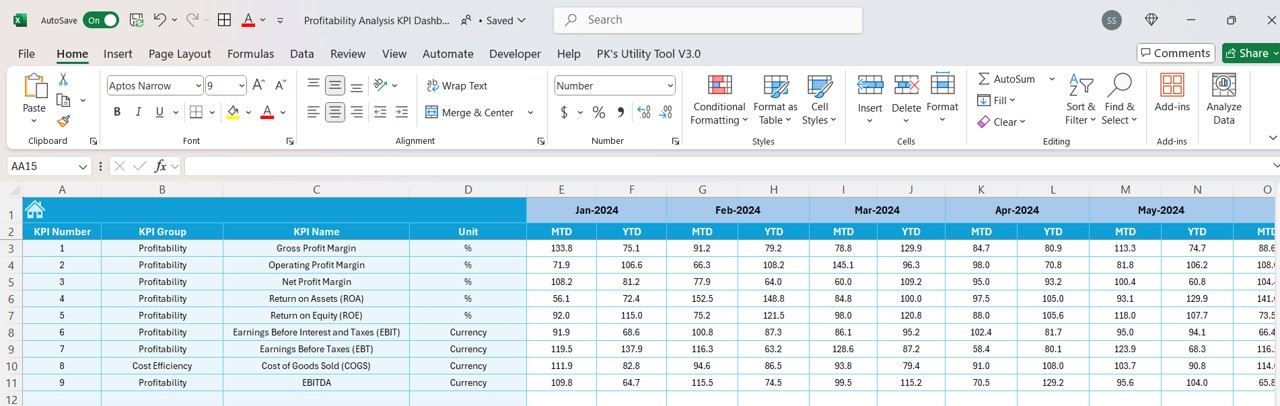
4. Actual Number Sheet Tab
This sheet is where you enter the actual numbers for MTD and YTD for a particular month. You can easily change the month by selecting it from the drop-down in cell E1, ensuring that your data is always up to date.
Click to buy Profitability Analysis KPI Dashboard in Excel
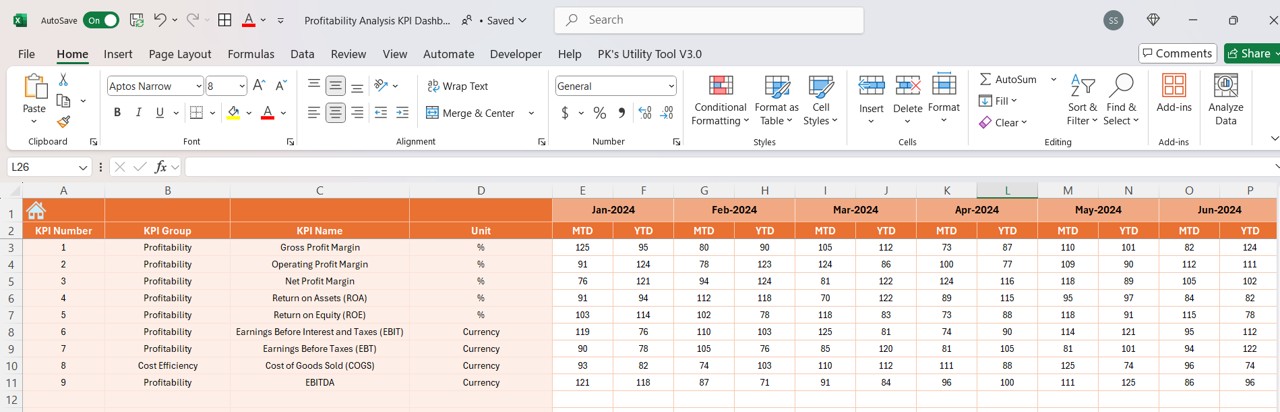
5. Target Sheet Tab
In the Target Sheet Tab, you input the target numbers for each KPI for the particular month, both for MTD and YTD. This helps you compare your performance against the set goals.
Click to buy Profitability Analysis KPI Dashboard in Excel
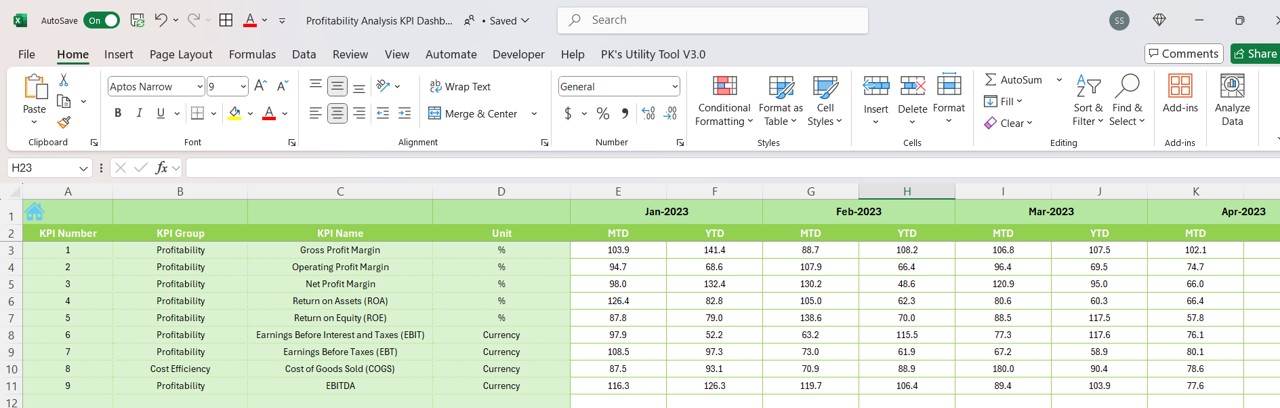
6. Previous Year Number Sheet Tab
This sheet allows you to enter the previous year’s numbers for comparison. By inputting the same data for the current and previous year, you can see the year-over-year growth or decline in your KPIs.
Click to buy Profitability Analysis KPI Dashboard in Excel
Click to buy Profitability Analysis KPI Dashboard in Excel
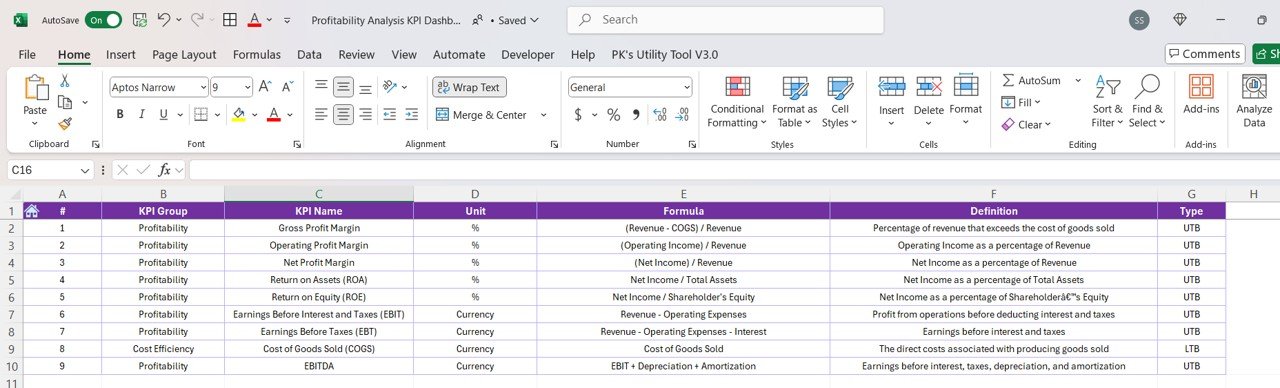
7. KPI Definition Sheet Tab
This sheet is where you define each KPI, including:
- KPI Name: The name of the KPI.
- KPI Group: The category of the KPI (e.g., profitability, efficiency).
- Unit: The unit of measurement for the KPI.
- Formula: The calculation used to determine the KPI value.
- Definition: A description of what the KPI measures.
Click to buy Profitability Analysis KPI Dashboard in Excel
Advantages of Using a Profitability Analysis KPI Dashboard
A Profitability Analysis KPI Dashboard offers numerous benefits for businesses. Let’s explore some of the key advantages:
- Real-Time Data Monitoring: With the ability to update the dashboard with real-time data, businesses can make quick decisions based on the most current information available.
- Improved Decision-Making: By tracking profitability KPIs, businesses can identify areas where improvements are needed and make data-driven decisions that will positively impact the bottom line.
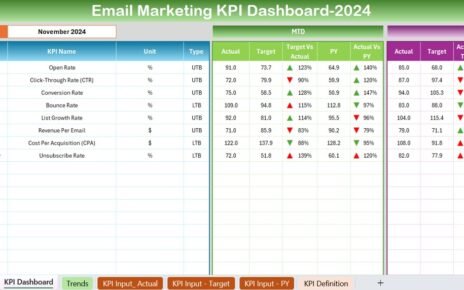
- Clear Visualization: The dashboard offers a visual representation of data, making it easier for managers and executives to understand financial performance. The use of conditional formatting, such as up and down arrows, allows for quick identification of trends.
- Easy Comparison: The ability to compare actual performance against targets and previous years helps businesses spot trends and opportunities for improvement.
- Time-Saving: The ready-to-use template saves time by automating the calculations and providing a centralized place for all profitability data, eliminating the need to manually compile reports.
Opportunity for Improvement in Profitability Analysis KPI Dashboard
While the Profitability Analysis KPI Dashboard offers significant benefits, there are always opportunities for improvement. Here are some areas where this dashboard can be enhanced:
- Customization of KPIs: Businesses may have unique KPIs that are specific to their industry or business model. Adding customizable fields for KPIs could make the dashboard even more versatile.
- Integration with Other Systems: Integrating the dashboard with accounting software or enterprise resource planning (ERP) systems could allow for seamless data flow, reducing manual entry and the risk of errors.
- Incorporating Forecasting Tools: Adding forecasting capabilities to the dashboard would allow businesses to project future profitability based on current data, helping with long-term planning and budgeting.
- User Access Control: For businesses with multiple users, incorporating user access controls could ensure that sensitive data is only accessible to authorized personnel.
Best Practices for the Profitability Analysis KPI Dashboard
To get the most out of your Profitability Analysis KPI Dashboard, it’s essential to follow these best practices:
- Regular Updates: Make sure to update the dashboard regularly with the latest data to keep your insights accurate and relevant.
- Set Realistic Targets: Setting achievable targets for each KPI is essential. Unrealistic targets can lead to poor performance and demotivation.
- Focus on Key KPIs: While it’s tempting to track a wide range of KPIs, it’s best to focus on the key profitability metrics that directly impact business performance.
- Use Conditional Formatting Wisely: Use conditional formatting to highlight areas that need attention, such as KPIs that fall below target. This makes it easier to spot issues quickly.
- Regular Review: Regularly review the dashboard and the KPIs to ensure they are still aligned with your business goals. Adjust targets as necessary.
Frequently Asked Questions (FAQs)
What KPIs should be included in a Profitability Analysis Dashboard?
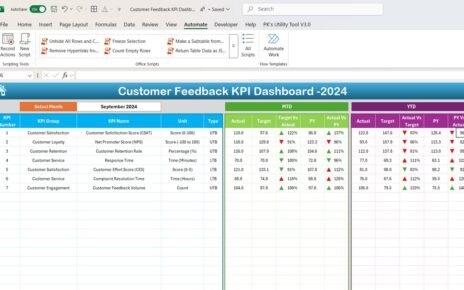
A Profitability Analysis Dashboard should include KPIs like Gross Profit Margin, Operating Profit Margin, Net Profit Margin, and Return on Assets (ROA). These KPIs provide a clear picture of the company’s profitability and financial health.
How do I update the Profitability Analysis KPI Dashboard?
To update the dashboard, simply enter the new data for the relevant months in the Actual Number Sheet Tab and Target Sheet Tab. The dashboard will automatically update with the latest figures.
Is the Profitability Analysis KPI Dashboard customizable?
Yes, the dashboard can be customized by adding new KPIs, adjusting the target fields, or integrating it with other systems for seamless data updates.
How does conditional formatting work in the dashboard?
Conditional formatting helps visually highlight performance trends, using up and down arrows to indicate whether the actual numbers are above or below the targets.
Conclusion
The Profitability Analysis KPI Dashboard is an essential tool for businesses that want to track and improve their profitability. With its user-friendly design and powerful features, this dashboard provides valuable insights into your financial performance, helping you make better decisions and drive business growth. By following best practices and continuously improving the dashboard, you can ensure that your business stays on top of its profitability goals
Visit our YouTube channel to learn step-by-step video tutorials
View this post on Instagram
Click to buy Profitability Analysis KPI Dashboard in Excel