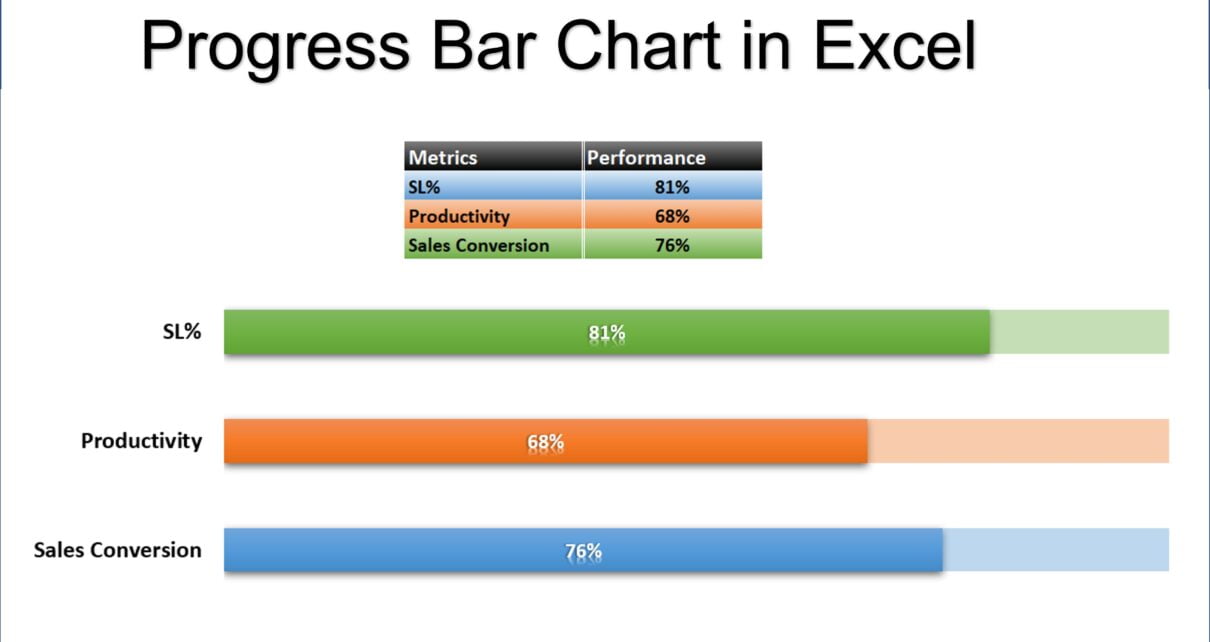
Progress Bar Chart in Excel
Progress Bar Chart in Excel is very useful chart to show the completion% or other % metrics. In this example, we have displayed the Service Level Value, Productivity and Sales Conversion. You can use it in your daily dashboard, or report.

Click to buy Progress Bar Chart in Excel
Visit our YouTube channel to learn step-by-step video tutorials
Watch the step-by-step video tutorial:
Click to buy Progress Bar Chart in Excel