In the fast-paced world of Project Management KPI Dashboard in Excel, tracking performance is essential to ensure that projects are on schedule, within budget, and meeting business objectives. The best way to monitor this performance is through Key Performance Indicators (KPIs). By using an Excel-based Project Management KPI Dashboard, project managers can easily visualize and track the progress of various KPIs in real-time, allowing for quicker decision-making and improved outcomes.
Click to buy Project Management KPI Dashboard in Excel
In this comprehensive guide, we’ll walk you through the setup and key features of a Project Management KPI Dashboard in Excel, along with best practices, opportunities for improvement, and frequently asked questions.
What is a Project Management KPI Dashboard?
A Project Management KPI Dashboard in Excel is a centralized, visual reporting tool used by project managers to track the performance of key metrics (KPIs) across one or multiple projects. KPIs measure a project’s success by comparing actual performance against set targets, helping teams stay on course. The dashboard makes it easy to monitor essential metrics, such as:
Click to buy Project Management KPI Dashboard in Excel
- Project Completion Rate
- On-time Delivery Rate
- Budget Variance
- Cost Performance Index (CPI)
- Schedule Performance Index (SPI)
- Resource Utilization Rate
- Customer Satisfaction Score (CSAT)
This Excel-based tool provides an efficient way to present these metrics in a clear and accessible format for all stakeholders.
Key Features of the Project Management KPI Dashboard
We have developed a ready-to-use Project Management KPI Dashboard template with 7 interactive worksheets designed to simplify the tracking of KPIs for your project:
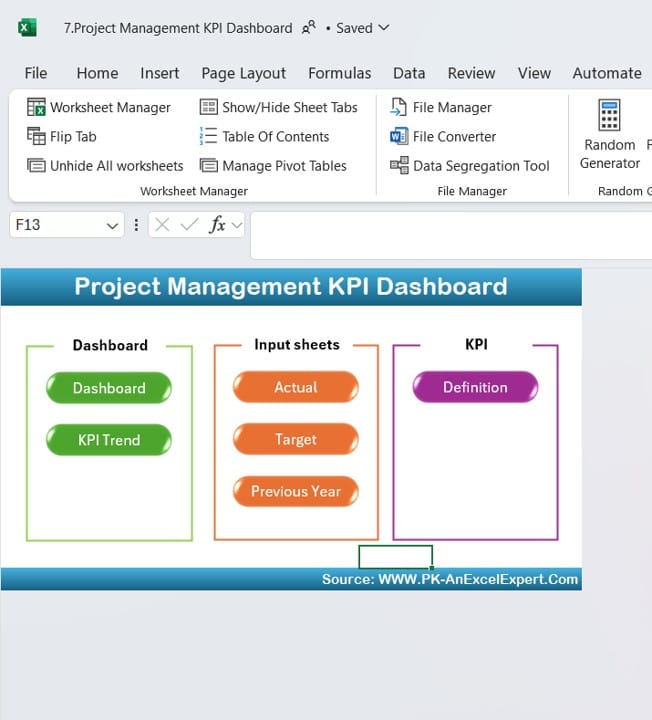
Home Sheet
Click to buy Project Management KPI Dashboard in Excel
The Home Sheet serves as the index of the dashboard, providing quick navigation to other sections. It contains six buttons that allow users to jump directly to specific worksheets, enhancing the user experience by minimizing time spent searching through sheets.
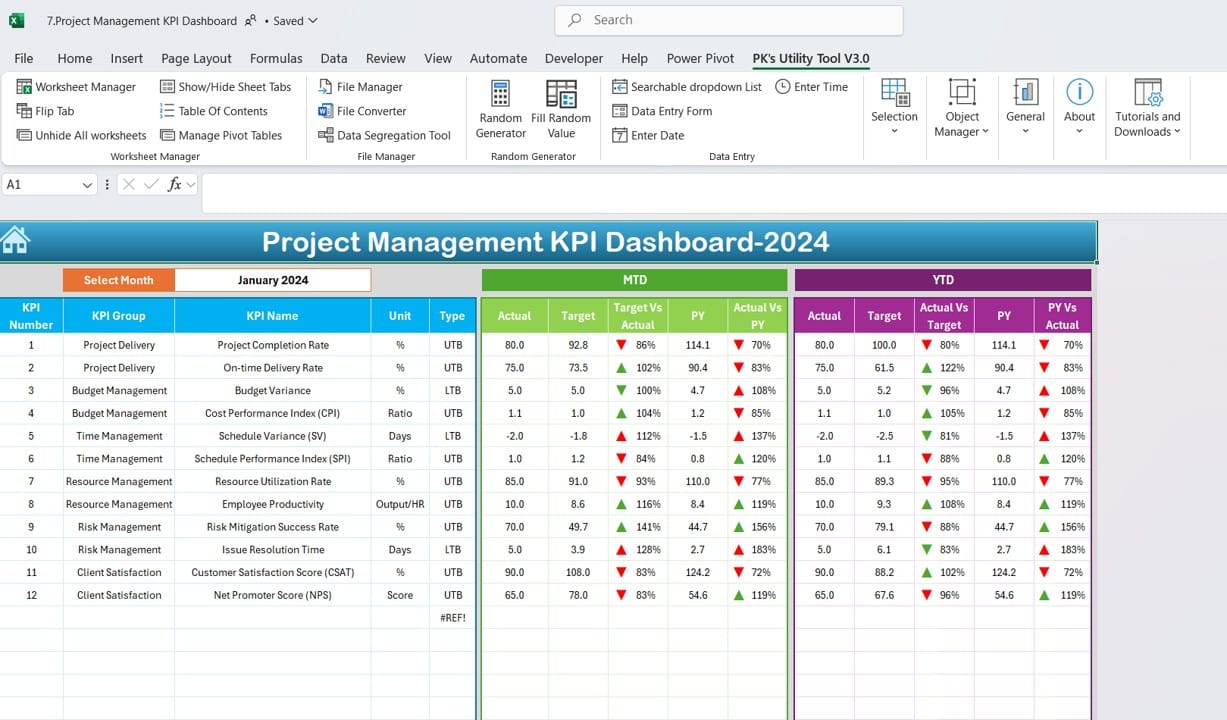
Dashboard Sheet Tab
Click to buy Project Management KPI Dashboard in Excel
This is the core of the dashboard where you can see all the KPIs summarized in one place. Users can select a specific month from a drop-down menu located in cell D3, and the dashboard updates instantly to show the numbers for that month. It displays the following key data points for each KPI:
- MTD Actual vs. MTD Target
- Previous Year (PY) Actual vs. MTD Actual
- YTD Actual vs. YTD Target
- Conditional Formatting with up and down arrows indicating whether performance is improving or declining.
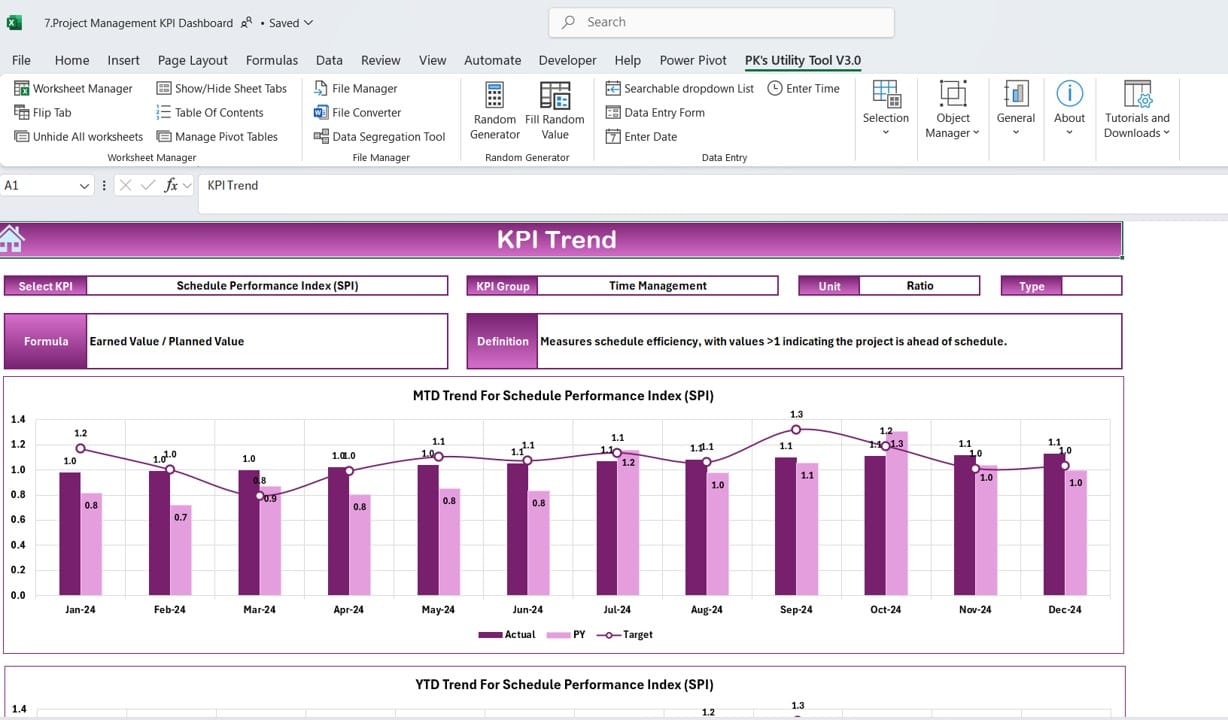
KPI Trend Sheet Tab
Click to buy Project Management KPI Dashboard in Excel
The KPI Trend Sheet provides a deeper dive into individual KPIs. Here, users can select a KPI from the drop-down menu (cell C3) to see details such as:
- KPI Group
- Unit of Measurement
- KPI Type (e.g., Lower the Better or Upper the Better)
- KPI Formula
- KPI Definition
This sheet also includes trend charts that display MTD and YTD performance for Actual, Target, and PY values, providing a clear visual representation of performance over time.
Actual Numbers Input Sheet
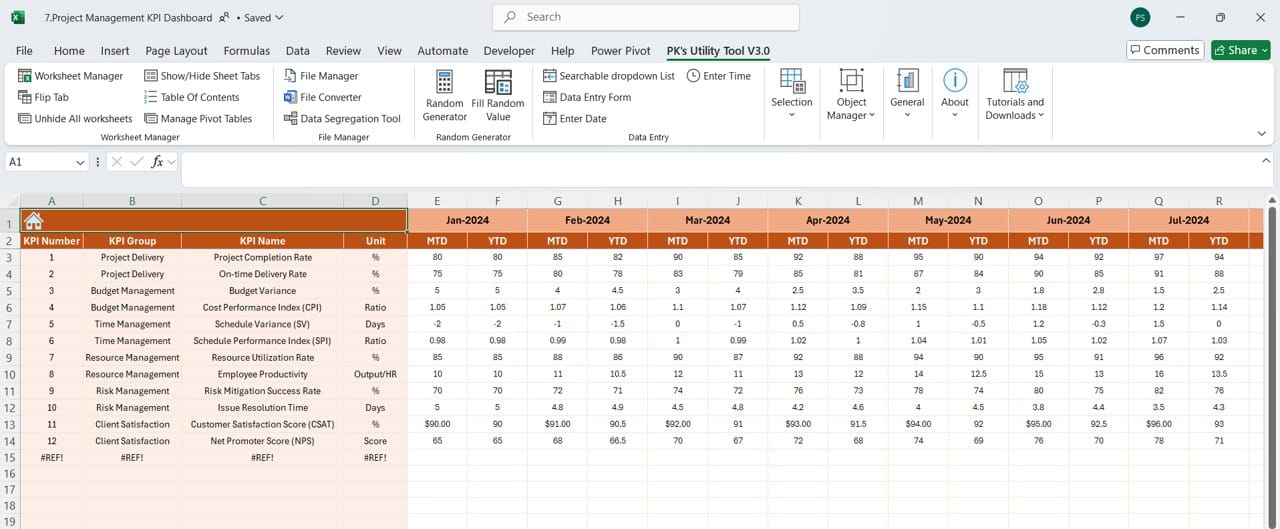
Actual Numbers
Click to buy Project Management KPI Dashboard in Excel
Actual Numbers Input Sheet is where you enter the actual values for both MTD and YTD numbers for each KPI. You can easily change the month by adjusting the value in cell E1.
Target Sheet Tab
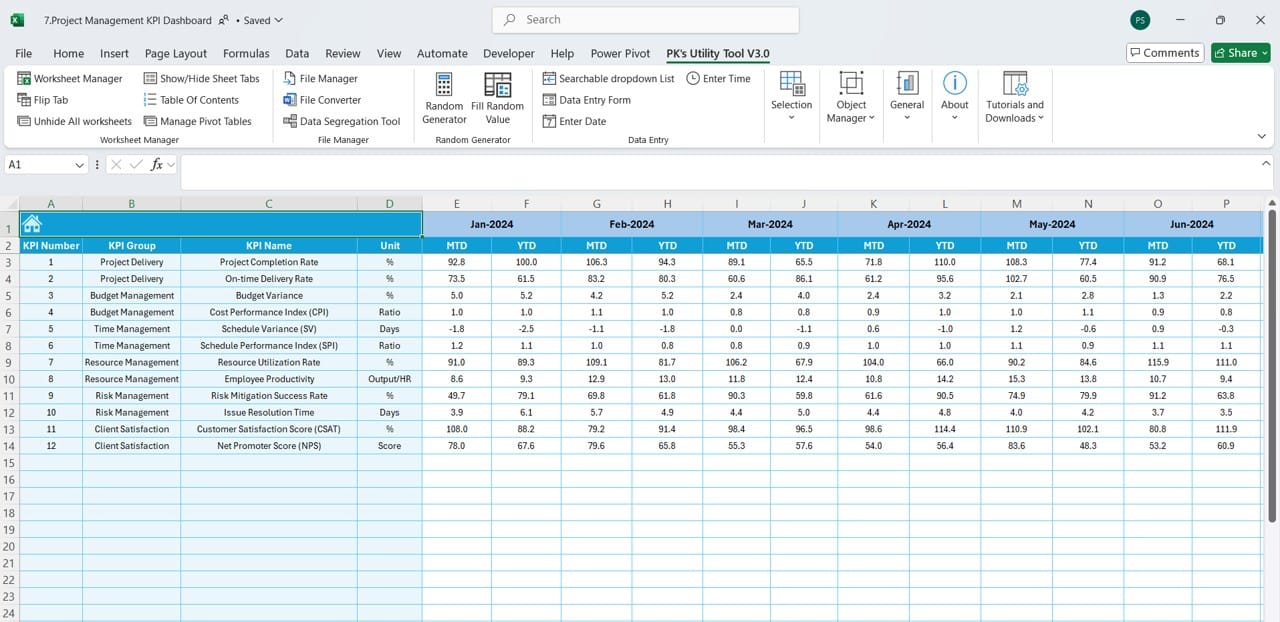
Target Sheet
Click to buy Project Management KPI Dashboard in Excel
In this sheet, you input the target values for each KPI. It allows you to specify both MTD and YTD targets, ensuring you can track monthly as well as cumulative performance.
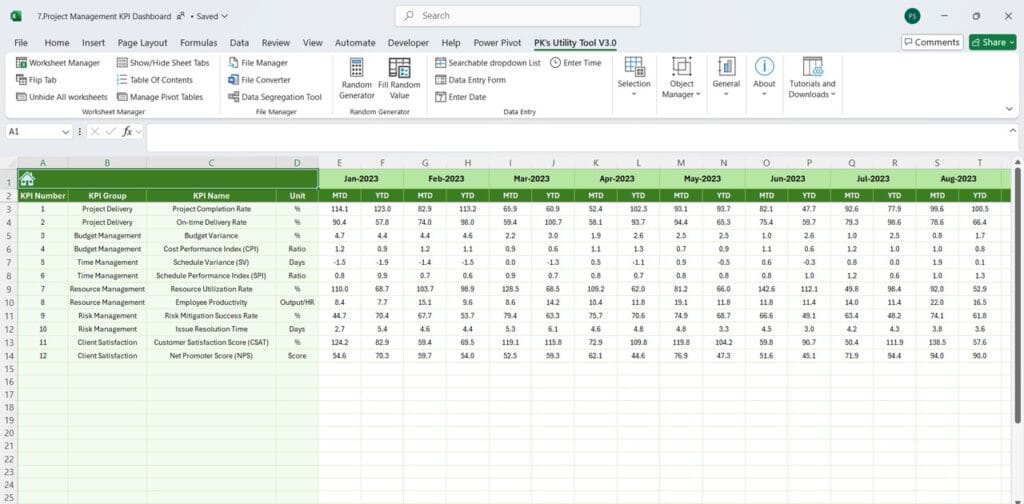
Previous Year Numbers Sheet Tab
Click to buy Project Management KPI Dashboard in Excel
This sheet is for entering previous year’s KPI numbers. By having historical data, you can better understand performance trends and compare current numbers against last year’s results.
KPI Definition Sheet Tab
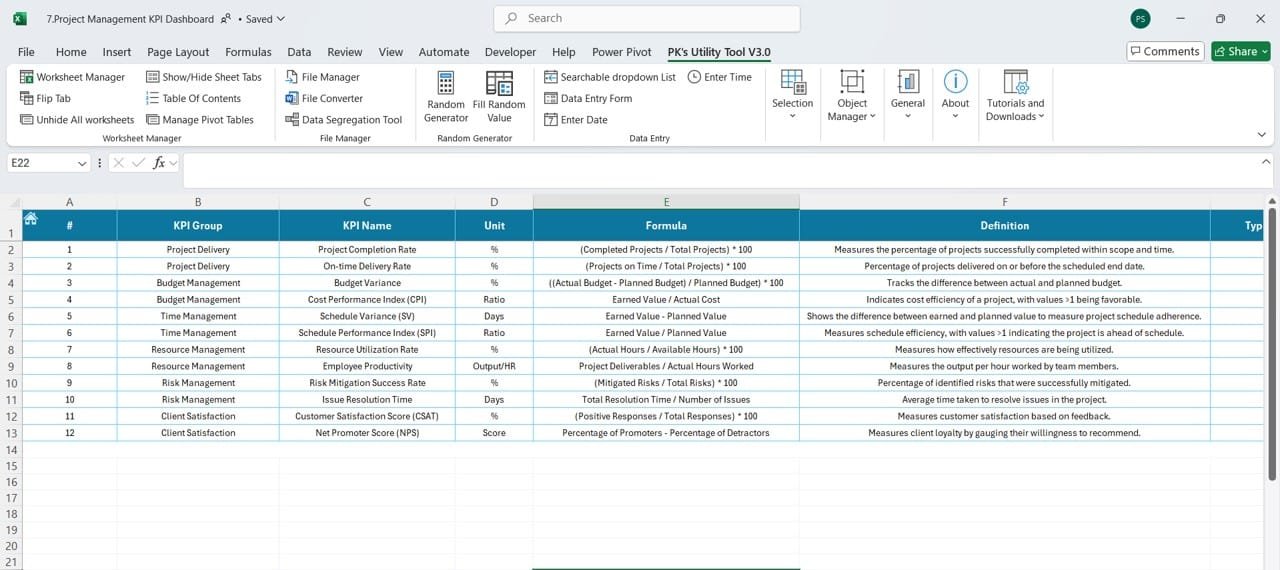
KPI Definition Sheet
Click to buy Project Management KPI Dashboard in Excel
This sheet provides an easy-to-reference summary of each KPI, including:
- KPI Name
- KPI Group
- Measurement Unit
- KPI Formula
- Definition
Having this sheet available ensures that everyone in the project team is on the same page regarding KPI definitions and calculations.
Advantages of the Project Management KPI Dashboard
A KPI Dashboard brings many benefits to a project management team. Let’s take a look at the key advantages:
- Real-time Data Tracking: By selecting the current month, the dashboard instantly updates the MTD and YTD numbers, providing real-time insights into project performance. This allows teams to act swiftly in case of deviations.
- Customizable and Scalable: Our dashboard is designed to be fully customizable. You can easily modify the KPI definitions, formulas, and targets to suit the specific needs of your project or organization.
- Visual Insights: The use of conditional formatting, arrows, and trend charts provides an at-a-glance understanding of whether a project is on track or needs attention. Visual cues are particularly useful for presenting complex data to stakeholders in an easy-to-digest format.
- Historical Comparisons: Tracking previous year’s data allows teams to make informed decisions by comparing past performance with current metrics. Understanding historical trends helps project managers set more realistic targets and avoid past pitfalls.
- Easy-to-Use Template: This template is designed with simplicity in mind, so even users with limited Excel experience can navigate through the dashboard and input the required data.
Click to buy Project Management KPI Dashboard in Excel
Best Practices for Using a Project Management KPI Dashboard
To get the most out of your KPI Dashboard, follow these best practices:
- Define Relevant KPIs: Start by clearly defining the most important KPIs that will impact your project’s success. Overloading the dashboard with too many metrics can dilute focus.
- Keep Data Up to Date: The dashboard is only as useful as the data entered. Ensure that you regularly update actual values and target numbers to reflect the latest project performance.
- Use Conditional Formatting for Visual Cues: Conditional formatting is an excellent way to add visual impact to your dashboard. Use color codes and arrows to indicate whether performance is improving or declining, making it easier to identify problem areas.
- Communicate with Stakeholders: Use the dashboard to facilitate regular meetings with project stakeholders. Visual representations of KPIs make it easier to convey project performance, which helps align expectations.
- Customize the Dashboard as Needed: No two projects are the same, so it’s essential to customize the dashboard to meet your project’s unique requirements. Whether it’s adjusting formulas or adding new KPIs, make sure the dashboard reflects your specific project goals.
Click to buy Project Management KPI Dashboard in Excel
Opportunities for Improvement in the Project Management KPI Dashboard
While this dashboard provides a comprehensive view of project performance, there are still a few areas where improvements could be made:
- Automation of Data Entry: One area to consider is automating the data entry process. By linking the dashboard to a project management system or using Excel’s Power Query feature, you can automatically pull in data from external sources, reducing the time spent on manual input.
- More Interactive Charts: The dashboard could be enhanced by incorporating interactive charts using Excel’s Pivot Charts or by integrating it with Power BI. This would provide more dynamic visualizations and allow for better interactivity.
- Integration with Other Tools: Integrating the KPI dashboard with tools such as Microsoft Project or Trello could provide seamless data flow, making it easier to keep the dashboard up to date and relevant to ongoing projects.
Click to buy Project Management KPI Dashboard in Excel
Conclusion
A Project Management KPI Dashboard in Excel is an invaluable tool for tracking the success of a project. By using a well-structured, easy-to-read dashboard, project managers can keep track of key performance indicators, identify trends, and take corrective actions to ensure the project stays on track.
This Excel-based template offers flexibility, visual insights, and scalability for managing both small and large-scale projects. By following best practices and exploring opportunities for improvement, this dashboard will significantly improve your project management capabilities.
Frequently Asked Questions (FAQs)
Q. How do I customize KPIs in the dashboard?
You can customize the KPIs by editing the KPI Definition Sheet. Here, you can change the KPI names, formulas, and units of measurement. You can also modify the Target Sheet and Actual Numbers Input Sheet to input different data points specific to your project.
Q. Can I use this dashboard for multiple projects?
Yes, you can easily adapt this template for use across multiple projects. You can create additional sheets for each project or modify the drop-down menus to reflect different projects and their respective KPIs.
Q. How do I automate data input?
Automation can be achieved by linking the Excel file to external data sources using Power Query or integrating it with a project management software. This will allow data to flow directly into your KPI dashboard without the need for manual updates.
Q. What KPIs should I track for project management?
Common project management KPIs include Budget Variance, On-time Delivery Rate, Cost Performance Index (CPI), Schedule Performance Index (SPI), and Resource Utilization Rate. However, the exact KPIs to track will depend on the goals and objectives of your specific project.
Q. How often should I update the KPI Dashboard?
The frequency of updates depends on the duration of your project. For long-term projects, monthly updates may suffice, while short-term projects might require weekly or even daily updates to ensure the most up-to-date data is available.
Click to buy Project Management KPI Dashboard in Excel
Visit our YouTube channel to learn step-by-step video tutorials
Click to buy Project Management KPI Dashboard in Excel