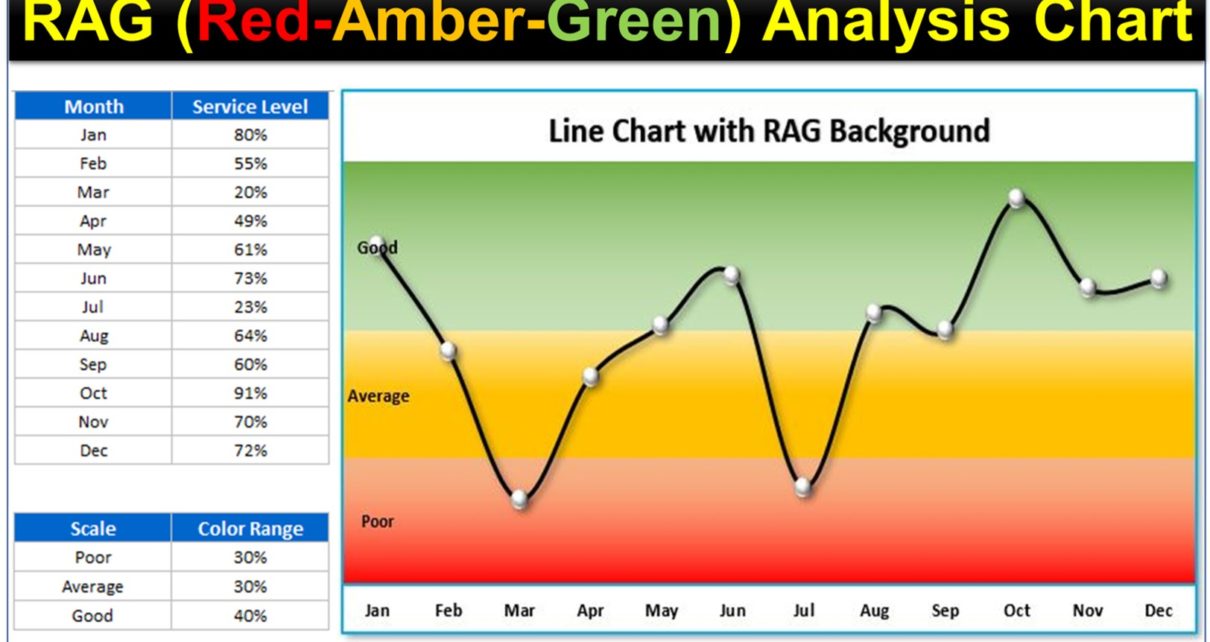
RAG (Red, Amber and Green) Analysis Chart in Excel is very useful to analyze the performance. We have designed this chart using Stacked column chart and Line chart. You can change the background color range by just changing numbers on excel.
RAG (Red, Amber and Green) Analysis Chart in Excel
Below is the data set which we have used for this chart. We have taken 3 support columns here.
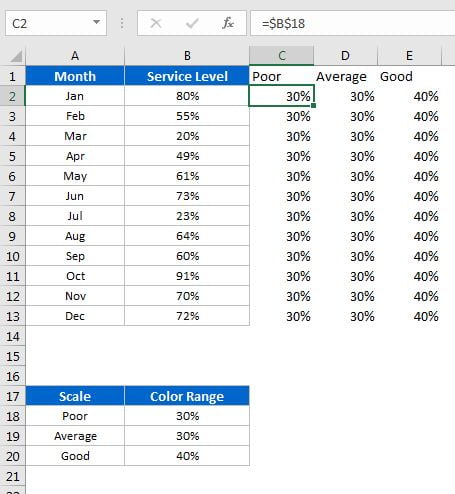
Click to buy RAG (Red, Amber and Green) Analysis Chart in Excel
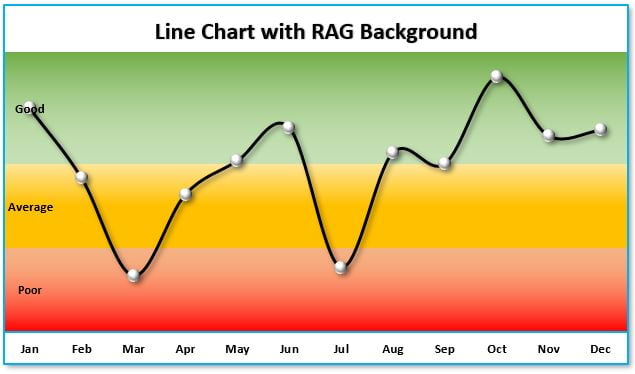
Below is the snapshot to Line chart with dynamic RAG Background color
Click to buy RAG (Red, Amber and Green) Analysis Chart in Excel
Visit our YouTube channel to learn step-by-step video tutorials
Watch step by step video tutorial:
Click to buy RAG (Red, Amber and Green) Analysis Chart in Excel