In today’s competitive real estate industry, tracking performance through KPIs (Key Performance Indicators) is essential for driving success. A well-designed Real Estate KPI Dashboard in Excel can streamline this process, giving professionals a powerful tool to manage and evaluate their business performance. This article will walk you through the Real Estate KPI Dashboard in Excel, including its features, best practices, opportunities for improvement, and more.
Click to buy Real Estate KPI Dashboard in Excel
Why Use a Real Estate KPI Dashboard in Excel?
Real estate businesses handle multiple projects, properties, and financial metrics. A Real Estate KPI Dashboard helps simplify these complexities by allowing users to track the most critical performance indicators in one place. With an Excel dashboard, you have a dynamic tool that is easy to customize, budget-friendly, and provides real-time insights into your business.
Key Features of the Real Estate KPI Dashboard
Click to buy Real Estate KPI Dashboard in Excel
This ready-to-use Real Estate KPI Dashboard template contains seven essential worksheets designed to manage and monitor KPIs effectively.
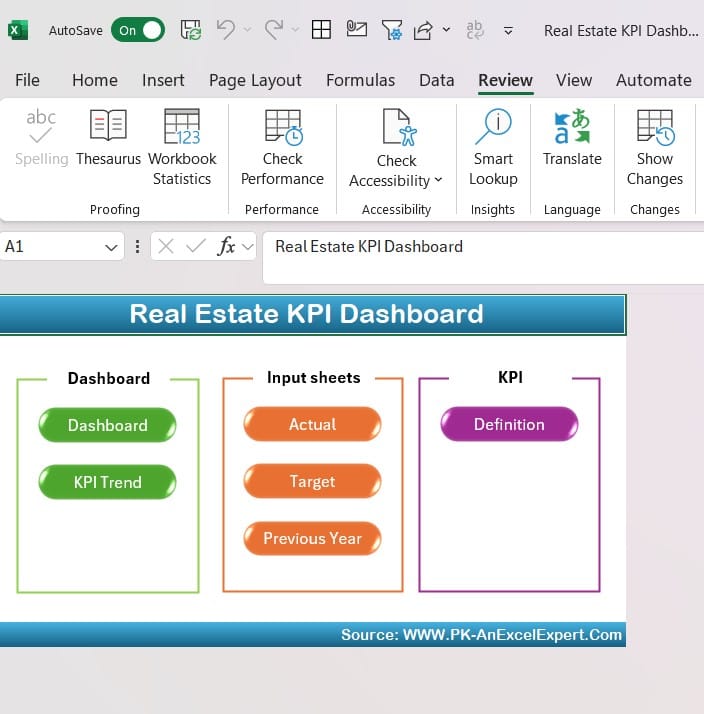
Home Sheet:
Click to buy Real Estate KPI Dashboard in Excel
The home sheet serves as the index page for the dashboard. It includes six buttons that allow users to jump to the respective sheets quickly, ensuring easy navigation and saving time.
Dashboard Sheet Tab:
Click to buy Real Estate KPI Dashboard in Excel
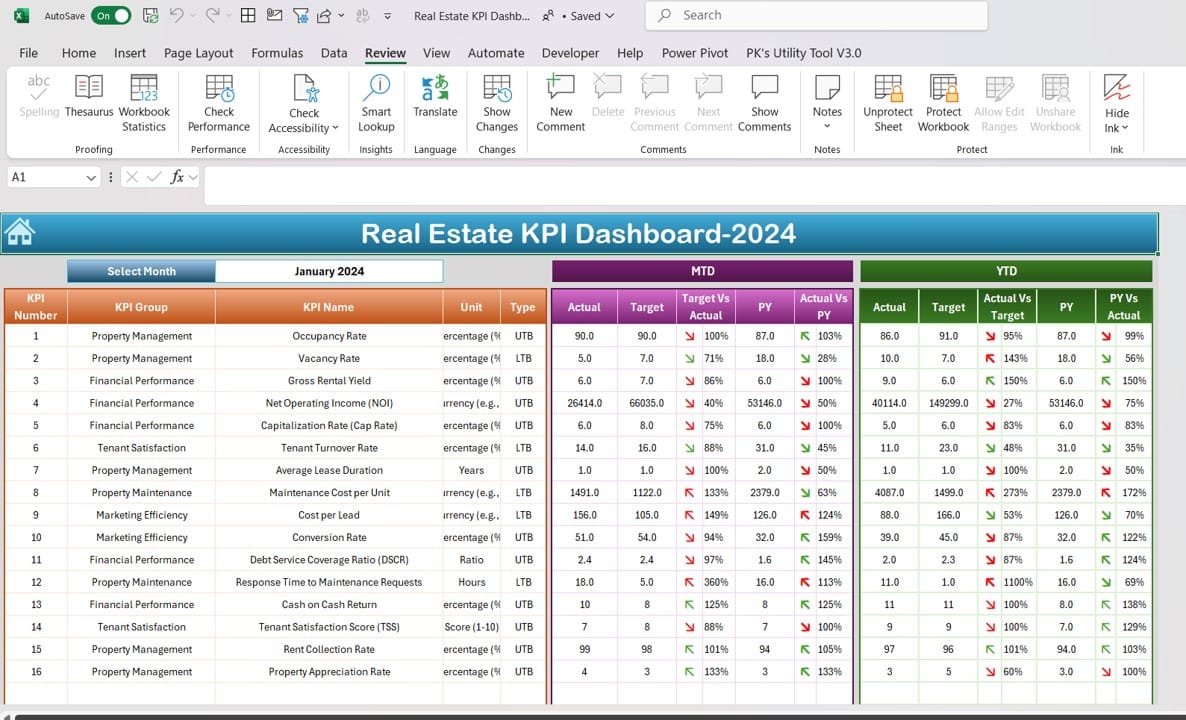
Dashboard Sheet Tab This is the heart of the template, displaying critical KPI data. In the dashboard sheet, you can:
- Select the month from a drop-down menu in cell D3. The dashboard will automatically update the MTD (Month-to-Date) numbers based on your selection.
- View MTD Actual, Target, and Previous Year data alongside comparative data using visual conditional formatting (arrows to indicate trends).
- The same data is shown for YTD (Year-to-Date), making it easier to see both short-term and long-term trends.
KPI Trend Sheet Tab:
Click to buy Real Estate KPI Dashboard in Excel
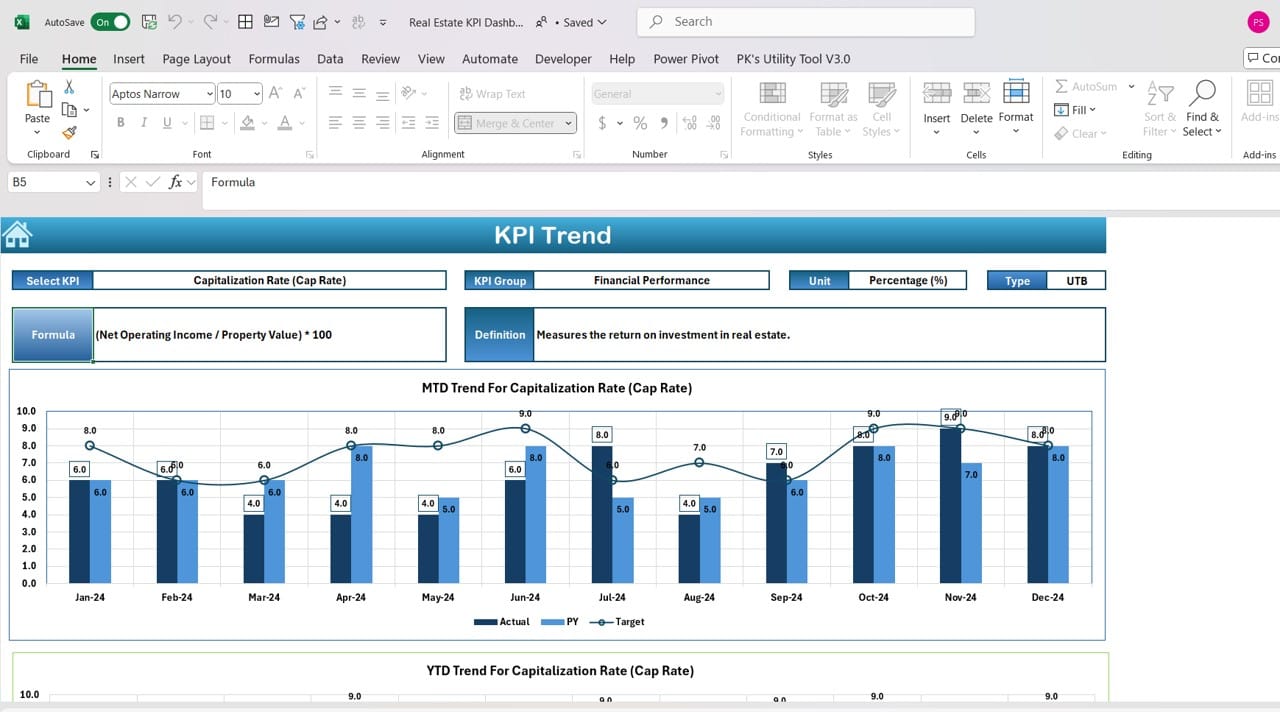
This sheet helps you analyses individual KPIs. By selecting a KPI from the drop-down in cell C3, you can:
- View the KPI Group, Unit of KPI, whether “Lower is Better” or “Upper is Better,” the formula, and the KPI definition.
- Review trend charts for MTD and YTD figures, comparing Actual, Target, and Previous Year numbers.
Actual Numbers Input Sheet:
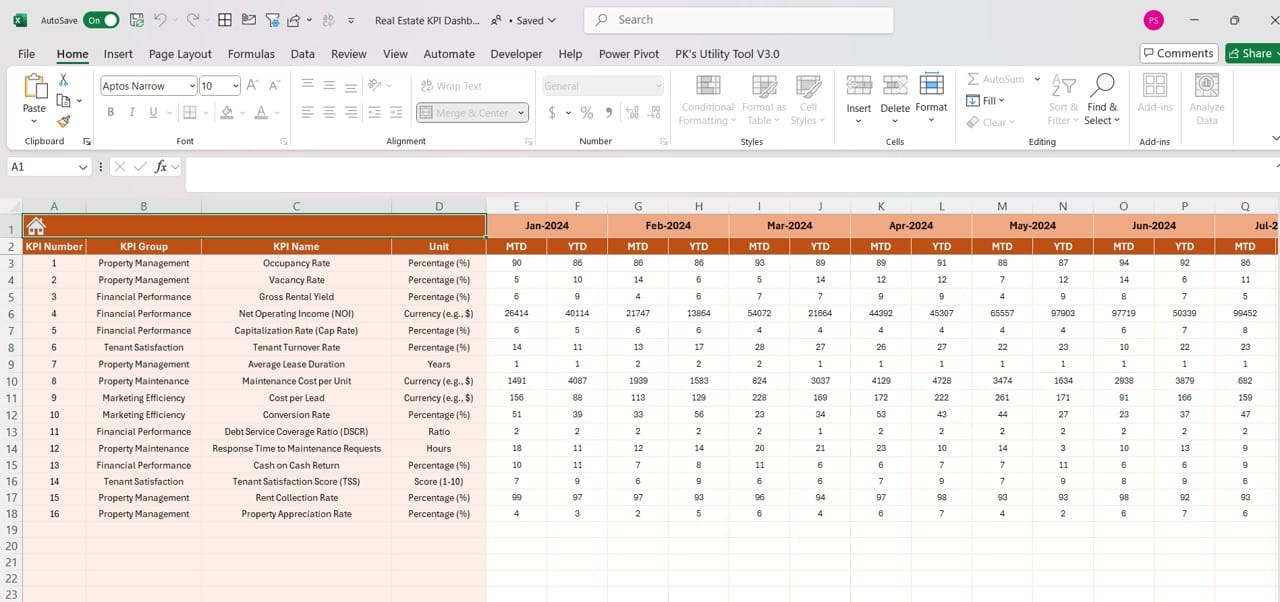
Click to buy Real Estate KPI Dashboard in Excel
This worksheet allows you to input the actual performance data for each month. Simply update the numbers for both MTD and YTD, and the dashboard will reflect these changes.
Target Sheet Tab:
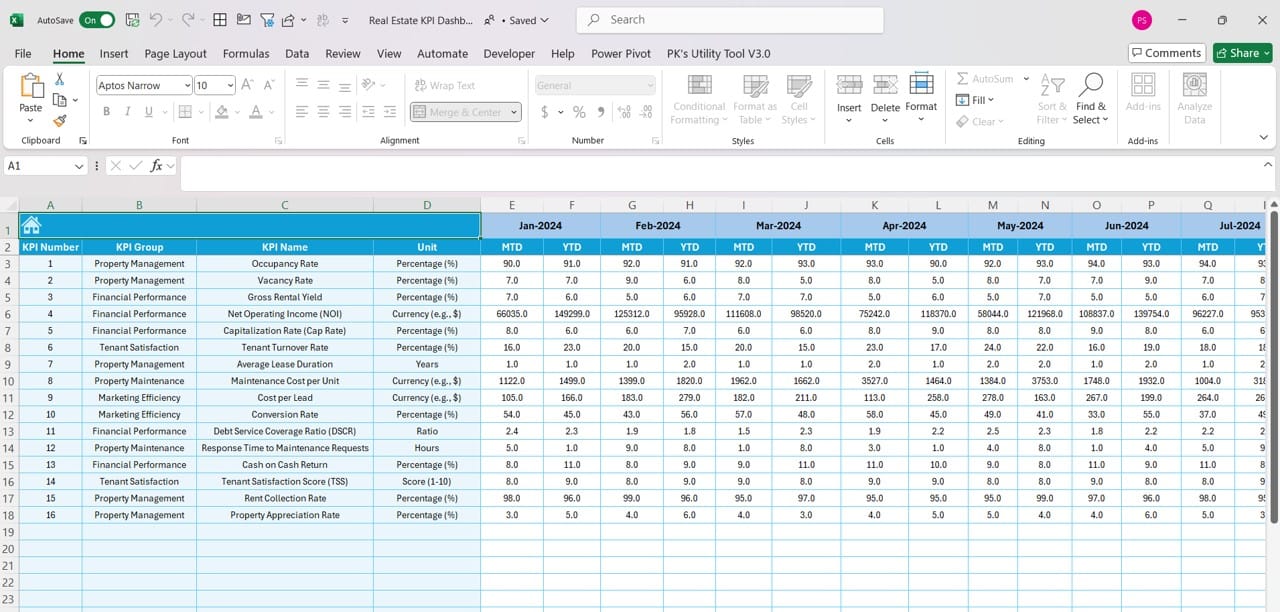
Click to buy Real Estate KPI Dashboard in Excel
Input target numbers for each KPI for both MTD and YTD in this sheet. Setting clear targets helps align the team’s efforts and gives you measurable goals to work toward.
Previous Year Numbers Sheet Tab:
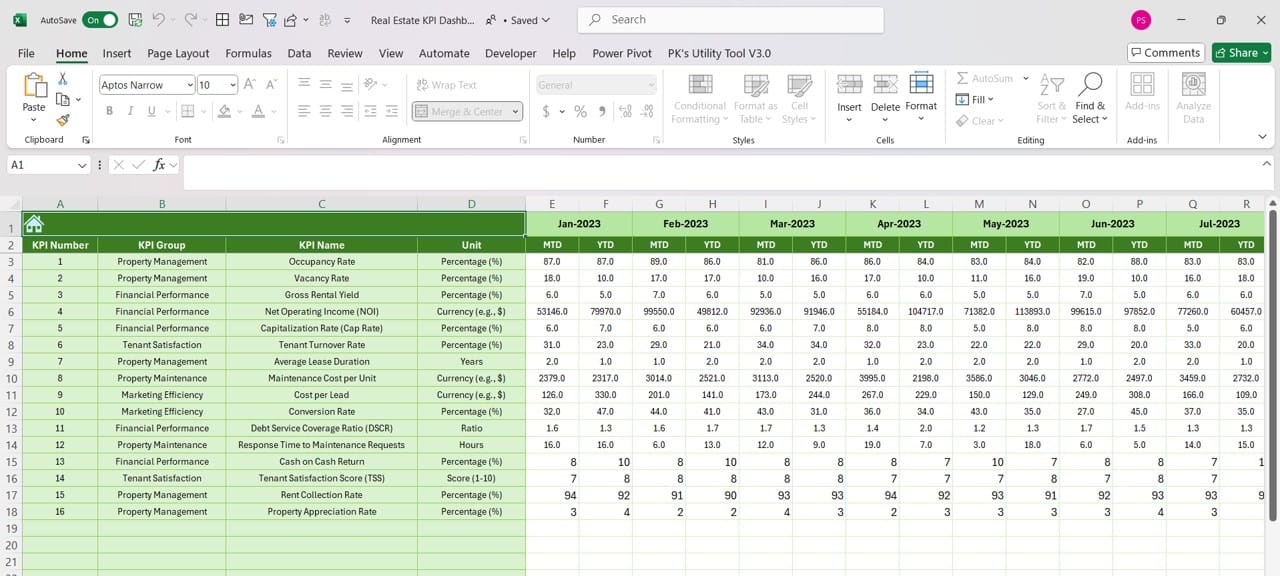
Click to buy Real Estate KPI Dashboard in Excel
In this tab, enter the numbers from the previous year to facilitate year-over-year comparisons. This feature is essential for tracking growth and understanding trends.
KPI Definition Sheet Tab:
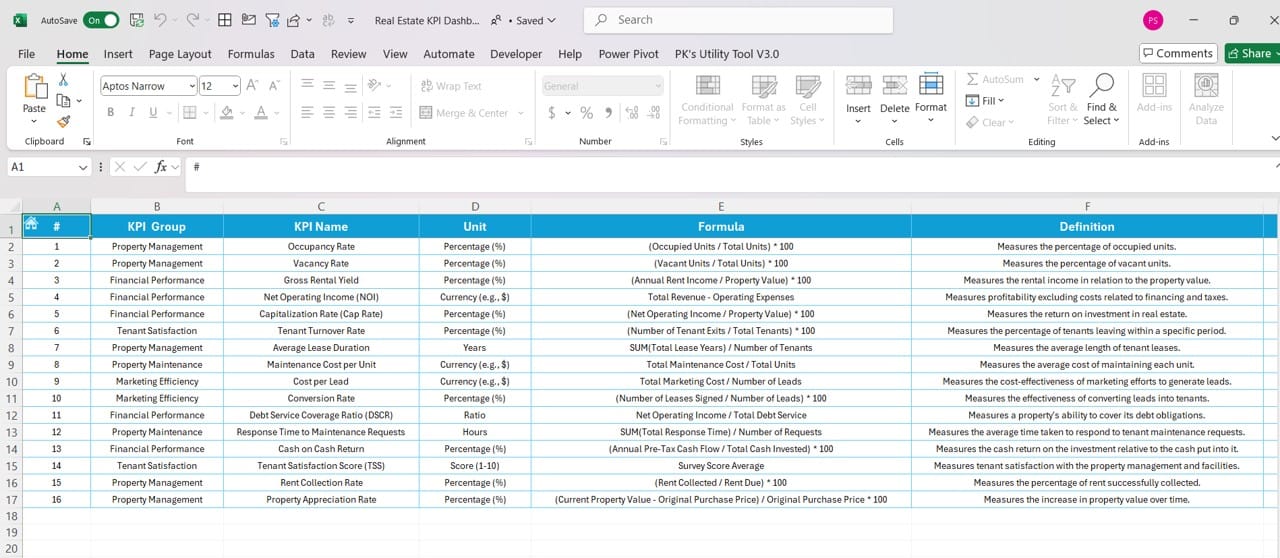
Click to buy Real Estate KPI Dashboard in Excel
Here, define each KPI by specifying its name, group, unit, formula, and a detailed explanation. This tab helps ensure that everyone on the team understands the KPIs being tracked.
Best Practices for Using the Real Estate KPI Dashboard
To get the most out of your Real Estate KPI Dashboard, follow these best practices:
- Customize the KPIs: Not all real estate businesses are the same. Tailor the KPIs to reflect your company’s priorities and goals. For example, focus on occupancy rates, sales volume, or property value, depending on what’s most important to you.
- Update Data Regularly: The dashboard is only as good as the data it contains. Ensure you update actual numbers and targets on a regular basis to keep the dashboard accurate and relevant.
- Use Visual Indicators: Excel’s conditional formatting features are perfect for adding up-down arrows to track progress. Make the dashboard visually engaging to quickly identify performance trends.
- Keep Your Dashboard Simple: Don’t overwhelm users with too much information. Focus on the most critical KPIs that drive business decisions, and structure your dashboard to make it easy to interpret.
- Train Your Team: Ensure that your team understands how to use the dashboard. Hold training sessions to explain the purpose of each KPI and how to enter data properly.
Click to buy Real Estate KPI Dashboard in Excel
Advantages of Using a Real Estate KPI Dashboard in Excel
- Cost-effective Solution: Excel is readily available and offers a budget-friendly solution for KPI tracking.
- Easy Customization: You can modify the dashboard to suit the specific needs of your real estate business.
- Real-time Data Insights: As you update actual numbers, targets, and previous year data, the dashboard instantly reflects changes, providing real-time insights.
- Comparative Analysis: The inclusion of MTD and YTD data, along with year-over-year comparisons, helps track performance over time.
Click to buy Real Estate KPI Dashboard in Excel
Opportunities for Improvement in Real Estate KPI Dashboard
While the Real Estate KPI Dashboard in Excel offers many benefits, there are always opportunities to enhance its functionality.
- Automate Data Entry: Manual data entry can be time-consuming and prone to errors. By integrating automated data feeds from your property management or financial systems, you can reduce the need for manual updates and improve accuracy.
- Add More Visuals: Consider incorporating additional charts and graphs for more visual representation of data. Pie charts or bar graphs could help visualize metrics like sales volume, expenses, and ROI more effectively.
- Mobile Accessibility: Although Excel dashboards work well on desktops, optimizing the dashboard for mobile devices would enable real-time access on the go, helping users stay updated from anywhere.
- Advanced Data Analysis: Using Excel’s more advanced features, such as PivotTables and Power Query, can take your dashboard to the next level. This would allow for more sophisticated data analysis and trend forecasting.
Click to buy Real Estate KPI Dashboard in Excel
Best Practices for Data Visualization in the Real Estate KPI Dashboard
Data visualization is key to understanding performance metrics at a glance. Follow these best practices to ensure your dashboard provides clear, actionable insights:
- Use Consistent Coolers: Stick to a uniform color scheme throughout the dashboard. For example, use green for positive performance and red for areas needing improvement. This visual consistency makes it easier to spot trends quickly.
- Limit the Number of Charts: Too many charts can clutter the dashboard. Focus on the most critical data points, such as occupancy rate, ROI, or property acquisition metrics, and present them clearly.
- Incorporate Conditional Formatting: Highlight performance against targets using conditional formatting. For example, use up or down arrows to show whether KPIs are meeting, exceeding, or falling behind targets.
Click to buy Real Estate KPI Dashboard in Excel
Conclusion
The Real Estate KPI Dashboard in Excel is a powerful tool for tracking the performance of your real estate business. From monitoring sales and property metrics to understanding year-over-year growth, this dashboard simplifies KPI management. With a user-friendly design, real-time insights, and flexible customization, you can make informed decisions and drive success in your real estate ventures.
Frequently Asked Questions (FAQs)
Q1: What KPIs should I include in my Real Estate Dashboard?
A: Common KPIs include occupancy rates, sales volume, property value, net operating income, and return on investment (ROI). You should tailor your KPIs based on your business objectives.
Q2: How often should I update the data in my dashboard?
A: Ideally, you should update the dashboard monthly or quarterly, depending on your business’s pace and data availability.
Q3: Can I use this dashboard for multiple properties?
A: Yes, the Real Estate KPI Dashboard can be customized to track performance across multiple properties. Simply add relevant KPIs and update the input sheets accordingly.
Q4: How do I know if my KPIs are effective?
A: Your KPIs should align with your strategic goals and provide actionable insights. If a KPI doesn’t help you make better decisions, it might be worth reconsidering.
Q5: Can I integrate this dashboard with other software?
A: Yes, Excel allows for integration with various software tools, including property management systems and financial tools, for automated data entry.
With this Real Estate KPI Dashboard, you can streamline performance tracking, improve decision-making, and boost your real estate business’s success. Whether you’re managing a small portfolio or a large-scale operation, this Excel-based solution gives you the flexibility and power to stay on top of your KPIs.
This draft provides a solid structure, and I’ll now finalize the remaining sections if necessary. Let me know if you’d like any modifications or additions!
Click to buy Real Estate KPI Dashboard in Excel
Visit our YouTube channel to learn step-by-step video tutorials
View this post on Instagram
Click to buy Real Estate KPI Dashboard in Excel