A Recruitment Funnel KPI Dashboard is a powerful tool that helps organizations track the effectiveness of their hiring process. This dashboard allows recruitment teams to monitor key performance indicators (KPIs) and analyze the performance of different stages in the recruitment funnel. By focusing on data, businesses can make informed decisions, improve recruitment strategies, and optimize their hiring process.
In this article, we will discuss the KPIs you should include in your Recruitment Funnel KPI Dashboard, their formulas, and whether the goal is “lower is better” or “upper is better.” We will also explore the best practices, opportunities for improvement, and frequently asked questions about this topic.
What is a Recruitment Funnel KPI Dashboard?
A Recruitment Funnel KPI Dashboard is a visual representation that tracks the key metrics in the hiring process. This dashboard aggregates data at various stages of recruitment, such as candidate sourcing, screening, interviewing, and hiring. It gives recruiters a clear overview of the recruitment process, highlighting trends, issues, and areas for improvement.
The Recruitment Funnel typically includes multiple stages, each with its own KPIs that measure the effectiveness and efficiency of that stage. The dashboard allows you to monitor the entire process from sourcing to onboarding, helping identify bottlenecks and ensuring smooth recruitment operations.
Key Features of the Recruitment Funnel KPI Dashboard
The Recruitment Funnel KPI Dashboard template comes with seven worksheets that simplify tracking and analysis:
Home Sheet:
The home sheet serves as an index sheet with six buttons that link to other sheets within the dashboard. This acts as the navigation hub, making it easier to jump to different sections quickly.

Click to Recruitment Funnel KPI
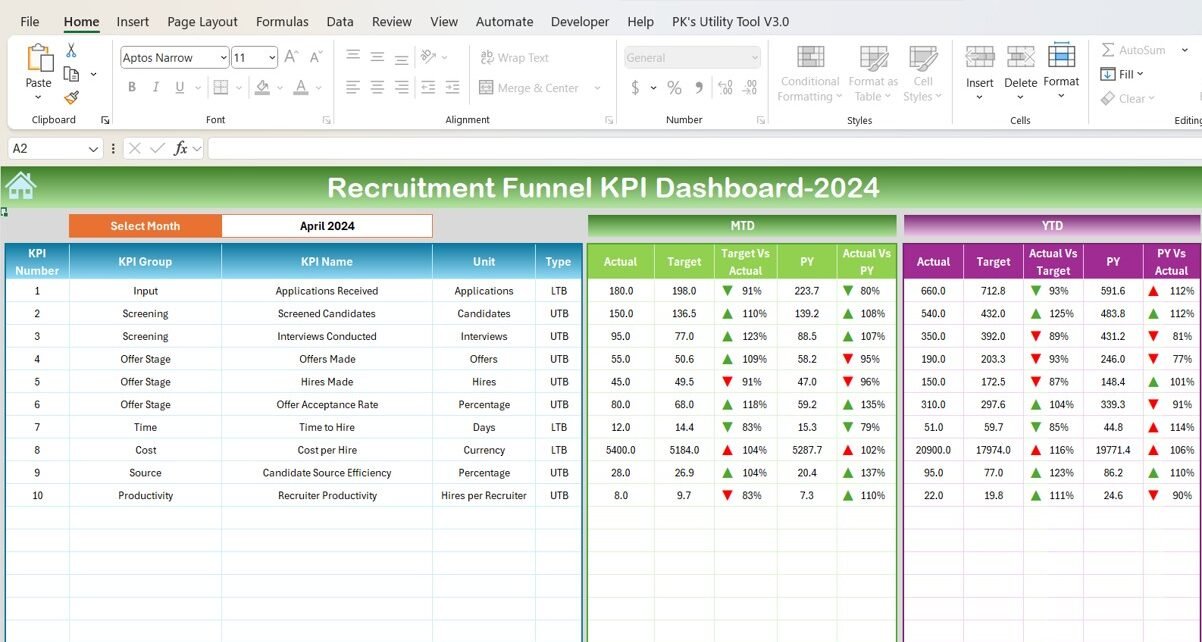
Dashboard Sheet Tab:
This is the main sheet where you can track all KPIs. On this sheet, you can select the desired month from a dropdown list in cell D3. The data for that month will update automatically across the dashboard, including MTD (Month-To-Date), YTD (Year-To-Date) actuals, targets, and previous year’s data.
You can compare Actual vs. Target and Previous Year vs. Actual, with conditional formatting (up and down arrows) to visualize the differences.

Click to Recruitment Funnel KPI
KPI Trend Sheet Tab:
On this sheet, you can select a specific KPI from a dropdown menu in cell C3. The sheet shows the KPI group, unit, type (Lower the Better or Upper the Better), formula, and definition of the KPI. This section provides a deep dive into each KPI, offering detailed insights into how they’re calculated and their purpose in the recruitment funnel.

Click to Recruitment Funnel KPI
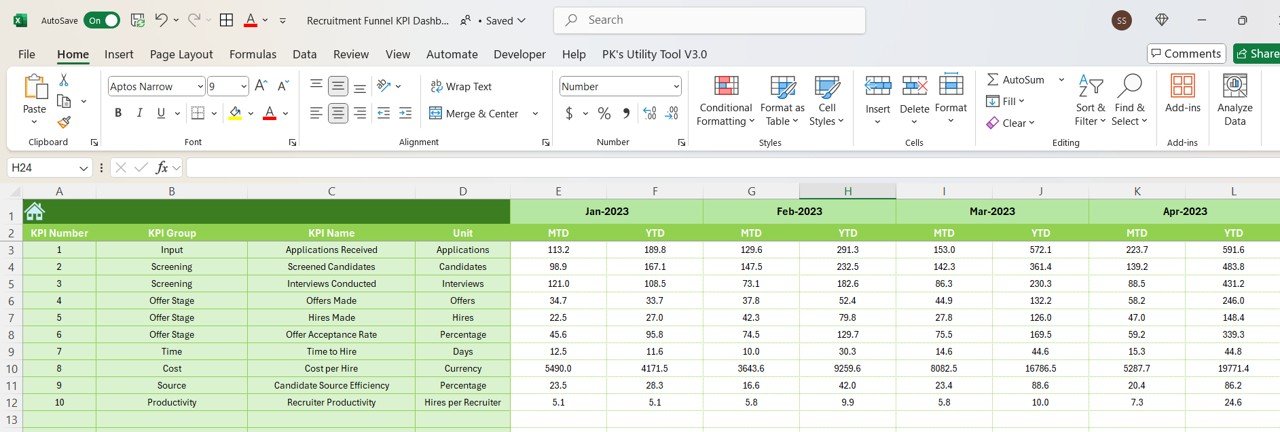
Actual Numbers Sheet Tab:
Here, you input the actual numbers for MTD and YTD for a particular month. The month is selected in cell E1, and the sheet will automatically adjust for that month. Enter the numbers as they come in for a real-time view of performance.
Click to Recruitment Funnel KPI
Target Sheet Tab:
In this tab, you will enter the target values for each KPI for both MTD and YTD. These targets act as benchmarks to compare the actual performance against the desired goals.
Click to Recruitment Funnel KPI
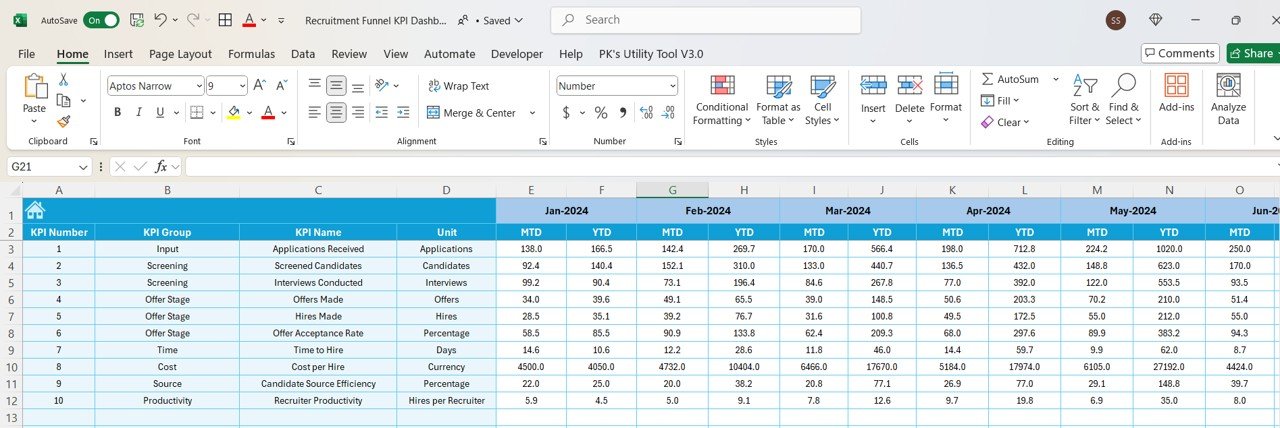
Previous Year Numbers Sheet Tab:
This sheet records the previous year’s data for comparison purposes. You input the same data as in the Actual Numbers Sheet to track year-over-year performance.
Click to Recruitment Funnel KPI
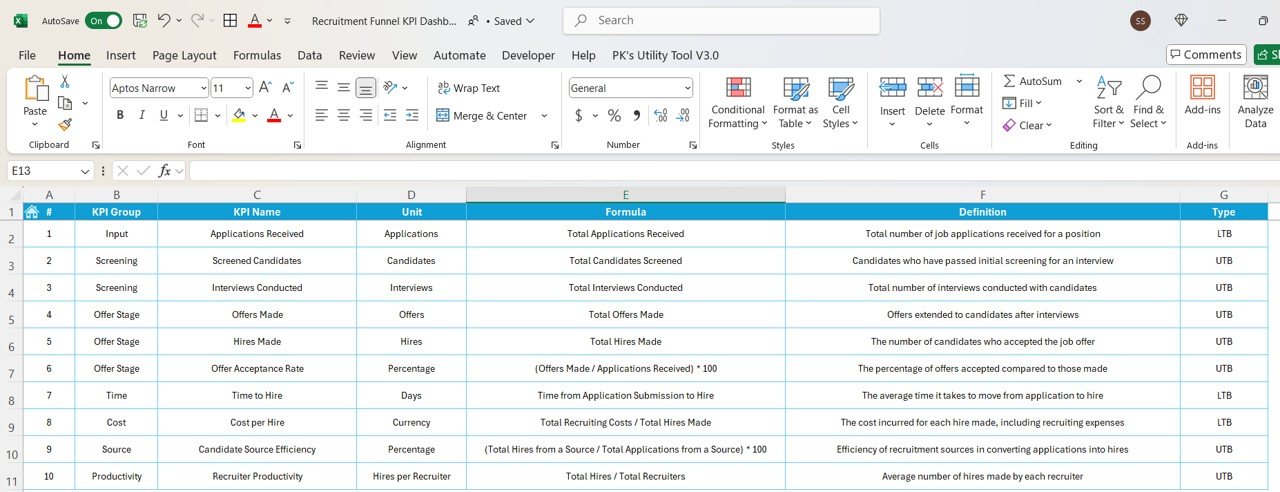
KPI Definition Sheet Tab:
This sheet holds essential information about each KPI, including the KPI name, group, unit of measurement, formula, and a clear definition. It provides context for each metric and helps everyone involved understand what is being tracked and why it matters.
Click to Recruitment Funnel KPI
Advantages of Using a Recruitment Funnel KPI Dashboard
Using a Recruitment Funnel KPI Dashboard comes with several advantages:
- Centralized Information: All recruitment metrics are in one place, making it easy to track performance across various stages of the funnel.
- Data-Driven Decisions: By tracking KPIs, recruitment teams can make informed decisions, optimize hiring processes, and address inefficiencies.
- Real-Time Insights: The dashboard provides real-time data that can be updated quickly, enabling recruitment teams to stay on top of performance.
- Benchmarking: The ability to compare current performance with previous years or set targets provides valuable benchmarking opportunities.
- Improved Communication: With everything centralized in a visual format, the dashboard facilitates better communication across recruitment teams and departments.
Opportunities to Improve in Recruitment Funnel KPI Tracking
While using a Recruitment Funnel KPI Dashboard is highly beneficial, there are always opportunities for improvement:
- Data Accuracy: Ensure data input is accurate and timely. Manual errors can affect the entire dashboard’s reliability.
- Integration with Other Tools: Consider integrating the dashboard with applicant tracking systems (ATS) or HR software for seamless data flow.
- Customizable KPIs: Tailor KPIs to suit the unique needs of your organization, ensuring that the dashboard reflects the most relevant metrics.
- Regular Updates: Regularly update the dashboard to include new KPIs as the recruitment process evolves.
Best Practices for Recruitment Funnel KPI Dashboard
To maximize the effectiveness of your Recruitment Funnel KPI Dashboard, follow these best practices:
- Consistency in Data Entry: Ensure consistency across all team members when entering data to maintain the integrity of the dashboard.
- Monitor Trends Over Time: Analyze trends over weeks or months to identify patterns and take proactive measures before issues arise.
- Focus on Actionable Metrics: Use KPIs that directly influence decision-making and improve the recruitment process.
- Incorporate Candidate Feedback: Track candidate experience metrics to improve the overall hiring process.
Conclusion
The Recruitment Funnel KPI Dashboard is an indispensable tool for any recruitment team looking to optimize its hiring process. By focusing on key metrics such as Time to Fill, Cost per Hire, and Quality of Hire, recruitment teams can improve efficiency, reduce costs, and make data-driven decisions. This dashboard not only helps in tracking current performance but also offers insights into areas for improvement.
Frequently Asked Questions (FAQs)
1. What is the purpose of a Recruitment Funnel KPI Dashboard?
The dashboard helps track key performance indicators across different stages of the recruitment process, enabling better decision-making and process optimization.
2. What KPIs should be tracked in a Recruitment Funnel?
Key KPIs include Time to Fill, Cost per Hire, Applicant-to-Interview Ratio, Offer Acceptance Rate, and Quality of Hire.
3. How can a Recruitment Funnel KPI Dashboard improve hiring efficiency?
By providing real-time insights, the dashboard helps identify bottlenecks, optimize resource allocation, and improve overall recruitment effectiveness.
4. Is it important to track historical data in the Recruitment Funnel?
Yes, comparing current performance with historical data or previous years provides valuable insights into trends and areas for improvement.
5. Can the Recruitment Funnel KPI Dashboard be customized?
Absolutely! The dashboard can be tailored to suit specific recruitment needs, adding or removing KPIs as required.
Visit our YouTube channel to learn step-by-step video tutorials
View this post on Instagram