Regulatory reporting plays a crucial role in ensuring that businesses comply with industry regulations and government policies. It involves tracking key performance indicators (KPIs) to measure financial and operational efficiency while staying within legal requirements. To make this process easier, a Regulatory Reporting KPI Dashboard in Excel provides an organized and efficient way to monitor these metrics.
This article introduces a ready-to-use Excel template designed to help businesses track, analyze, and report their regulatory KPIs in a structured manner.
Click to buy Regulatory Reporting
Key Features of the Regulatory Reporting KPI Dashboard
Our Regulatory Reporting KPI Dashboard in Excel comes with seven worksheets, each serving a specific purpose to streamline the reporting process. Let’s take a closer look at each of them:
Home Sheet
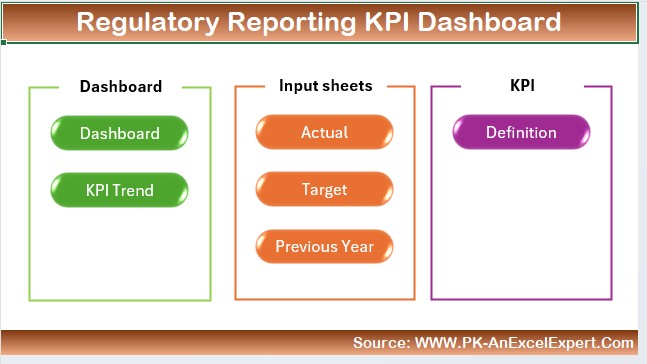
This is the index page of the dashboard, offering navigation buttons that allow users to move quickly between different sections. It provides a simple and intuitive way to access various sheets.
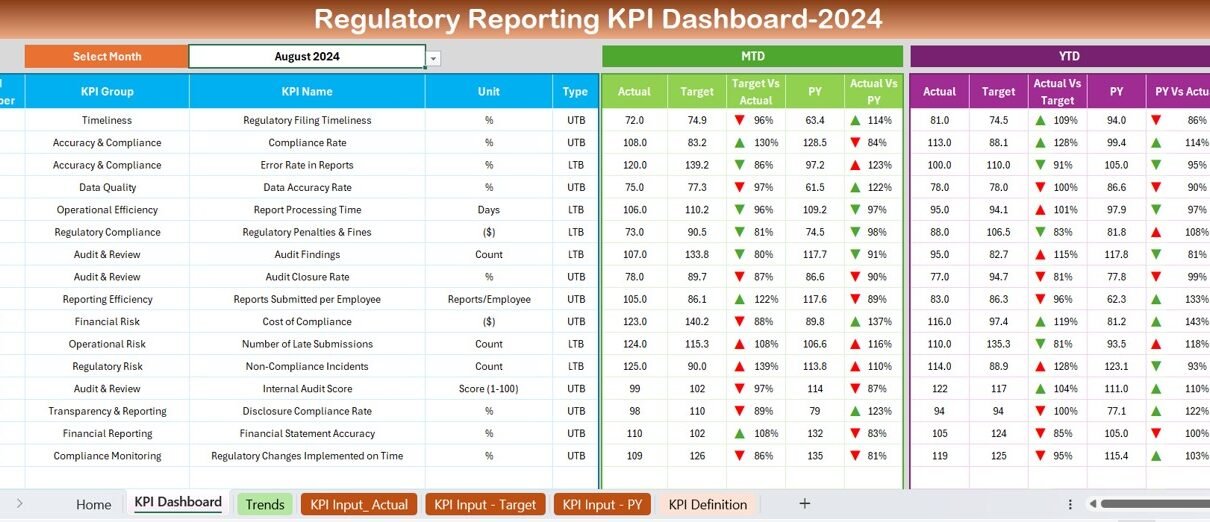
Dashboard Sheet
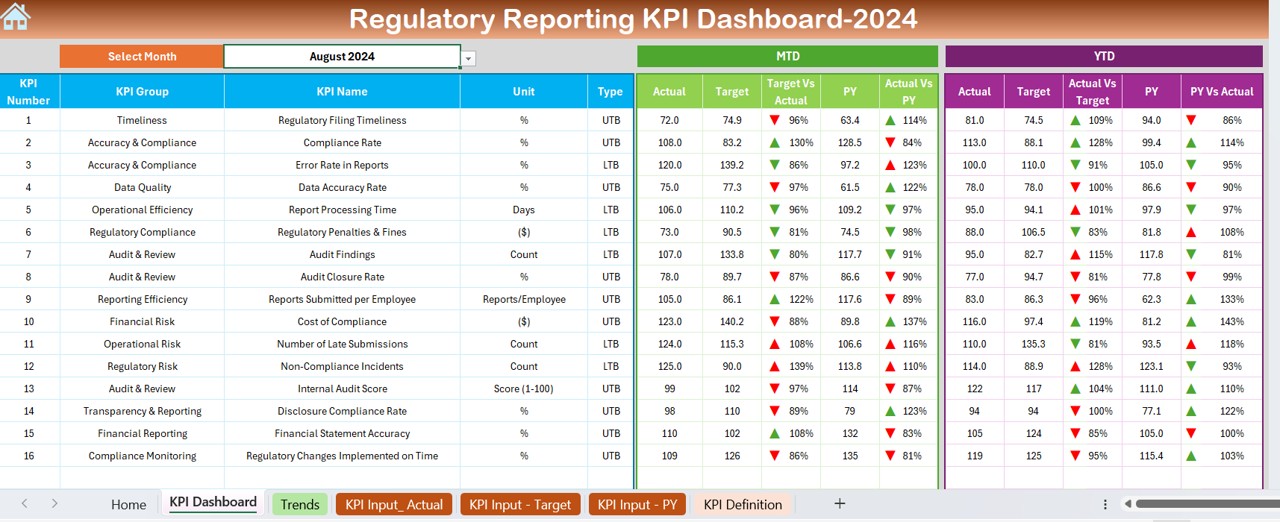
- This is the main reporting interface where all KPIs are displayed. The dashboard offers:
- A drop-down selector (Cell D3) to choose a specific month.
- Month-to-Date (MTD) and Year-to-Date (YTD) Actuals, Targets, and Previous Year Data.
- Variance Analysis that highlights the difference between actual vs. target values and previous year vs. current year.
- Conditional Formatting using arrows to indicate performance trends (up or down), making it easy to interpret the data at a glance.
KPI Trend Sheet
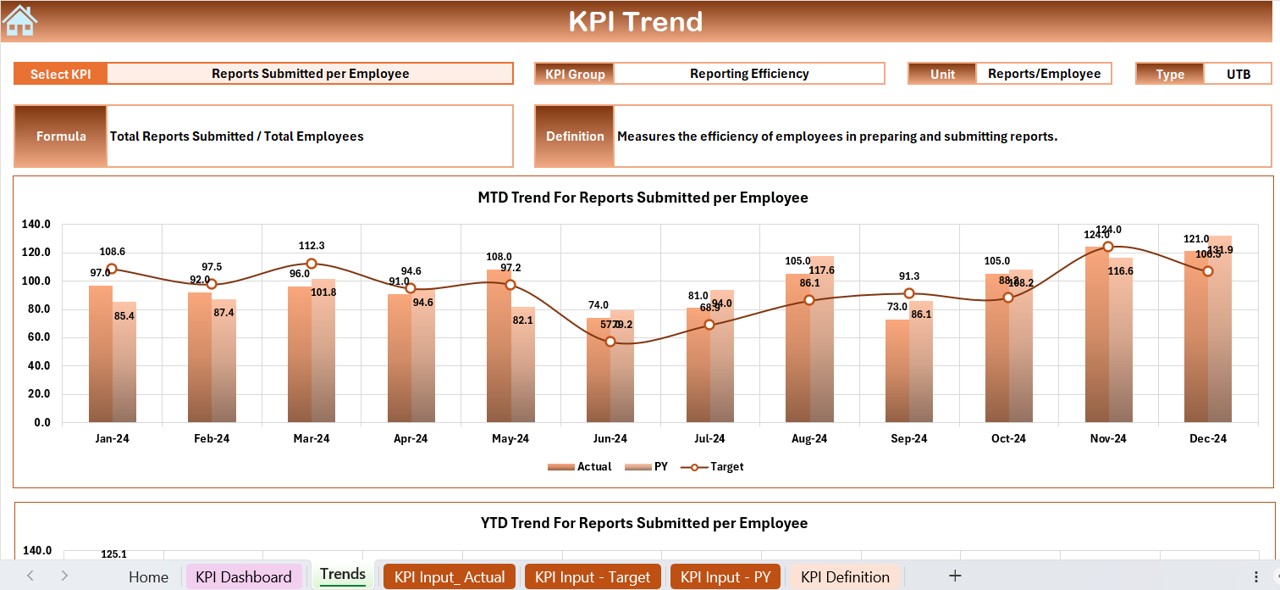
- This sheet provides a detailed analysis of each KPI’s trend over time:
- A drop-down menu (Cell C3) to select a KPI.
- Displays KPI Group, Unit, Type (Lower is Better / Upper is Better), KPI Formula, and Definition.
- MTD and YTD Trend Charts that help visualize KPI progress over time.
Click to buy Regulatory Reporting
Actual Numbers Input Sheet
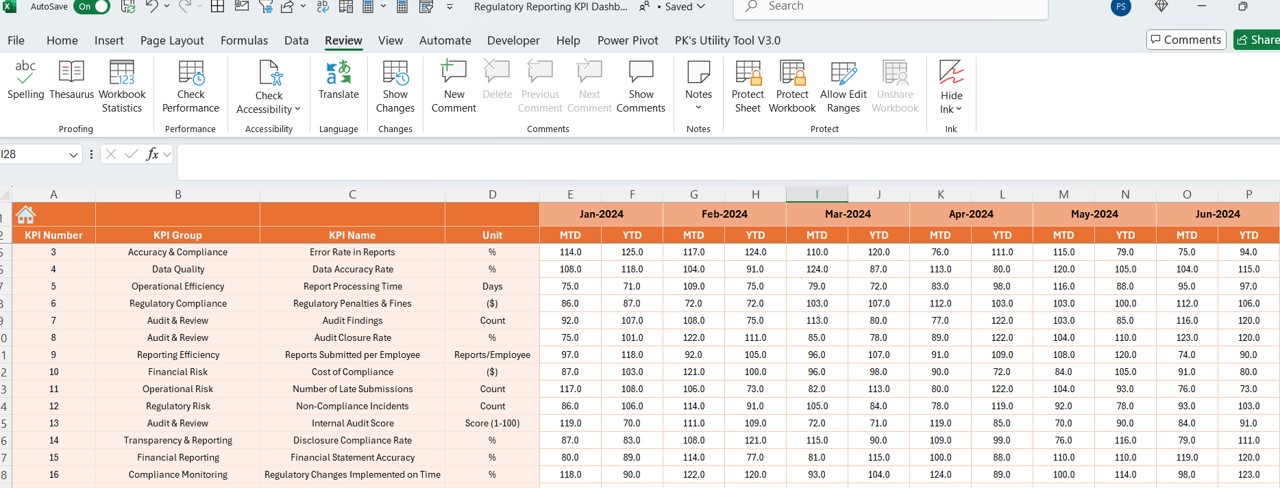
- This sheet is where you enter actual KPI values for each month:
- A month selector (Cell E1) that updates the data entry fields automatically.
- Input MTD and YTD actual values to ensure accurate reporting.
Target Sheet
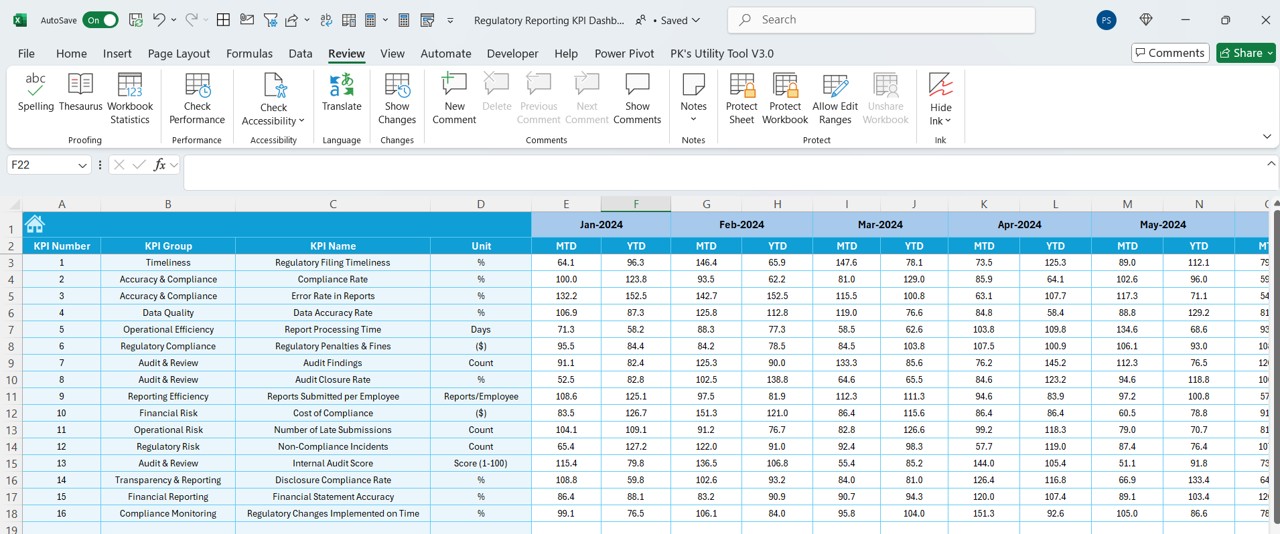
- This sheet is specifically designed for entering monthly target values for each KPI:
- Separate columns for MTD and YTD targets.
- Helps compare actual performance against predefined goals.
Previous Year Data Sheet
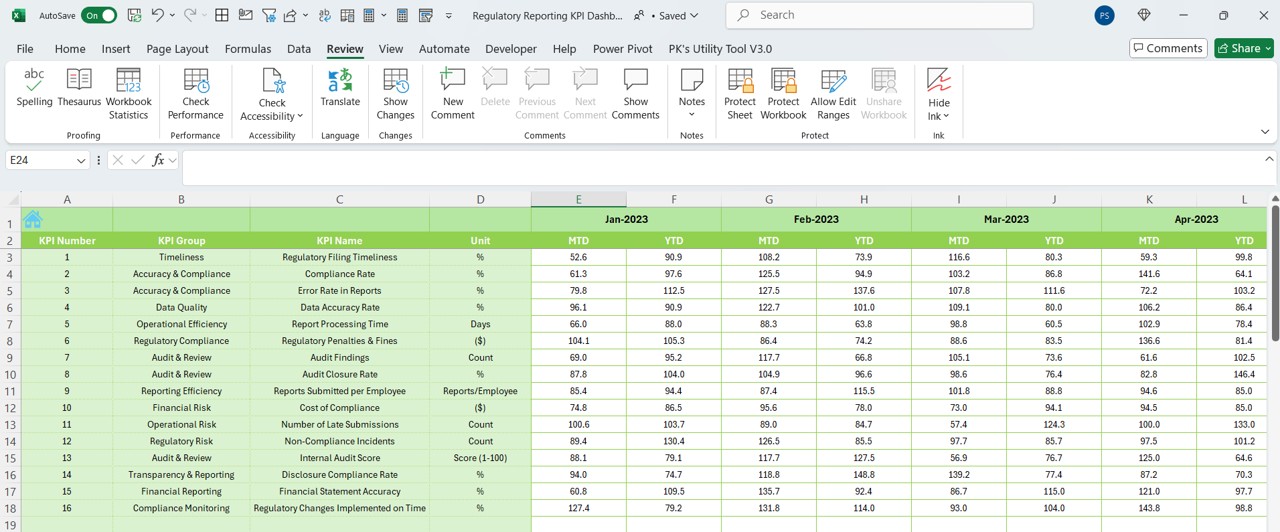
- This sheet stores KPI data from the previous year:
- Useful for comparative analysis, allowing users to track performance over time.
KPI Definition Sheet
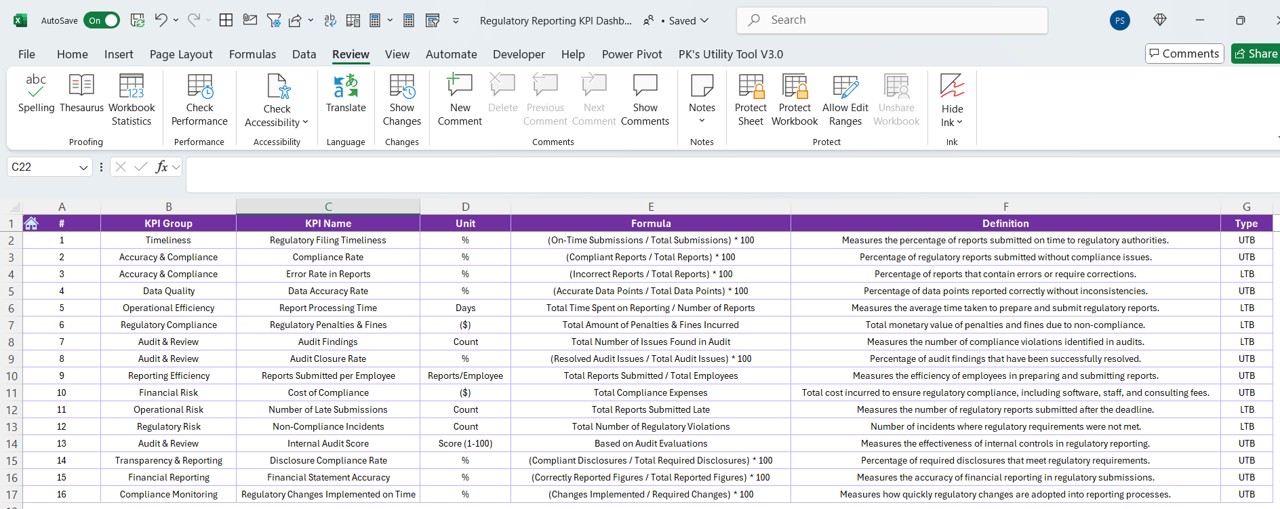
- This sheet acts as a KPI database, storing essential details such as:
- KPI Name, Group, Unit, Formula, and Definition.
- Ensures consistency in reporting and KPI calculations.
Advantages of Using the Regulatory Reporting KPI Dashboard
Better Compliance Tracking
- Helps businesses ensure they meet industry regulations.
- Provides real-time data visibility for audits and regulatory reviews.
Increased Data Accuracy
- Reduces manual errors with structured data entry.
- Automated calculations ensure reliable reporting.
Saves Time and Boosts Efficiency
- Pre-designed formulas eliminate manual calculations.
- Users can generate reports instantly with updated KPI metrics.
Easy-to-Understand Data Visualization
- Charts and conditional formatting highlight trends and discrepancies.
- Makes decision-making more straightforward and data-driven.
Fully Customizable and Scalable
- The dashboard can be adapted to suit different business needs.
- New KPIs can be added as requirements evolve.
Best Practices for Using the Regulatory Reporting KPI Dashboard
To get the most out of this dashboard, it’s important to follow these best practices:
- Keep Your Data Updated: Regularly update actual numbers, targets, and previous year data to maintain accuracy.
- Ensure Data Consistency: Always verify data formats before entering them into the sheets.
- Understand KPI Definitions: Clearly define each KPI to prevent misinterpretation.
- Use Conditional Formatting Effectively: Apply color codes and trend indicators to make data interpretation easier.
- Automate Where Possible: Utilize Excel formulas and macros to minimize manual work and improve efficiency.
Conclusion
Click to buy Regulatory Reporting
A Regulatory Reporting KPI Dashboard in Excel is a powerful tool that enables organizations to track compliance-related KPIs in a structured and visual manner. By leveraging this dashboard, businesses can improve data accuracy, streamline reporting, and enhance compliance monitoring. By following best practices, users can maximize the efficiency of this tool and make regulatory reporting seamless and stress-free.
Frequently Asked Questions (FAQs)
What is a Regulatory Reporting KPI Dashboard?
A Regulatory Reporting KPI Dashboard is an Excel-based tool designed to track, analyze, and report compliance-related KPIs. It helps businesses monitor key metrics to ensure regulatory adherence and improve operational efficiency.
How does this dashboard help in compliance monitoring?
This dashboard provides real-time tracking of regulatory KPIs, making it easier to identify issues and take corrective actions. It also includes historical data comparison for deeper insights.
Can I customize the dashboard for my organization?
Yes! The dashboard is fully customizable. You can add new KPIs, modify formulas, and update charts to align with your organization’s reporting needs.
What kind of KPIs can be tracked using this dashboard?
This dashboard can track a variety of regulatory KPIs, including financial compliance, risk assessment, operational efficiency, and legal adherence metrics.
Is this dashboard suitable for small businesses?
Absolutely! Whether you run a small business or a large corporation, this dashboard simplifies KPI tracking and regulatory reporting for all organizations.
How often should I update the dashboard?
For the best results, update the dashboard monthly or quarterly, depending on your reporting cycle. Keeping it up to date ensures better accuracy and decision-making.
Click to buy Regulatory Reporting
Visit our YouTube channel to learn step-by-step video tutorials
View this post on Instagram
Click to buy Regulatory Reporting