Managing renewable resources efficiently is crucial for businesses aiming to optimize sustainability and energy usage. A Renewable Resource KPI Dashboard in Excel provides a comprehensive solution for tracking key performance indicators (KPIs) and analyzing trends to make informed decisions. This article will walk you through everything you need to know about the Renewable Resource KPI Dashboard, its features, advantages, best practices, and frequently asked questions.
Click to Renewable Resource KPI
What is a Renewable Resource KPI Dashboard in Excel?
A Renewable Resource KPI Dashboard is an Excel-based tool designed to monitor and measure sustainability metrics. It helps businesses track energy efficiency, carbon footprint, water usage, and other key metrics related to renewable resources.
Key Features of the Renewable Resource KPI Dashboard:
This ready-to-use template consists of seven worksheets, each serving a specific purpose:
Home Sheet
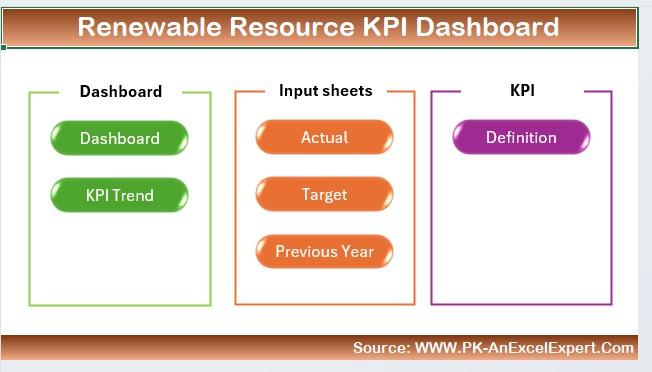
- Acts as an index page with six buttons for quick navigation to respective sheets.
- Enhances user experience with easy access to different sections of the dashboard.
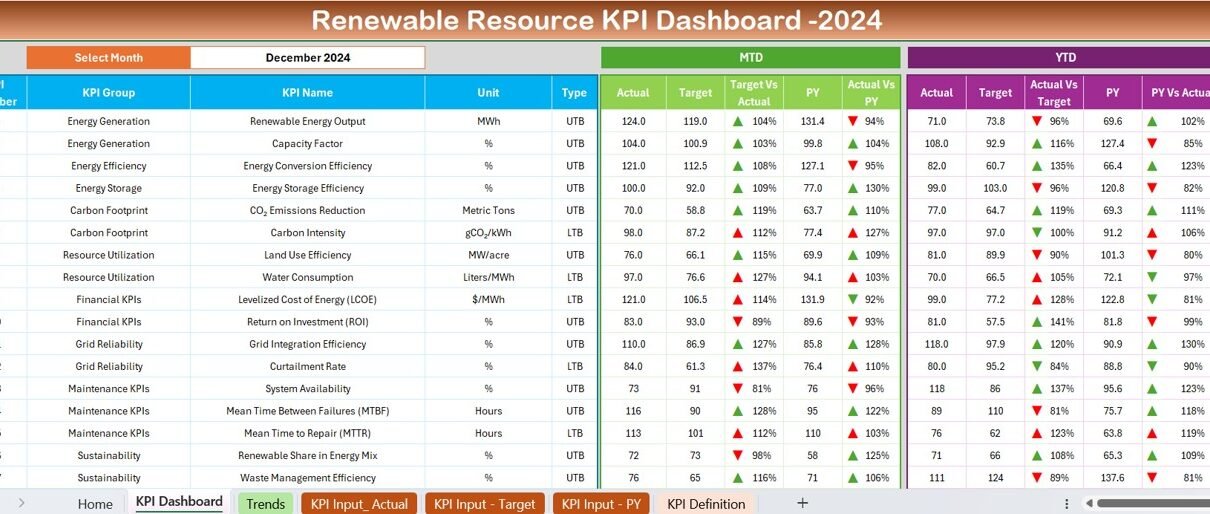
Dashboard Sheet Tab
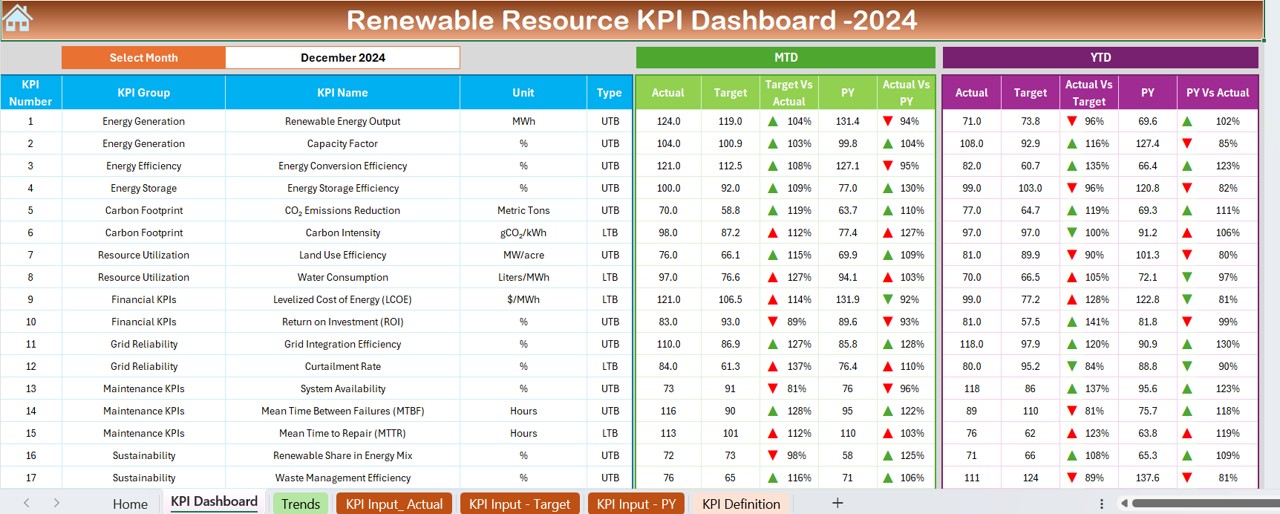
- The main dashboard displays all KPIs in a visually appealing format.
- Includes a drop-down menu in cell D3 to select the month, updating all metrics accordingly.
- Displays the following key data points:
- MTD (Month-to-Date) Actual, Target, Previous Year Data
- YTD (Year-to-Date) Actual, Target, Previous Year Data
- Target vs. Actual Comparison
- Conditional formatting with up/down arrows for trend analysis.
Click to Renewable Resource KPI
KPI Trend Sheet Tab
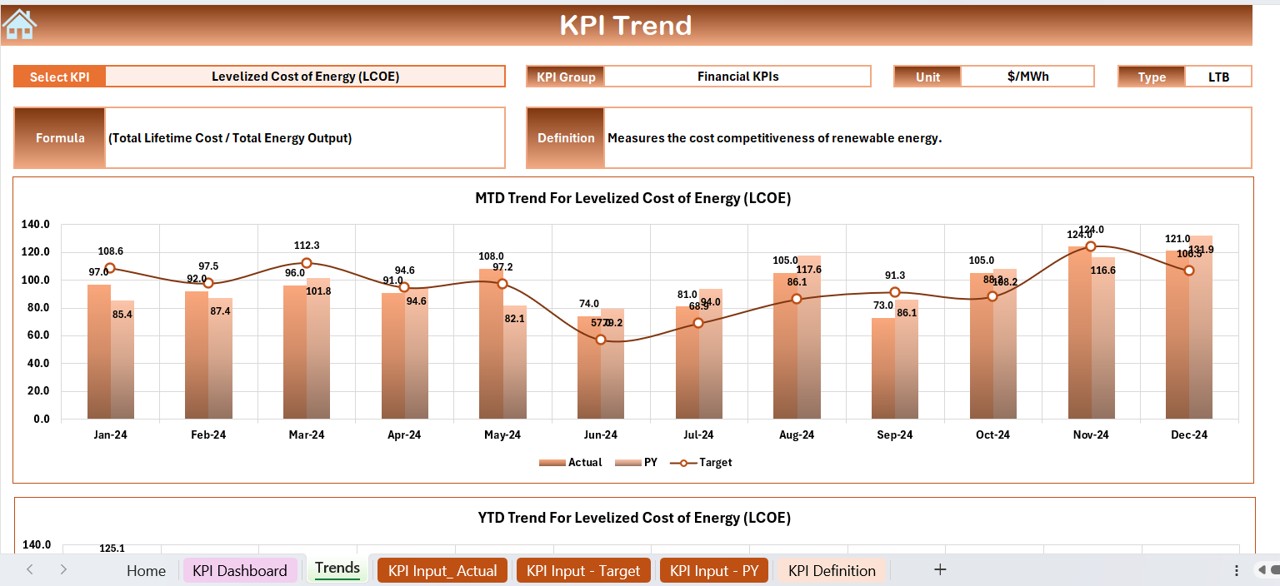
- Users can select a KPI from a drop-down list (cell C3).
- Displays KPI Group, Unit, Type (Lower or Upper the Better), Formula, and Definition.
- Includes MTD and YTD trend charts comparing Actual, Target, and Previous Year data.
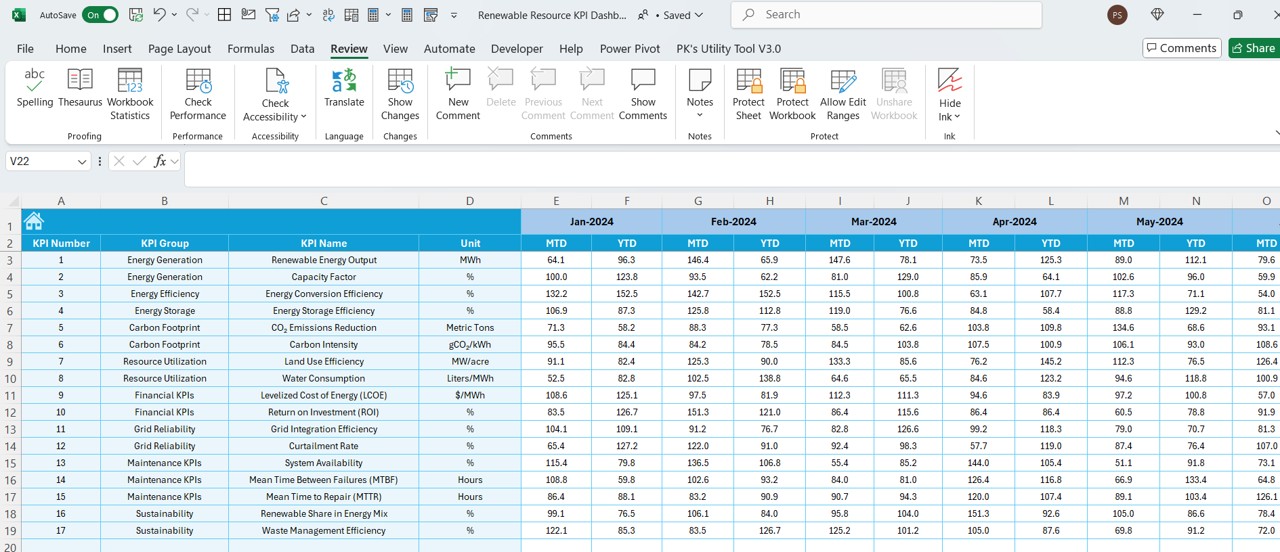
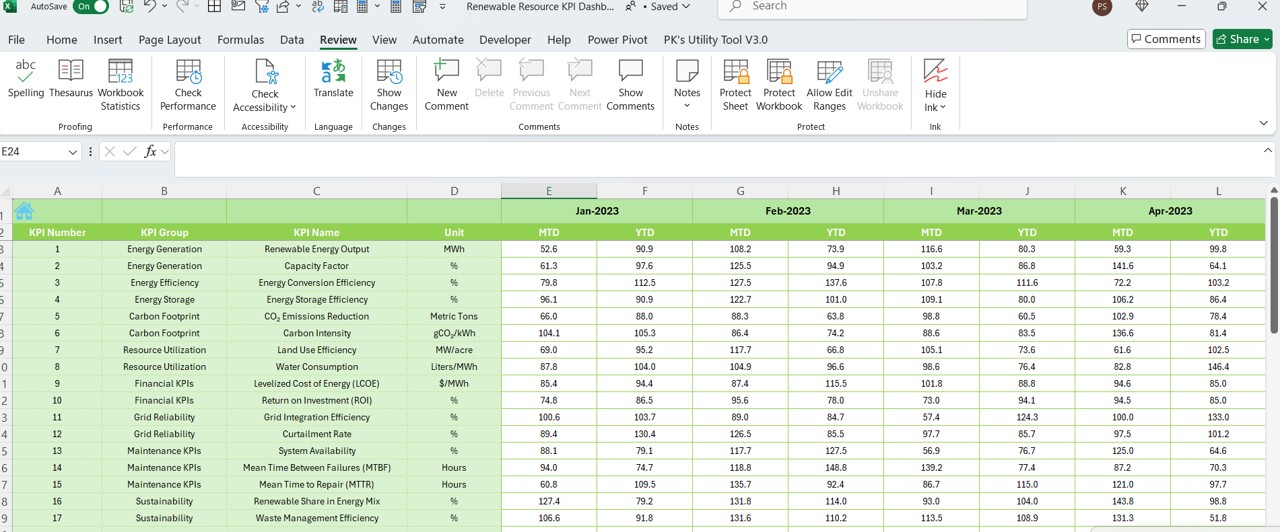
Actual Numbers Input Sheet
- Users input actual MTD and YTD values for a given month.
- The month selection is available in cell E1, automatically adjusting for the chosen year.
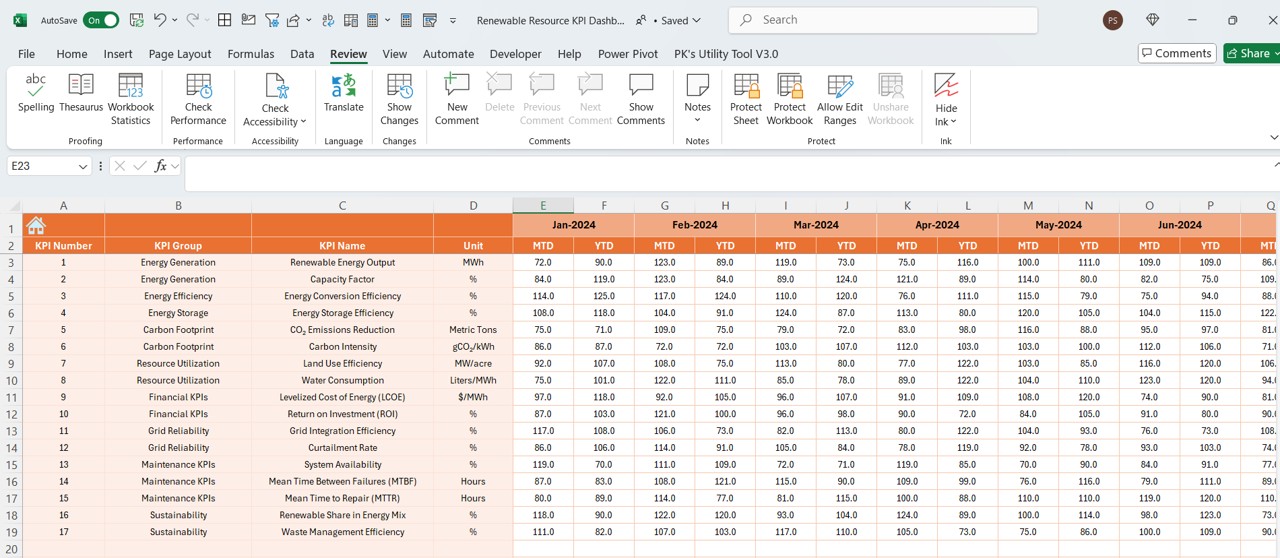
Target Sheet Tab
- Allows input of monthly target numbers for MTD and YTD.
- Ensures that performance comparisons are based on predefined targets.
Click to Renewable Resource KPI
Previous Year Number Sheet Tab
- Stores previous year’s performance data for historical comparison.
- Helps in trend analysis and year-over-year performance evaluation.
KPI Definition Sheet Tab
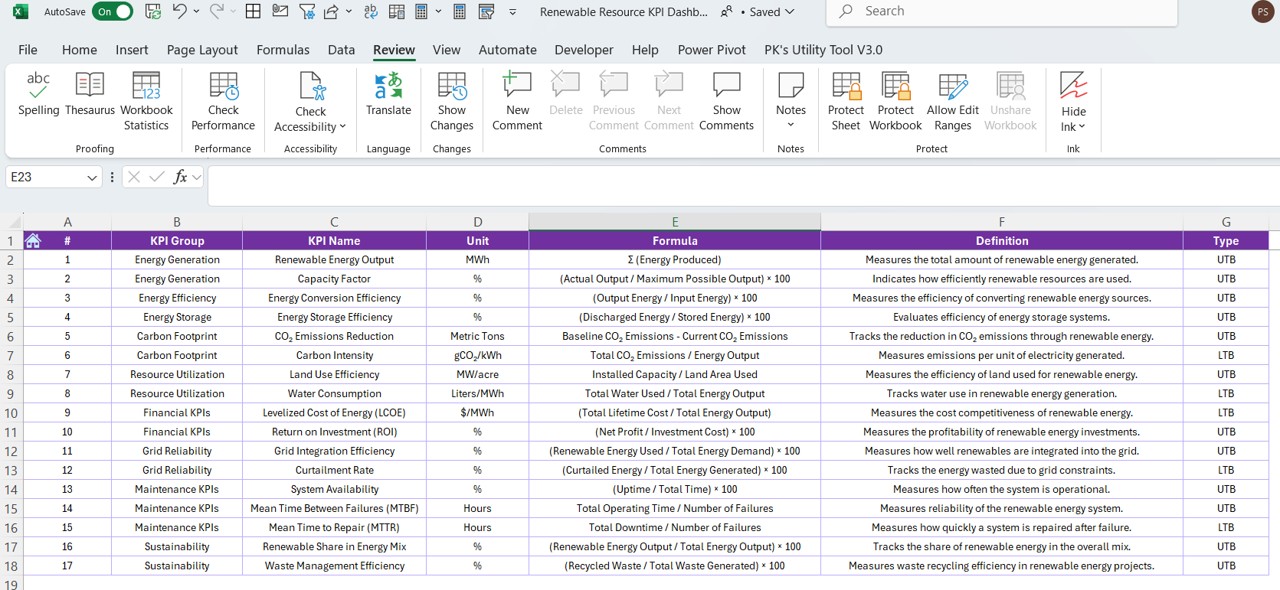
- Maintains a database of KPI names, groups, units, formulas, and definitions.
- Ensures that users have a clear understanding of each KPI’s role and calculation method.
Advantages of Using a Renewable Resource KPI Dashboard
Centralized Data Management
- Organizes all renewable resource KPIs in one place.
- Provides structured sheets for easy data entry and retrieval.
Real-Time Performance Tracking
- Automatically updates KPI performance when a new month is selected.
- Allows users to monitor progress against targets.
Data-Driven Decision Making
- Provides clear visualizations and trend analysis.
- Helps businesses optimize renewable resource usage and efficiency.
Customizable and Scalable
- Easily modified to include additional KPIs as needed.
- Suitable for small and large organizations tracking sustainability goals.
User-Friendly Interface
- No advanced Excel skills required.
- Pre-built drop-down menus, conditional formatting, and charts simplify analysis.
Click to Renewable Resource KPI
Best Practices for Using the Renewable Resource KPI Dashboard
Ensure Data Accuracy
- Regularly update actual numbers, targets, and historical data.
- Cross-check formulas to avoid errors in calculations.
Set Realistic Targets
- Use past trends to establish achievable KPI goals.
- Regularly review and adjust targets based on business needs.
Utilize Conditional Formatting
- Use color-coded indicators to highlight performance trends.
- Implement arrows and bars to visually display positive and negative changes.
Monitor KPI Trends
- Analyze MTD and YTD trends to identify areas for improvement.
- Compare actual performance with targets and previous year’s data.
Regularly Review and Optimize
- Conduct periodic reviews of dashboard insights.
- Implement strategies to enhance sustainability based on KPI trends.
Conclusion
A Renewable Resource KPI Dashboard in Excel is a powerful tool for businesses looking to track and optimize their sustainability efforts. With its structured approach, real-time updates, and easy-to-use interface, it ensures organizations can make data-driven decisions. By following best practices and ensuring data accuracy, users can maximize the dashboard’s effectiveness in achieving sustainability goals.
Frequently Asked Questions (FAQs)
What are the key KPIs tracked in the Renewable Resource KPI Dashboard?
The dashboard tracks KPIs such as energy consumption, carbon footprint, water usage, waste management efficiency, and renewable energy generation.
Can I customize the dashboard to include additional KPIs?
Yes, the KPI Definition Sheet allows users to add new KPIs, define formulas, and categorize metrics according to business needs.
Is this dashboard suitable for large organizations?
Absolutely! The scalable structure allows both small businesses and large enterprises to track renewable resource KPIs effectively.
How often should I update the dashboard?
It is recommended to update the dashboard monthly by inputting actual values and reviewing performance trends.
Does the dashboard support automation?
While the template is Excel-based, advanced users can integrate VBA or Power BI for automation and enhanced reporting.
Click to Renewable Resource KPI
Visit our YouTube channel to learn step-by-step video tutorials
View this post on Instagram