In today’s competitive retail environment, monitoring store foot traffic is crucial. Analyzing footfall data helps retailers improve customer experience, optimize staffing, and maximize sales. Retail Foot Traffic KPI Dashboard in Excel is a powerful tool designed to help retailers track key metrics efficiently.
This dashboard provides a ready-to-use template for retail businesses, offering in-depth insights into customer visits and foot traffic trends. Whether you are a store manager, retail analyst, or business owner, this dashboard simplifies KPI tracking and enhances data-driven decision-making.
In this article, we will explore the features, advantages, best practices, and frequently asked questions about the Retail Foot Traffic KPI Dashboard in Excel.
Click to Retail Foot Traffic KPI
Key Features of the Retail Foot Traffic KPI Dashboard
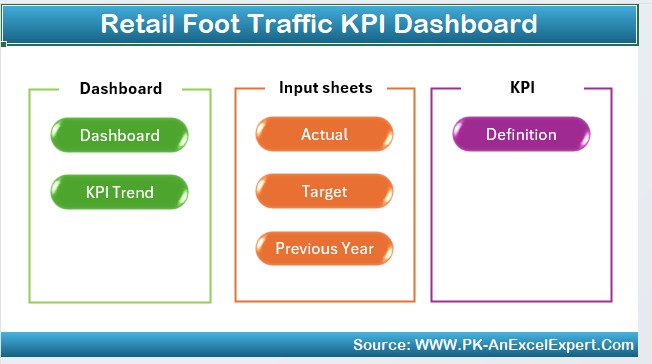
This KPI dashboard includes seven powerful worksheets that allow users to track and analyze foot traffic metrics in real time.
Home Sheet
- Acts as the main navigation panel for the dashboard.
- Includes six interactive buttons that allow users to jump directly to specific worksheets.
- Provides an easy-to-use interface for seamless navigation.
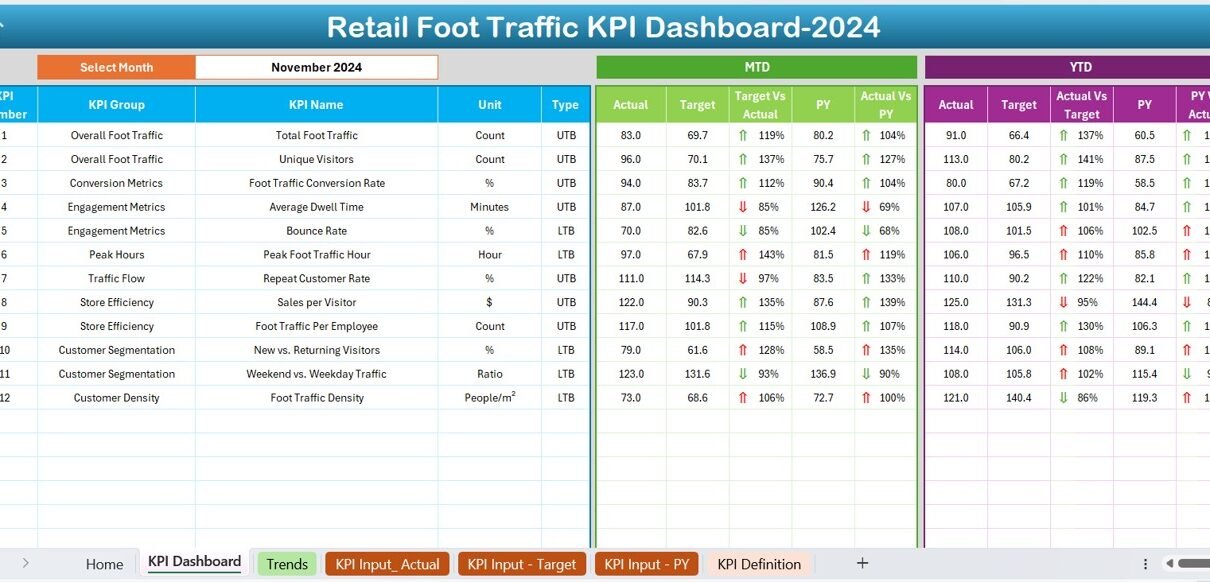
Dashboard Sheet Tab
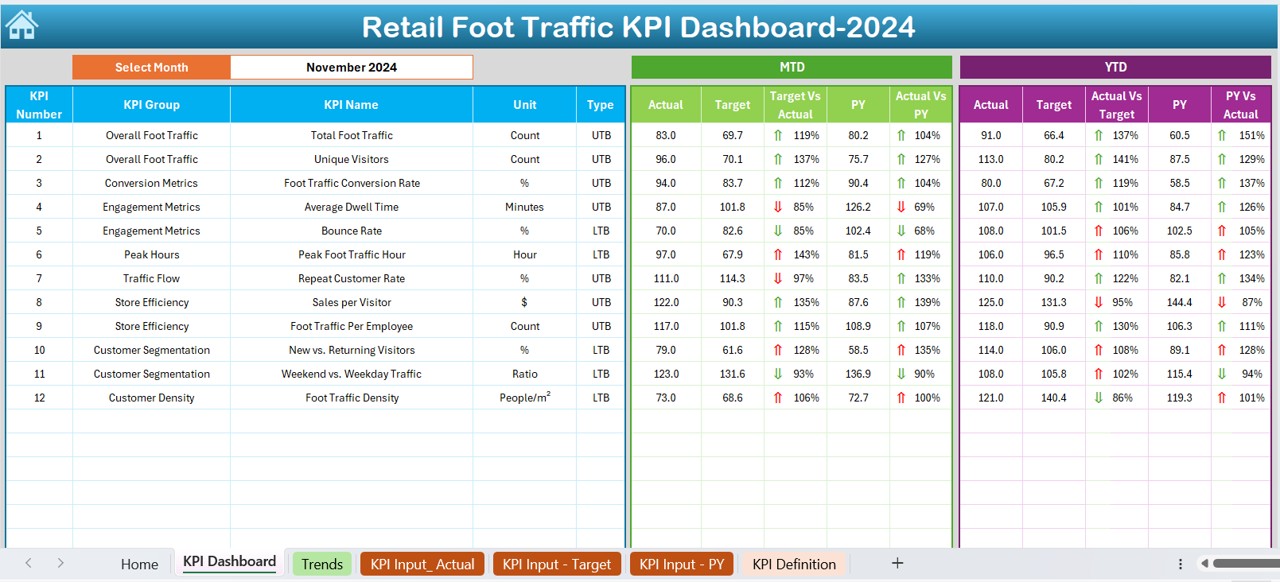
The core section where all KPI data is displayed.
- Users can select a month from a drop-down list at cell D3, and the entire dashboard updates accordingly.
- Shows Month-to-Date (MTD) and Year-to-Date (YTD) data for:
- Actual foot traffic
- Target numbers
- Previous year data
- Target vs. Actual comparison
- Previous Year vs. Actual comparison
- Uses conditional formatting with up/down arrows to visually indicate performance trends.
Click to Retail Foot Traffic KPI
KPI Trend Sheet Tab
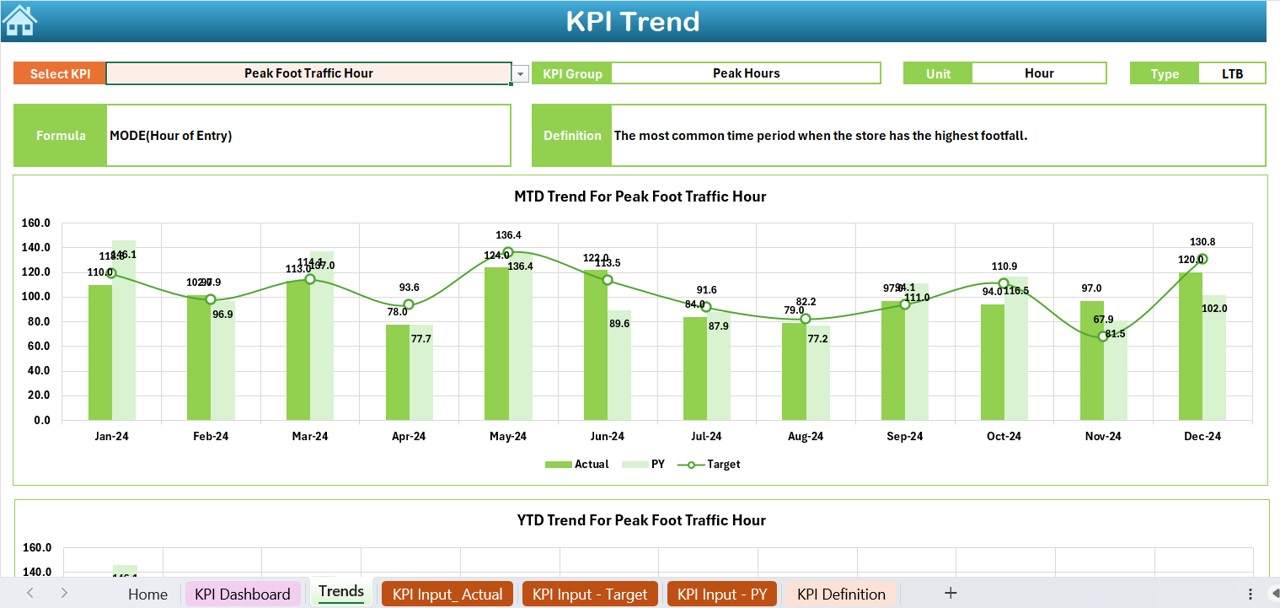
Users can select a KPI from the drop-down list in C3.
Displays:
- KPI Group
- KPI Unit
- Type of KPI (Lower is Better or Upper is Better)
- KPI Formula
- KPI Definition
- Includes MTD and YTD trend charts for Actual, Target, and Previous Year values.
Click to Retail Foot Traffic KPI
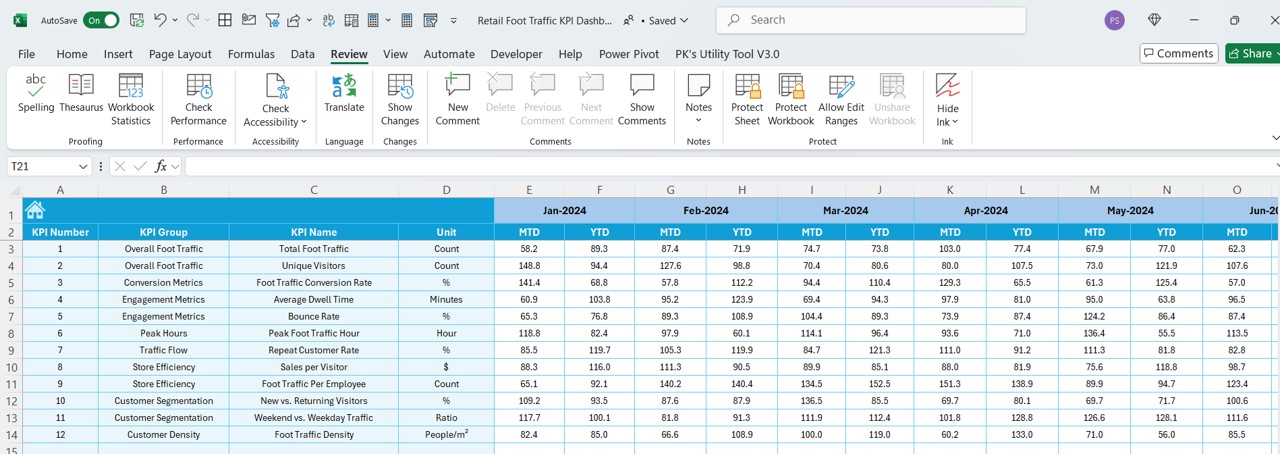
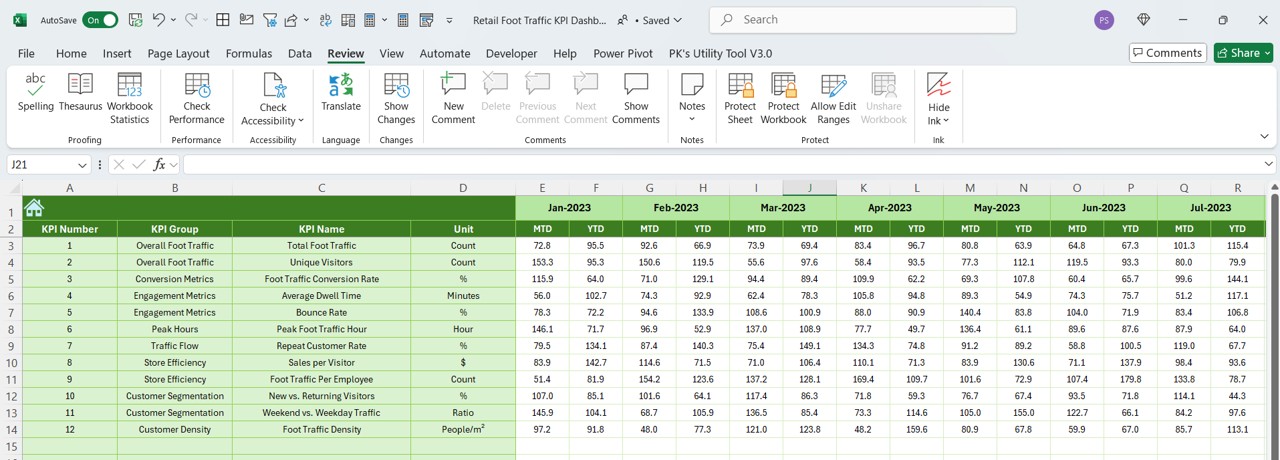
Actual Numbers Input Sheet
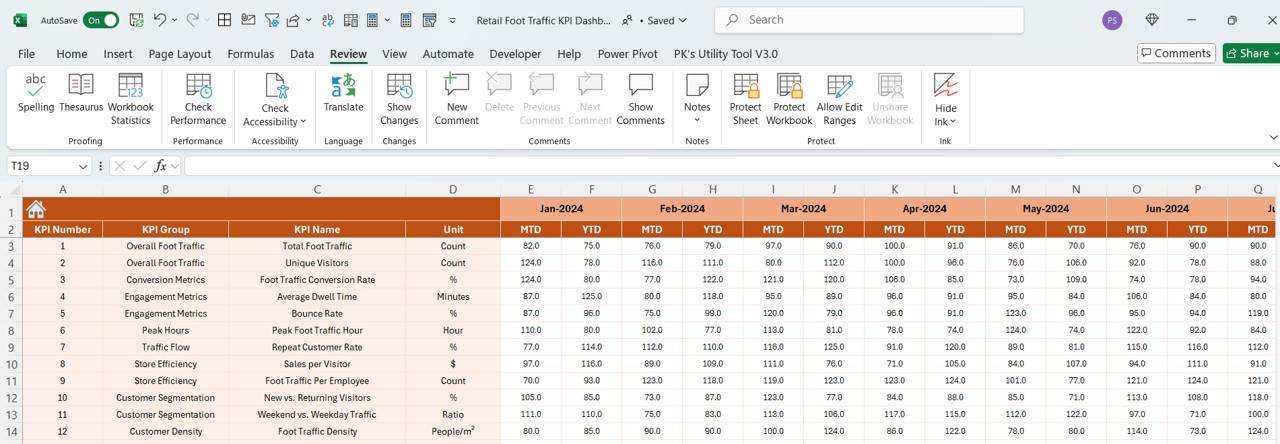
- Users manually input the actual foot traffic numbers.
- Allows selection of the first month of the year in E1, automatically adjusting months accordingly.
- Ensures accurate data entry for tracking KPI performance.
Target Sheet Tab
- Allows users to input the target foot traffic numbers for:
- Monthly (MTD) goals
- Yearly (YTD) targets
- Helps in comparing goals vs. actual performance.
Previous Year Numbers Sheet Tab
- Stores historical foot traffic data from the previous year.
- Enables users to compare trends across different time periods.
- Facilitates performance benchmarking.
KPI Definition Sheet Tab
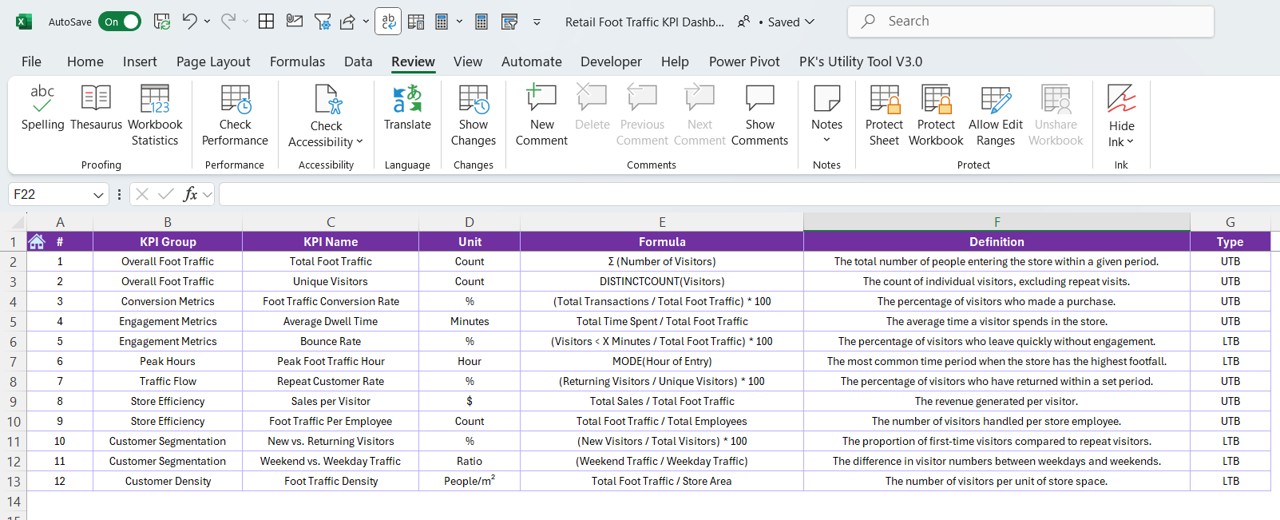
- Users can enter detailed information about each KPI, including:
- KPI Name
- KPI Group
- Unit
- Formula
- Definition
- Provides a structured reference for all KPIs included in the dashboard.
Click to Retail Foot Traffic KPI
Advantages of Using the Retail Foot Traffic KPI Dashboard
- Improves Business Decision-Making: Tracking foot traffic trends helps identify peak hours, seasonal patterns, and sales-driving factors, enabling better business decisions.
- Enhances Store Performance Monitoring: With real-time KPI tracking, store managers can adjust staffing, marketing efforts, and promotional campaigns for maximum impact.
- Easy Visualization of Data: The interactive charts and conditional formatting make data interpretation quick and easy, helping users spot trends instantly.
- Streamlines Data Entry and Reporting: With structured worksheets, the dashboard simplifies manual data entry and automates reporting, saving time and reducing errors.
- Facilitates Goal Setting and Performance Comparison: The ability to compare actual performance against targets and previous year data helps in setting realistic goals and tracking progress effectively.
- Customizable and Scalable: This Excel-based dashboard can be modified to include additional KPIs or data points, making it adaptable to different retail business needs.
Best Practices for Using the Retail Foot Traffic KPI Dashboard
Ensure Regular Data Entry
- Enter actual numbers on a daily or weekly basis to keep the dashboard updated.
- Avoid missing data points, as it can impact trend analysis.
Analyze Trends Frequently
- Monitor MTD and YTD trends to identify patterns.
- Use insights from trend analysis to optimize store operations.
Compare Foot Traffic with Sales Data
- Evaluate whether higher foot traffic leads to increased sales.
- Identify factors that influence conversion rates.
Utilize Conditional Formatting Alerts
- Pay attention to the up/down arrows that indicate performance shifts.
- Investigate causes for underperformance and take corrective actions.
Customize the Dashboard for Your Business Needs
- Modify KPI definitions, formulas, and reporting structures to align with your specific retail store requirements.
Leverage Historical Data for Strategic Planning
- Use previous year data for year-over-year performance comparisons.
- Plan marketing and promotional activities based on historical trends.
Conclusion
The Retail Foot Traffic KPI Dashboard in Excel is a valuable tool for retailers looking to gain deeper insights into customer visits and improve store performance. With its user-friendly interface, automated calculations, and insightful visualizations, this dashboard simplifies KPI tracking and enables data-driven decision-making.
Click to Retail Foot Traffic KPI
Frequently Asked Questions (FAQs)
What is the purpose of the Retail Foot Traffic KPI Dashboard?
This dashboard helps retailers track foot traffic trends, compare actual vs. target data, and analyze customer visit patterns to improve business operations.
Can I customize the KPIs in this dashboard?
Yes, the dashboard is fully customizable. You can add, modify, or remove KPIs based on your specific retail business requirements.
How often should I update the dashboard?
For accurate analysis, update the dashboard daily or weekly with actual foot traffic numbers.
What insights can I gain from this dashboard?
It provides insights into peak foot traffic hours, sales conversion rates, seasonal trends, and store performance comparisons.
Is Excel the best tool for tracking retail foot traffic KPIs?
Excel is a cost-effective and flexible tool for tracking KPIs. However, for large-scale retail chains, integrating Excel with BI tools like Power BI may be more effective.
Can I use this dashboard for multiple store locations?
Yes, you can modify the dashboard to track multiple store locations by adding additional worksheets and data columns.
How does this dashboard help in staff management?
By identifying peak foot traffic hours, store managers can optimize staff scheduling and ensure better customer service.
Does the dashboard support automated data updates?
The default version requires manual data entry, but it can be enhanced with VBA or Power Query to fetch real-time data.
Can I track foot traffic by different customer segments?
Yes, you can modify the dashboard to categorize foot traffic by demographics, time of day, or promotional campaigns.
Where can I download this Retail Foot Traffic KPI Dashboard?
You can download this Retail Foot Traffic KPI Dashboard in Excel from our website.
Click to Retail Foot Traffic KPI
Visit our YouTube channel to learn step-by-step video tutorials