In the fast-paced world of retail, data-driven decision-making is crucial. One of the most effective ways to monitor your store’s performance is by using a Retail KPI Dashboard. This powerful tool helps track key metrics that influence profitability, efficiency, and customer satisfaction. In this article, we’ll dive deep into the concept of a Retail KPI Dashboard, its advantages, best practices, and areas for improvement, along with frequently asked questions. By the end, you’ll have a complete understanding of how to use this dashboard to elevate your retail business.
What is a Retail KPI Dashboard?
A Retail KPI Dashboard is a tool designed to monitor key performance indicators (KPIs) specific to the retail industry. These KPIs include metrics related to sales, inventory, customer satisfaction, employee performance, and more. By using this dashboard, retail businesses can measure their success, identify areas for improvement, and make informed decisions.
The dashboard centralizes all the important metrics, making it easy to track and compare performance over time. Instead of juggling multiple reports, a Retail KPI Dashboard provides an at-a-glance overview of how your business is performing across different dimensions.
Key Features of the Retail KPI Dashboard
In this section, we’ll explore the key features that make this dashboard an invaluable tool for retail businesses. Whether you’re a store manager, owner, or analyst, these features ensure that your KPIs are always at your fingertips.
-
Home Sheet
The home sheet acts as the central hub of the dashboard. It contains buttons that let you navigate to various parts of the dashboard quickly. From here, you can jump to different sections, such as the dashboard view, trend analysis, and data entry sheets. It simplifies the navigation process and enhances the user experience.

Click to buy Retail KPI Dashboard In Excel
-
Dashboard Sheet
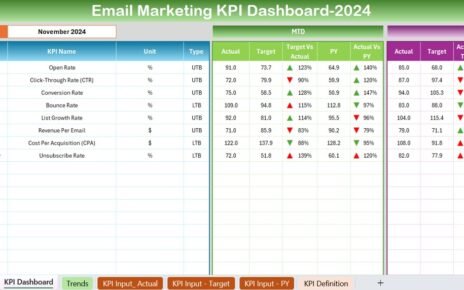
The Dashboard Sheet is where the magic happens. This is the main display of all your retail KPIs. You can select the specific month you want to analyze using a drop-down in cell D3. Once selected, all the data in the dashboard will automatically update to show Month-to-Date (MTD) and Year-to-Date (YTD) metrics.
The dashboard shows:
MTD Actual vs Target: A comparison of the actual numbers for the month against the target values, highlighting where performance exceeds or falls short.
Previous Year Comparison: Conditional formatting and up/down arrows make it easy to spot trends compared to the previous year.
YTD Performance: A similar comparison but for the year to date, providing a broader view of performance.

Click to buy Retail KPI Dashboard In Excel
-
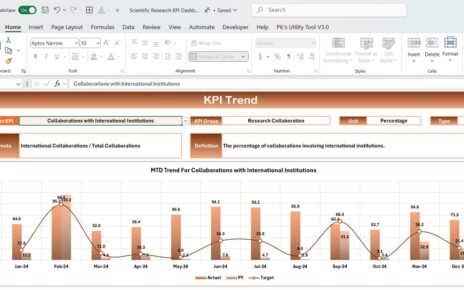
KPI Trend Sheet
This sheet allows you to track trends over time for specific KPIs. Select a KPI from the dropdown, and the sheet will display the KPI group, unit of measurement, type (whether a higher or lower value is better), and a formula for calculating the KPI. It’s a helpful tool for understanding how individual metrics are trending and if they are contributing positively to overall business goals.

Click to buy Retail KPI Dashboard In Excel
-
Actual Numbers Sheet
Here’s where you enter the actual numbers for your KPIs. The sheet allows you to input MTD and YTD figures for the selected month. The drop-down in range E1 lets you choose the month, and based on this selection, you can input data for the corresponding KPIs. This data feeds directly into the dashboard, updating it with the latest performance data.

Click to buy Retail KPI Dashboard In Excel
-
Target Numbers Sheet
The target sheet is where you set your performance goals for each KPI, both MTD and YTD. By establishing these benchmarks, you create clear objectives for your team and can easily monitor how well they are meeting these targets.

Click to buy Retail KPI Dashboard In Excel
-
Previous Year Numbers Sheet
Comparing the current year’s performance to the previous year is a powerful way to assess growth or decline. In this sheet, you enter the previous year’s numbers to allow the dashboard to make year-on-year comparisons.

Click to buy Retail KPI Dashboard In Excel
-
KPI Definition Sheet
This sheet serves as a reference guide for all the KPIs in your dashboard. It includes the name of each KPI, the group it belongs to, the unit of measurement, its formula, and a detailed definition. Having this information readily available ensures that everyone understands what each KPI measures and why it’s important.

Click to buy Retail KPI Dashboard In Excel
Advantages of a Retail KPI Dashboard
The Retail KPI Dashboard offers numerous benefits that help retail businesses succeed in today’s competitive market. Let’s break down some of the top advantages.
- Centralized Data Tracking: All your key retail metrics are in one place, making it easy to track performance without navigating multiple reports.
- Real-Time Insights: Get up-to-the-minute data on how your store is performing, allowing for quick decisions and adjustments.
- Improved Decision-Making: With data-driven insights at your fingertips, you can make informed decisions that positively impact your business’s bottom line.
- Increased Efficiency: The dashboard automates data collection and organization, saving time and reducing the likelihood of errors from manual data entry.
Best Practices for Using a Retail KPI Dashboard
To get the most out of your Retail KPI Dashboard, consider these best practices:
- Set Clear KPIs: It’s essential to select KPIs that align with your business goals. For example, tracking customer satisfaction is vital for improving the in-store experience, while inventory turnover helps you monitor stock efficiency.
- Update Data Regularly: Your dashboard is only as good as the data it contains. Ensure that actual, target, and previous year’s data are updated frequently to maintain accuracy.
- Use Conditional Formatting: Utilize conditional formatting for visual cues like arrows, color changes, or bolded text. This makes it easy to identify areas of concern at a glance.
- Monitor Trends, Not Just the Moment: Trends over time tell a more comprehensive story than point-in-time metrics. Use the KPI Trend Sheet to analyze long-term performance rather than focusing solely on monthly data.
Opportunities for Improvement in the Retail KPI Dashboard
While the Retail KPI Dashboard is a powerful tool, there’s always room for improvement. Here are some ways you can enhance your dashboard’s functionality:
- Add Custom KPIs: Depending on the nature of your retail business, you might need custom KPIs. For example, a luxury retail store might track average transaction value more closely than a convenience store.
- Integrate with Other Tools: Integrating the KPI dashboard with other tools like POS systems or customer relationship management (CRM) software can help streamline data collection and improve accuracy.
- Automate Data Entry: To reduce manual data entry errors, consider using automation tools or importing data directly from your sales and inventory systems into the dashboard.
Conclusion
The Retail KPI Dashboard is a game-changer for retail businesses looking to improve performance, make data-driven decisions, and stay competitive. By offering real-time insights, easy data tracking, and valuable trend analysis, this tool provides all the essential metrics needed to run a successful retail operation.
By following the best practices outlined in this article and regularly updating your data, your business can enjoy the benefits of streamlined performance tracking and more effective decision-making.
Frequently Asked Questions (FAQs)
Q. What are the most important KPIs to track in retail?
The most critical KPIs include sales growth, customer satisfaction, inventory turnover, and employee performance. These KPIs provide a well-rounded view of your store’s health.
Q. How often should I update my KPI dashboard?
It’s best to update your dashboard at least weekly, though daily updates provide the most accurate and actionable insights.
Q. Can I customize the Retail KPI Dashboard for my specific store?
Yes, the dashboard is fully customizable. You can add or remove KPIs based on what’s important for your business and even create custom metrics specific to your retail niche.
Q. How can I automate data input into my Retail KPI Dashboard?
Automation tools like Zapier or direct integrations with your POS and inventory systems can pull data into your dashboard automatically, saving time and improving accuracy.
Q. Why should I compare performance against the previous year?
Year-over-year comparisons help identify trends and seasonal fluctuations, giving you a better understanding of how your business is growing and where improvements are needed.
Visit our YouTube channel to learn step-by-step video tutorials
Click to buy Retail KPI Dashboard In Excel