Managing and optimizing your SaaS renewal process is crucial for maximizing revenue and retaining customers. One of the best ways to streamline this process is by using a SaaS Renewal KPI Dashboard in Excel. This ready-to-use template allows you to track all essential KPIs, analyze trends, and make data-driven decisions.
In this article, we will discuss the features of the SaaS Renewal KPI Dashboard, its benefits, best practices, and a step-by-step guide to using it effectively. Let’s dive in!
Click to SaaS Renewal KPI
Key Features of the SaaS Renewal KPI Dashboard
This dashboard consists of seven worksheets, each designed for a specific purpose:
Home Sheet
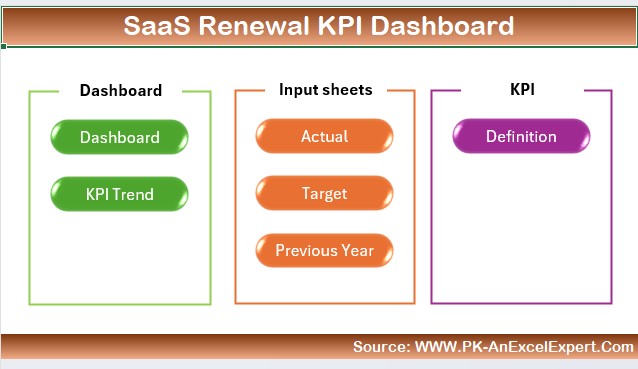
- The index sheet provides six quick-access buttons to navigate through the dashboard.
- Ensures an intuitive user experience with easy navigation.
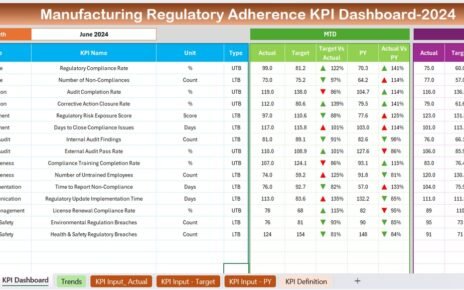
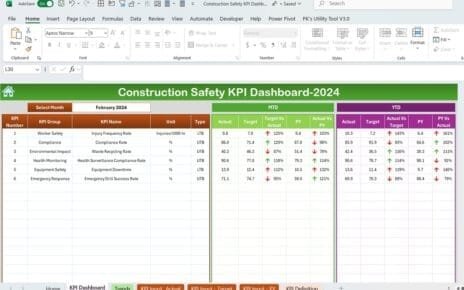
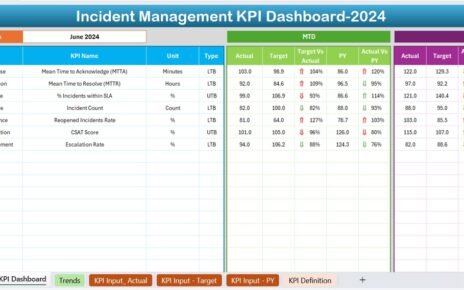
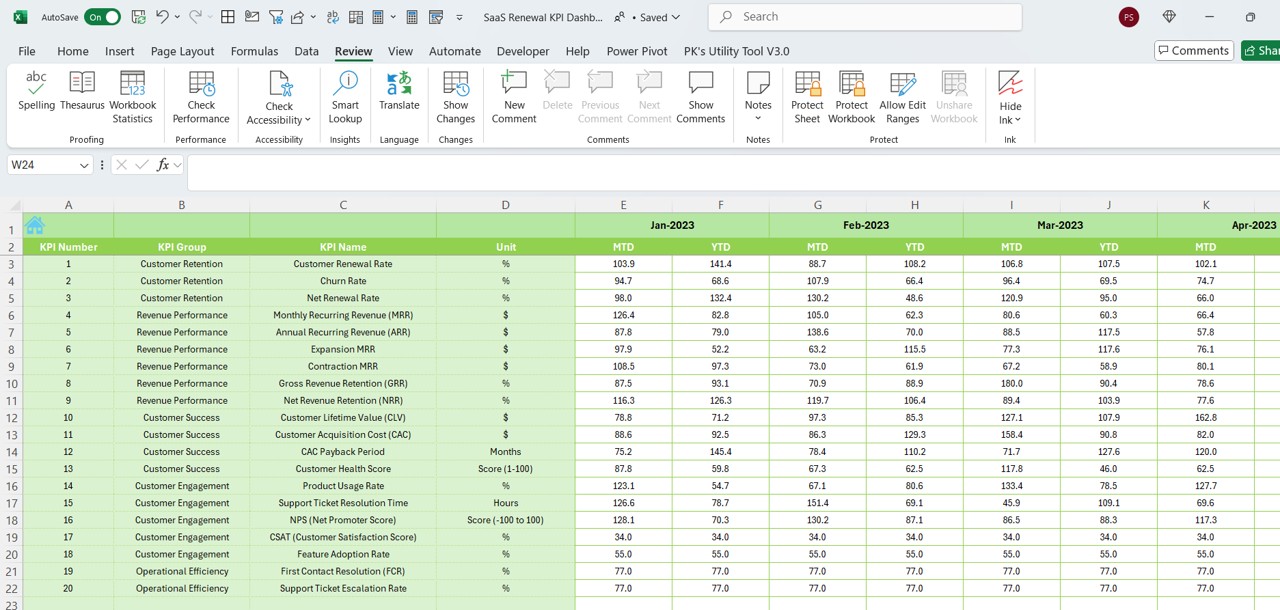
Dashboard Sheet Tab
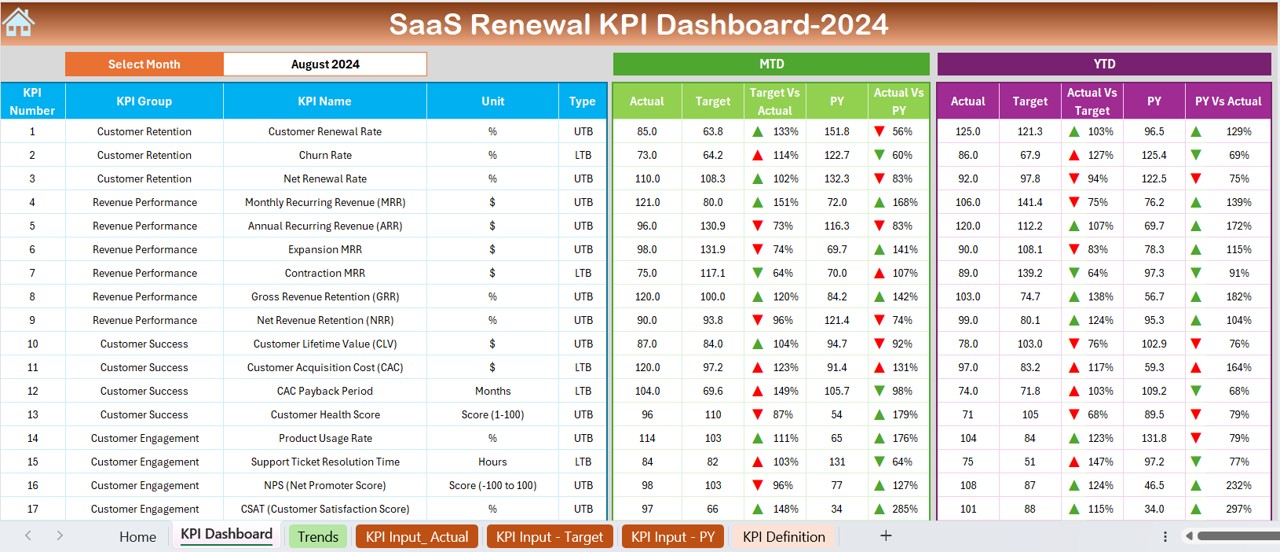
- The core sheet that displays all SaaS renewal KPIs.
- You can select the month from the drop-down in cell D3 to update all data dynamically.
- Shows MTD (Month-to-Date) and YTD (Year-to-Date) actuals, targets, and previous year data.
- Conditional formatting highlights performance using up/down arrows.
Click to SaaS Renewal KPI
KPI Trend Sheet Tab
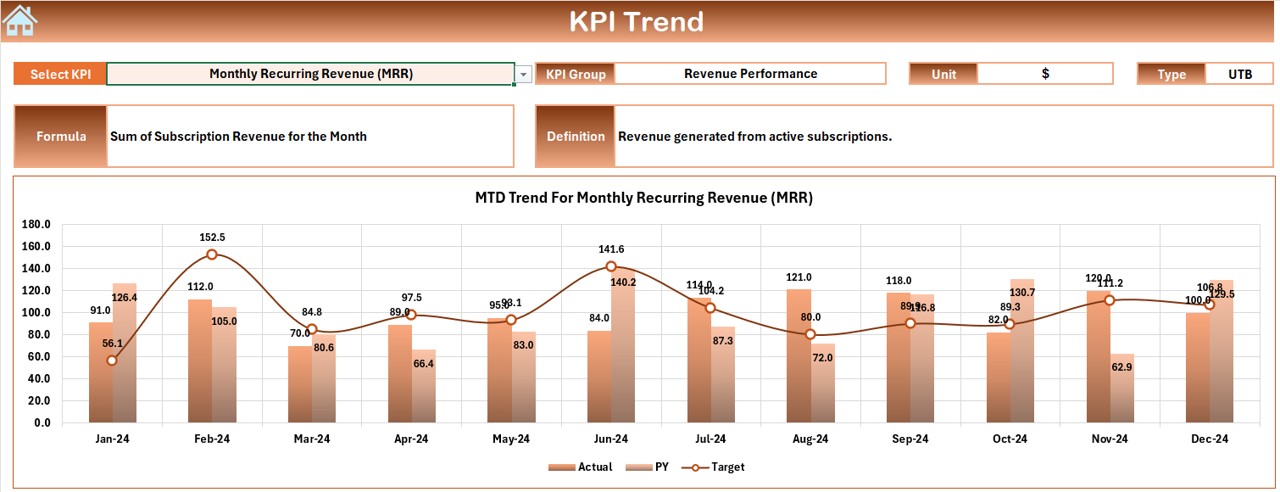
- KPI name selection available in cell C3.
- Displays the KPI Group, unit, type (Lower the Better/Upper the Better), formula, and definition.
- Trend charts for MTD and YTD actuals, targets, and previous year numbers.
Actual Numbers Input Sheet
- Enter MTD and YTD actual numbers for each month.
- Change the reference month by updating cell E1.
Target Sheet Tab
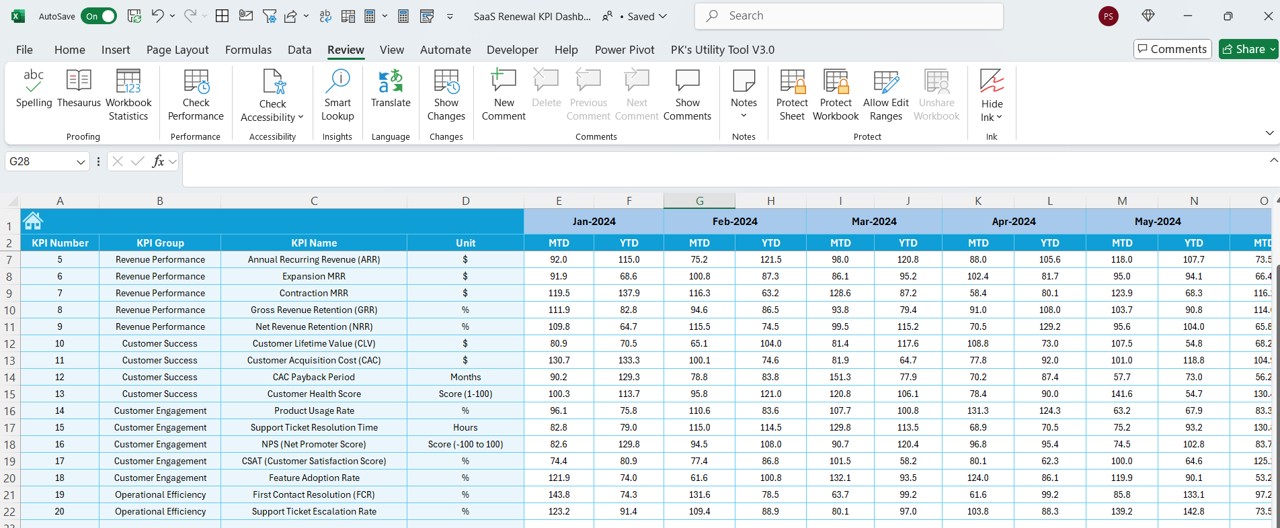
- Input the target numbers for each KPI for MTD and YTD.
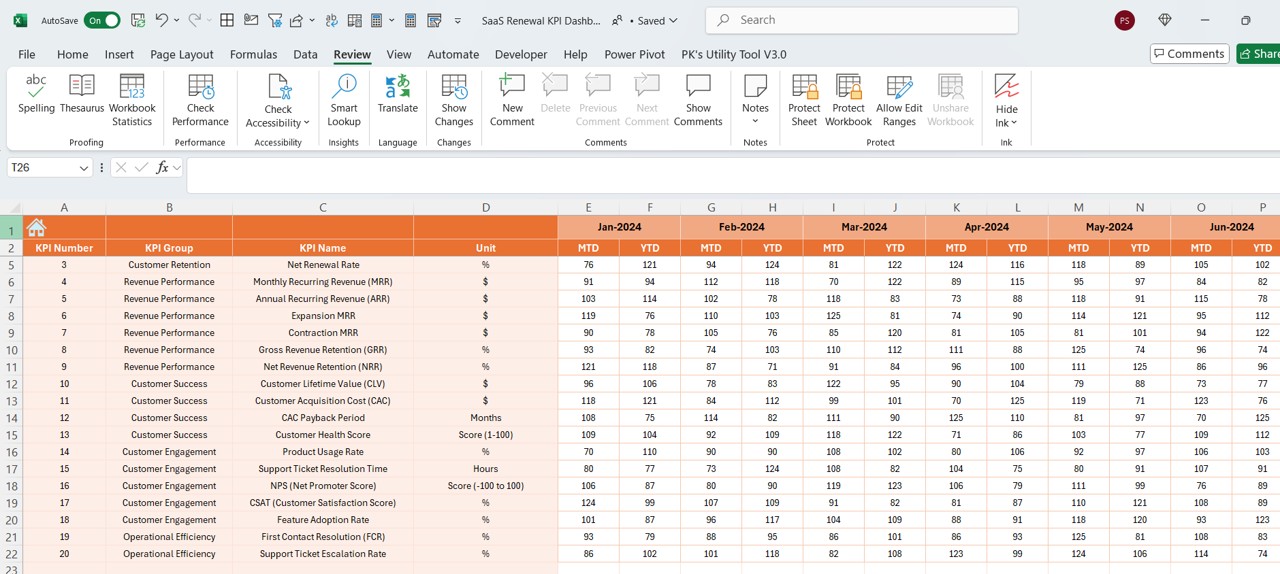
Previous Year Numbers Sheet Tab
- Enter previous year’s data to compare performance.
KPI Definition Sheet Tab
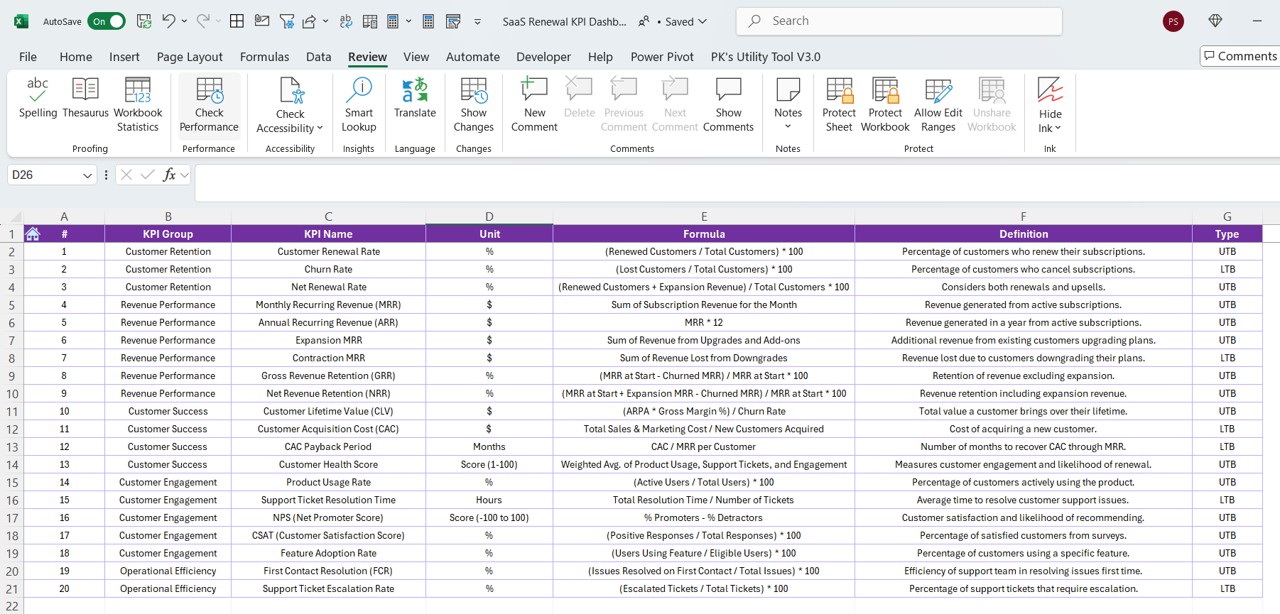
- Maintain a structured KPI dictionary with the KPI name, group, unit, formula, and definition.
Advantages of Using a SaaS Renewal KPI Dashboard
- Data-Driven Decision Making – Make informed choices by tracking key performance indicators.
- Improved Renewal Rates – Identify gaps in your renewal process and improve customer retention.
- Real-Time Performance Monitoring – Monitor monthly and yearly trends with dynamic charts.
- Easy Customization – Modify targets and actuals effortlessly based on business requirements.
- Enhanced Visualization – Conditional formatting and trend charts help in quick analysis.
Click to SaaS Renewal KPI
Best Practices for Using the SaaS Renewal KPI Dashboard
- Keep Data Updated – Regularly input actual numbers and targets to ensure accurate reporting.
- Monitor Trends – Use the KPI Trend Sheet to analyze long-term performance.
- Set Realistic Targets – Define achievable goals based on historical performance and business forecasts.
- Review Monthly – Analyze MTD and YTD performance to detect trends and take corrective actions.
- Ensure Data Consistency – Cross-check actuals with targets and previous year data to maintain accuracy.
Step-by-Step Guide to Using the Dashboard
Step 1: Navigate Through the Dashboard
Use the Home Sheet to access different sections quickly.
Step 2: Enter Data
- Update Actual Numbers Input Sheet with MTD and YTD values.
- Input monthly targets in the Target Sheet Tab.
- Add previous year’s data in the Previous Year Numbers Sheet Tab.
Step 3: Analyze Trends
- Use the Dashboard Sheet Tab to monitor performance metrics.
- Check the KPI Trend Sheet for deeper insights.
Step 4: Optimize Performance
- Identify low-performing KPIs and implement corrective actions.
- Adjust targets based on insights from previous performance trends.
Step 5: Share Insights
- Export reports and share them with stakeholders to align business strategies.
Frequently Asked Questions (FAQs)
What is a SaaS Renewal KPI Dashboard?
A SaaS Renewal KPI Dashboard is an Excel-based tool designed to track and analyze key renewal metrics, helping SaaS businesses improve customer retention and revenue growth.
How can I customize the dashboard for my business needs?
You can easily modify KPI names, targets, actual values, and formulas to fit your specific business requirements.
What KPIs should I track in a SaaS Renewal Dashboard?
- Some essential SaaS renewal KPIs include:
- Renewal Rate
- Customer Churn Rate
- Customer Lifetime Value (CLV)
- Monthly Recurring Revenue (MRR) Growth
- Expansion Revenue
How often should I update my SaaS Renewal Dashboard?
For the best results, update the MTD and YTD actual numbers at least once a month to ensure accurate tracking and reporting.
Can I integrate this dashboard with other tools?
Yes! Youkan link this dashboard with Google Sheets, Power BI, or automation tools like Zapier to streamline data entry and reporting.
Conclusion
A SaaS Renewal KPI Dashboard in Excel is a powerful tool to track and optimize your renewal process. By regularly updating data and analyzing trends, businesses can enhance customer retention, reduce churn, and maximize revenue growth. Follow the best practices outlined above, and you’ll be on your way to a data-driven renewal strategy that delivers real results!
Click to SaaS Renewal KPI
Visit our YouTube channel to learn step-by-step video tutorials
View this post on Instagram