In today’s highly competitive business environment, organizations must stay on top of their compliance metrics to ensure smooth operations and avoid penalties. That’s where a Sales and Marketing Compliance KPI Dashboard in Excel becomes essential. This powerful tool provides a clear and interactive way to track key compliance indicators, offering a bird’s-eye view of how well the sales and marketing departments are adhering to internal policies and external regulations.
This article explores everything you need to know about the Sales and Marketing Compliance KPI Dashboard in Excel—including its features, advantages, best practices, and more. Let’s dive right in!
Click to Purchases Sales and Marketing Compliance KPI Dashboard in Excel
What Is a Sales and Marketing Compliance KPI Dashboard?
A Sales and Marketing Compliance KPI Dashboard is an Excel-based tool that helps businesses monitor their key performance indicators related to compliance. These KPIs can include contract accuracy, regulatory adherence, training completion rates, communication standards, and ethical sales practices.
Using this dashboard, teams can identify gaps in compliance efforts and take corrective actions in real time. This not only helps avoid regulatory issues but also enhances overall business integrity.
Why Use Excel for a Compliance KPI Dashboard?
Although many dashboard tools exist today, Excel remains a favorite due to its flexibility, cost-effectiveness, and wide availability. Excel dashboards are easy to share, customize, and automate using built-in features like formulas, charts, and conditional formatting.
Moreover, most teams are already comfortable using Excel, which makes implementation smooth and training minimal.
Key Features of the Sales and Marketing Compliance KPI Dashboard in Excel
This ready-to-use dashboard template comes with 7 detailed and interactive worksheets, each serving a distinct purpose:
Home Sheet
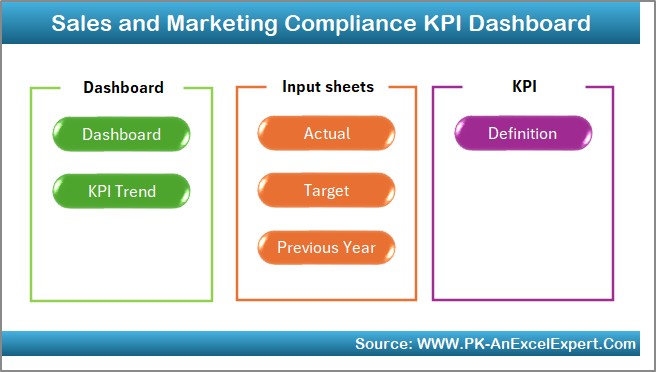
- This is your control center. It includes 6 buttons that allow users to quickly jump to any of the other sheets in the dashboard. Think of it as your personal command board.
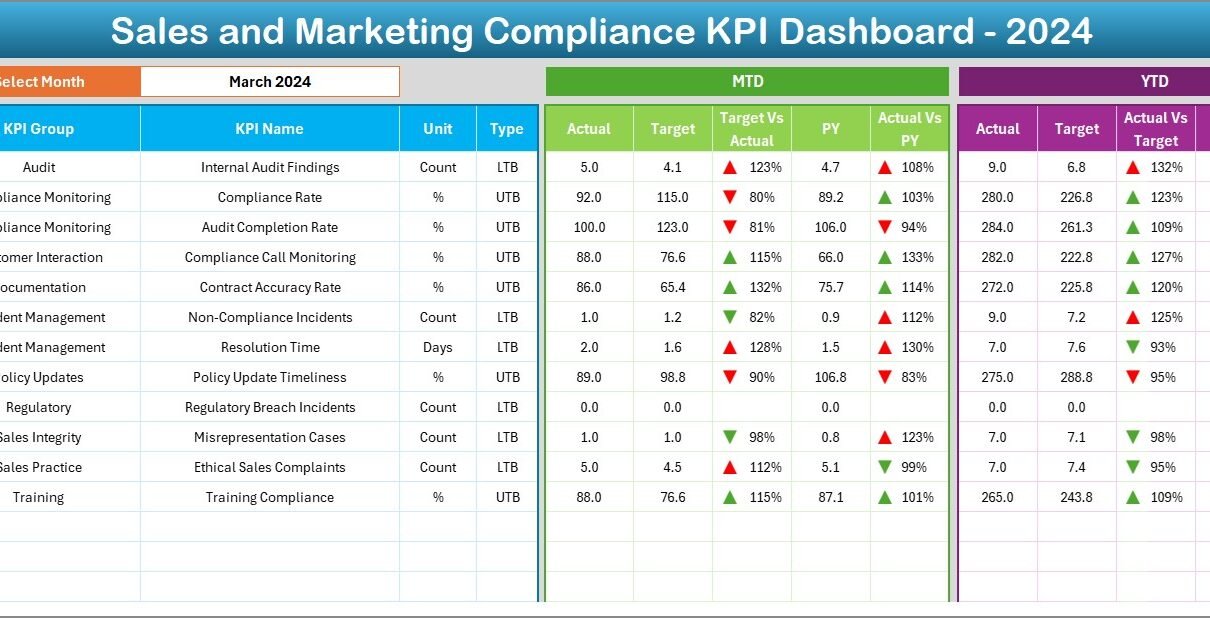
Dashboard Sheet
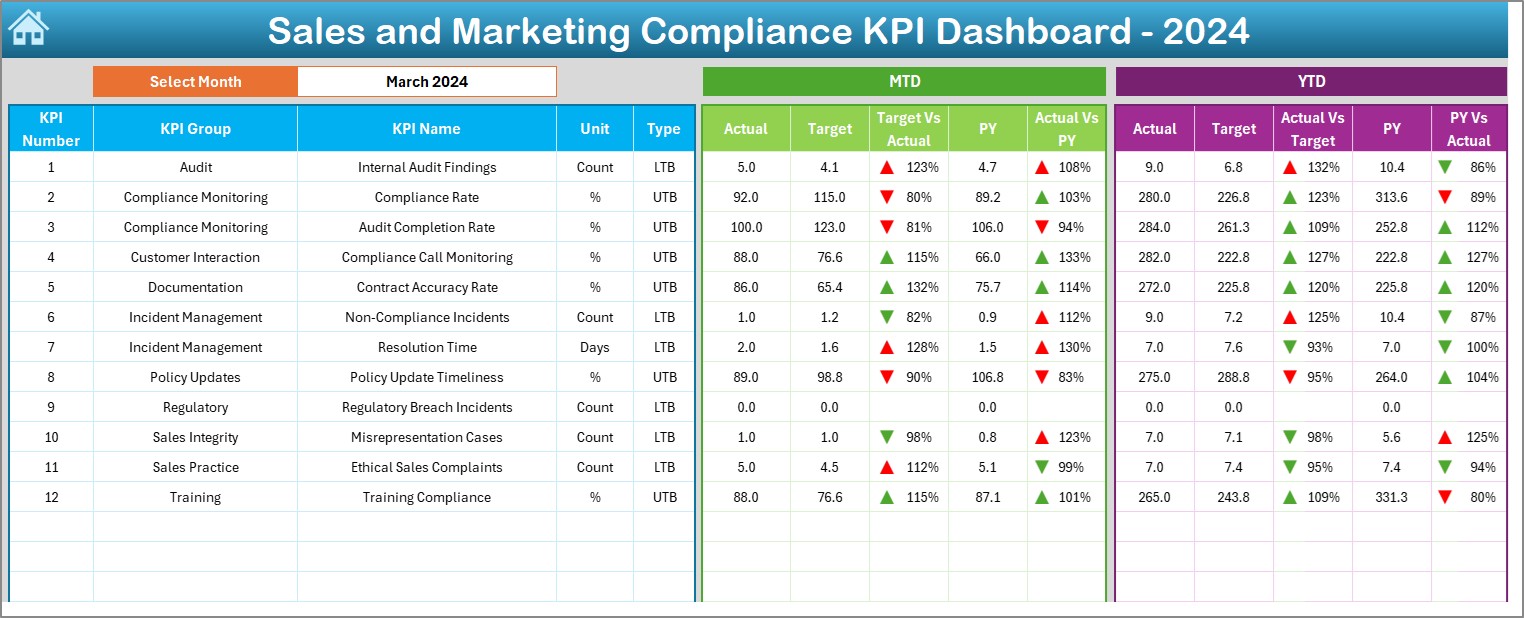
- This is the heart of the tool. From here, you can:
- Select the month from a drop-down (Cell D3)
- View Month-to-Date (MTD) and Year-to-Date (YTD) data
- Compare Actuals vs Target and Previous Year (PY) values
- Spot performance with conditional formatting arrows indicating progress or decline
KPI Trend Sheet
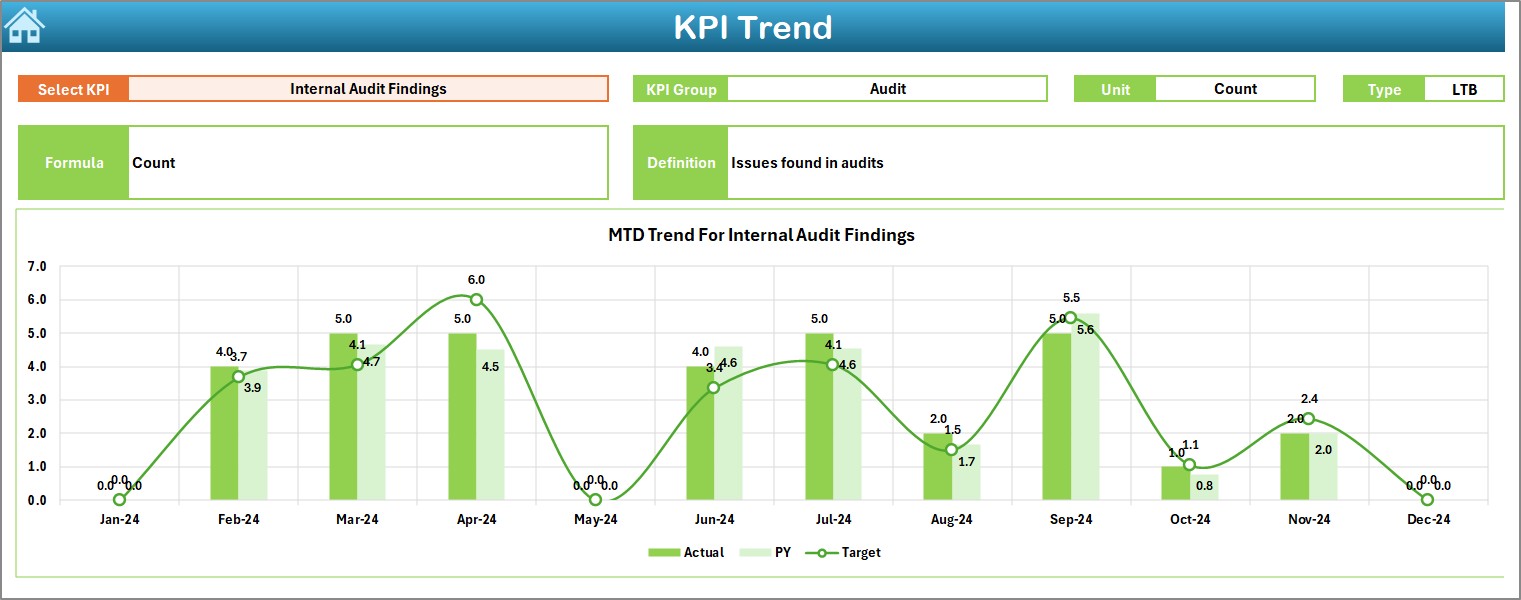
- This sheet helps you track trends over time:
- Select a KPI name from a drop-down in Cell C3
- View KPI Group, Unit, Formula, and Type (LTB or UTB)
- Visualize trends for MTD and YTD data for Actual, Target, and PY using charts
Click to Purchases Sales and Marketing Compliance KPI Dashboard in Excel
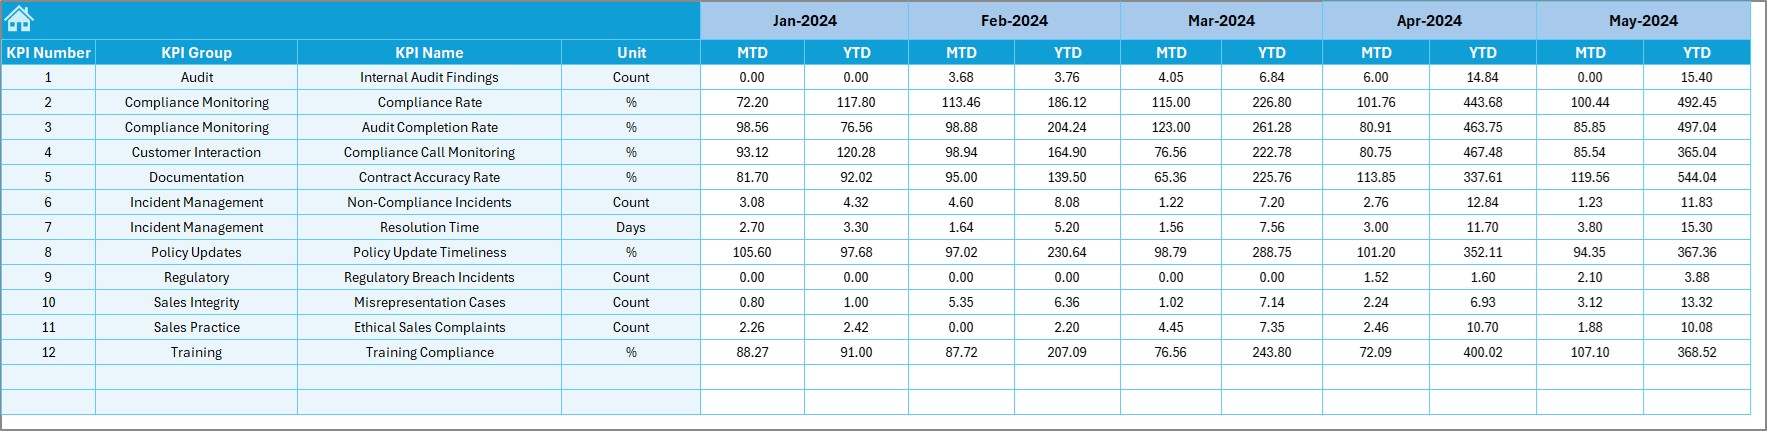
Actual Numbers Input Sheet

- Enter real performance numbers for any month:
- Change the starting month in Cell E1
- Fill in the MTD and YTD actuals
- The dashboard updates automatically!
Target Sheet
- Set the monthly targets here:
- Input both MTD and YTD targets for each KPI
- Ensure goals are aligned with compliance standards
Previous Year Number Sheet
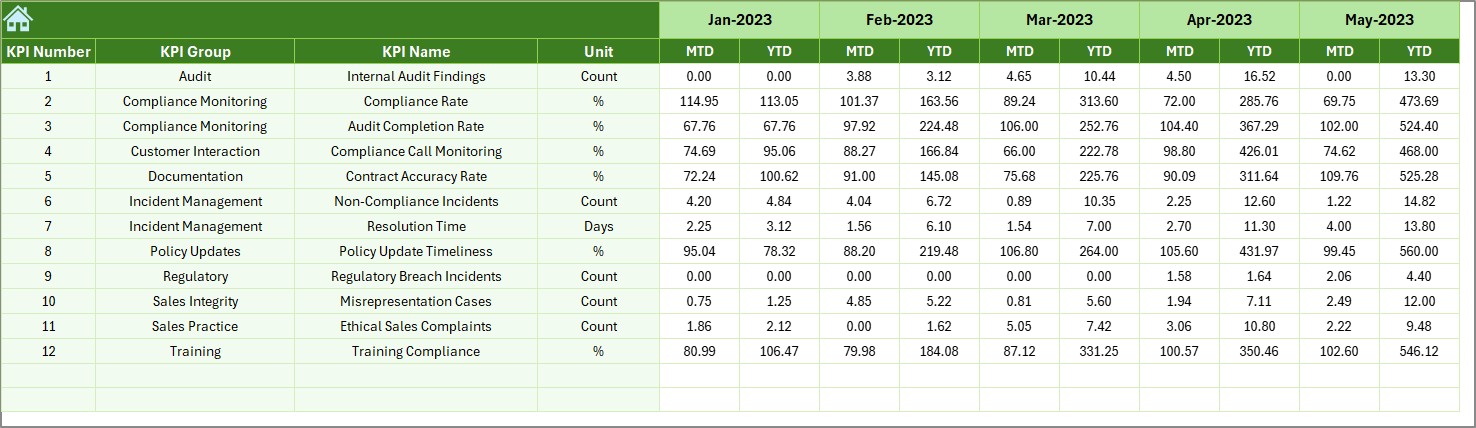
For comparative analysis:
- Enter the past year’s MTD and YTD numbers
- Helps identify year-over-year improvements or concerns
KPI Definition Sheet
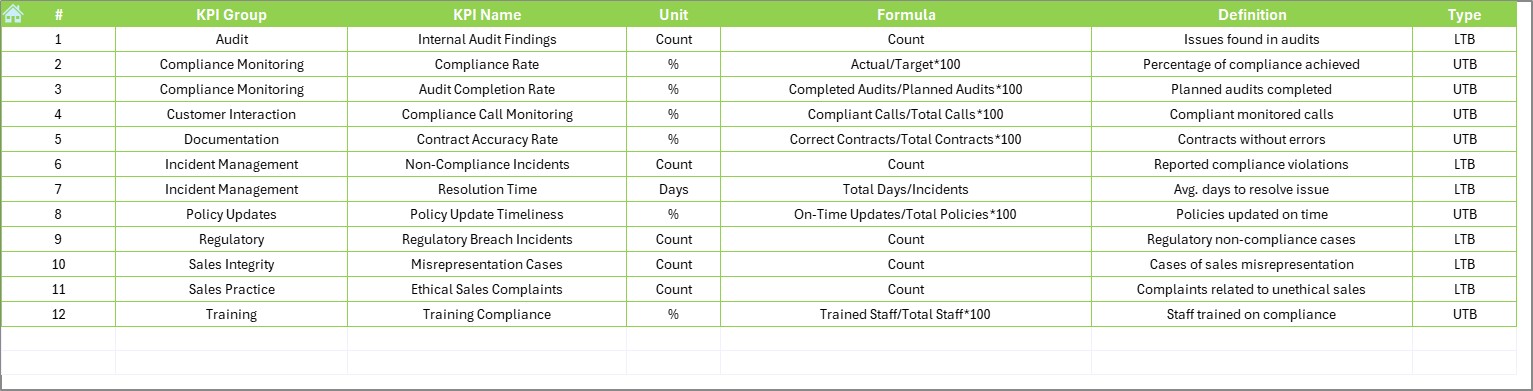
Document your KPIs clearly:
- List KPI Name, Group, Unit, Formula, Definition, and Type
- Creates a solid reference point for anyone using the dashboard
Advantages of a Sales and Marketing Compliance KPI Dashboard
Having such a structured dashboard offers numerous benefits:
📊 Clear Visibility: Quickly spot compliance gaps and take proactive measures.
🔧 Customizable and Scalable: Easily add or remove KPIs as your business evolves.
⏳ Time-Saving Automation: Auto-update charts and stats with minimal manual effort.
🏛️ Informed Decision-Making: Better insights lead to smarter compliance and strategic decisions.
📅 Improved Accountability: Track performance across teams and hold stakeholders accountable.
Best Practices for Using the Sales and Marketing Compliance KPI Dashboard
To get the most out of this tool, follow these best practices:
- Define KPIs Clearly: Start with a well-defined list of KPIs. Avoid vague indicators. For example, use “Contract Error Rate” instead of “Compliance Quality.”
- Use Consistent Units and Formulas: Standardize the units and ensure all users understand how each KPI is calculated.
- Update Data Regularly: Make it a habit to update actual numbers monthly. Set calendar reminders if necessary.
- Leverage Conditional Formatting: Use visual indicators like arrows or color codes to highlight performance highs and lows instantly.
- Monitor Trends, Not Just Snapshots: Always check the trend sheets to see how compliance metrics are evolving over time. This prevents you from overreacting to temporary dips or peaks.
- Train Your Team: Ensure all relevant staff members know how to navigate and use the dashboard. Consider running short training sessions during onboarding or quarterly reviews.
- Review and Improve KPIs Annually: As your business grows, your compliance metrics may need to change. Make sure the dashboard evolves with your needs.
Conclusion
A well-designed Sales and Marketing Compliance KPI Dashboard in Excel is more than just a tracking tool—it’s a strategic asset. It ensures transparency, enhances accountability, and supports proactive compliance management. Whether you’re a compliance officer or a sales leader, this dashboard empowers your team to perform better and stay aligned with both internal policies and regulatory demands.
So, don’t wait! Download your dashboard, customize it, and transform how you manage compliance today.
Frequently Asked Questions (FAQs)
What is the purpose of a compliance KPI dashboard?
A compliance KPI dashboard helps organizations track and manage their adherence to regulations, policies, and ethical standards. It provides real-time insights and improves accountability.
Can I add more KPIs to this Excel dashboard?
Yes, you can easily add new KPIs by updating the “KPI Definition” and “Target” sheets. The rest of the dashboard updates accordingly.
How can I make sure my data is accurate?
Ensure that your data sources are reliable and that data entry is verified. Regular audits of the data input sheet can also help maintain accuracy.
Is this dashboard suitable for small businesses?
Absolutely! It’s designed to be user-friendly and flexible, making it suitable for companies of all sizes.
Click to Purchases Sales and Marketing Compliance KPI Dashboard in Excel
Visit our YouTube channel to learn step-by-step video tutorials


