In today’s competitive landscape, keeping your customers engaged and satisfied is more critical than ever. Businesses that actively measure and improve customer engagement are far more likely to achieve sustained success. One of the most effective ways to monitor your engagement efforts is by using a Sales and Marketing Customer Engagement KPI Dashboard in Excel. This comprehensive tool allows you to track all the vital metrics that impact your sales, marketing, and customer relationship goals.
Let’s explore this powerful dashboard, its components, and how it can benefit your organization.
Click to Purchases Sales and Marketing Customer Engagement KPI Dashboard in Excel
What is a Sales and Marketing Customer Engagement KPI Dashboard?
A Sales and Marketing Customer Engagement KPI Dashboard is a visual tool designed in Microsoft Excel that displays all key performance indicators (KPIs) related to customer engagement. These KPIs help sales and marketing teams to measure effectiveness, compare targets with actual performance, and identify opportunities for improvement.
Instead of juggling multiple spreadsheets or reports, this dashboard brings everything together in one place. It provides a snapshot of how your strategies are performing and enables data-driven decisions that improve engagement and revenue.
Key Features of the Dashboard
This ready-to-use Excel template includes seven well-structured worksheets, each playing a vital role:
Home Sheet
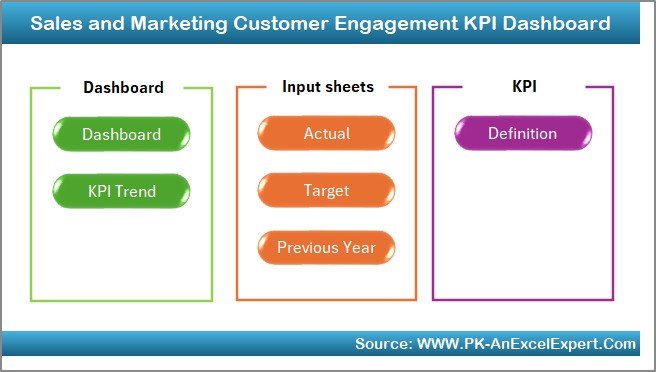
This is the landing or index sheet. It includes six navigation buttons that link directly to other sheets. This makes movement across the dashboard easy and efficient.
Dashboard Sheet
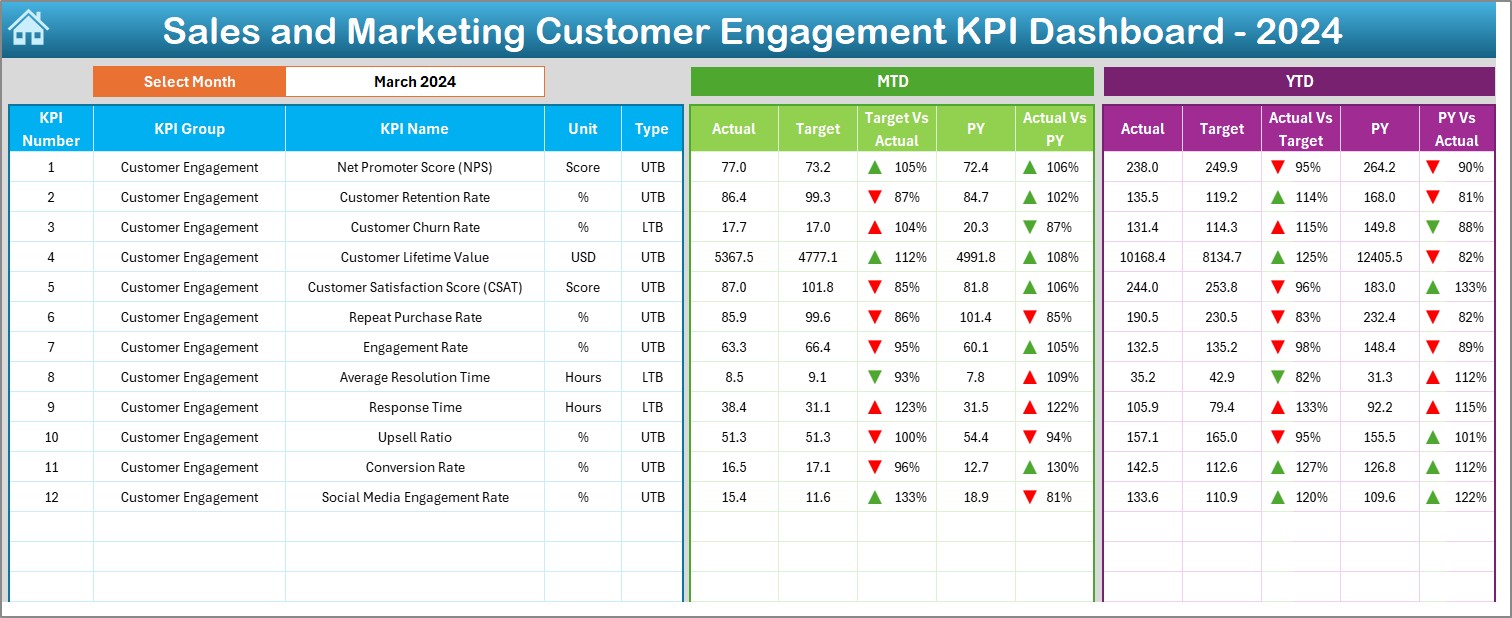
- The heart of the system! On this sheet:
- Use cell D3 to select the month from a drop-down list.
- It automatically updates the MTD (Month-to-Date), YTD (Year-to-Date), Target, and Previous Year values.
- Includes conditional formatting (up/down arrows) to highlight whether performance is improving or declining.
Click to Purchases Sales and Marketing Customer Engagement KPI Dashboard in Excel
KPI Trend Sheet
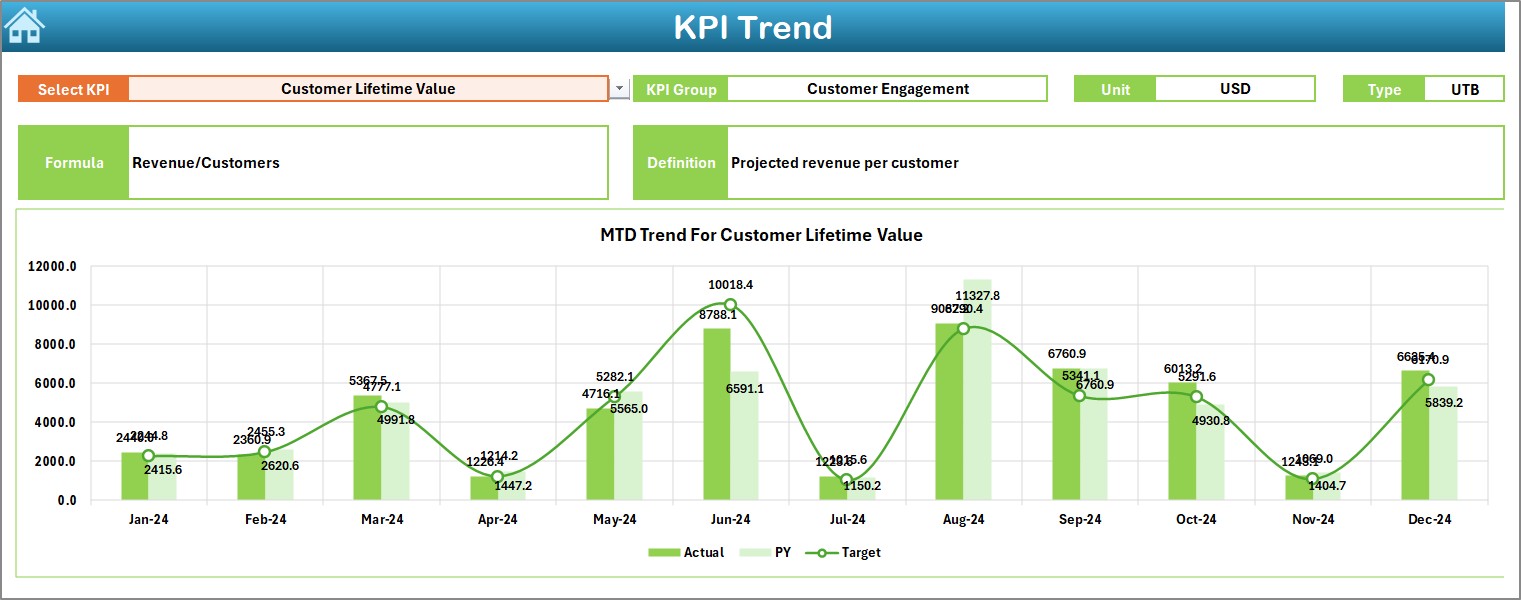
- This sheet visualizes the performance of each KPI over time.
- Choose a KPI from the drop-down in cell C3.
- View key details such as KPI group, unit, type (UTB or LTB), formula, and definition.
- Includes MTD and YTD trend charts to analyze progress.
Actual Numbers Input Sheet
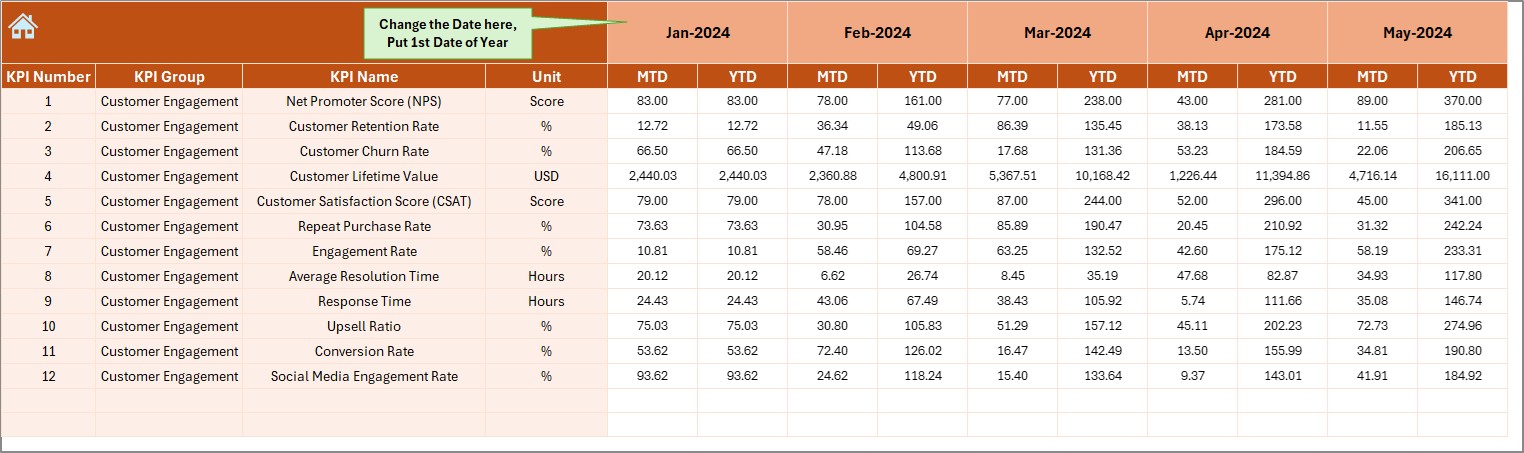
- This is your data entry zone for current year numbers:
- Input monthly actuals for each KPI.
- Use cell E1 to select the starting month of the financial year.
Target Sheet
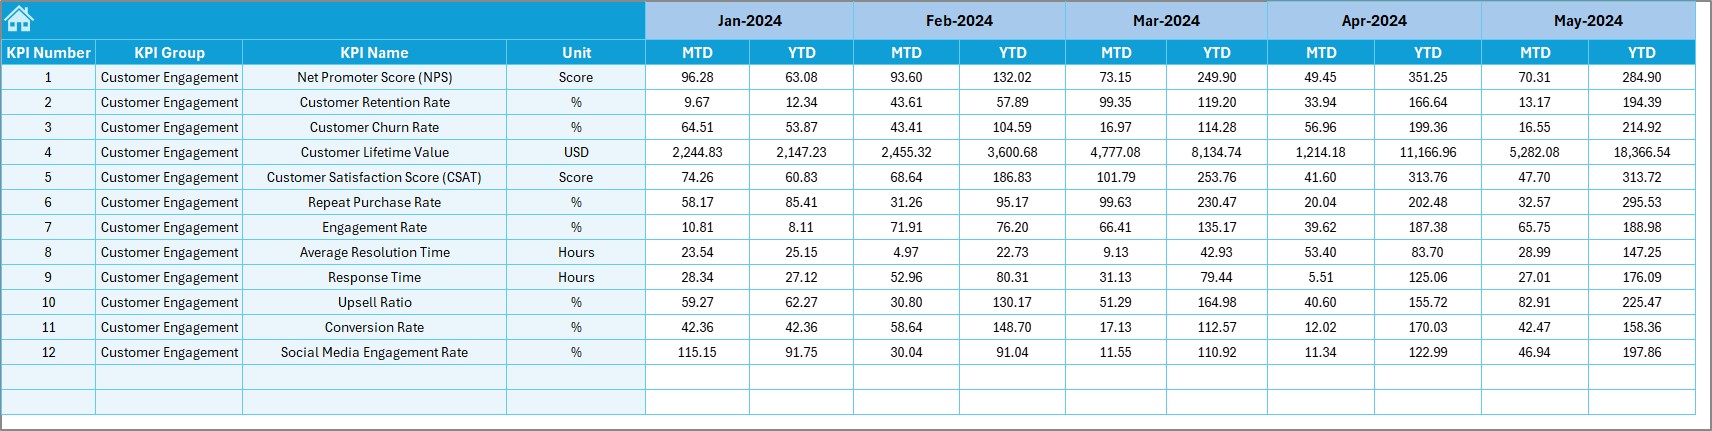
This sheet is where you:
- Enter MTD and YTD targets for each KPI.
- Maintain alignment with your business goals.
Previous Year Number Sheet
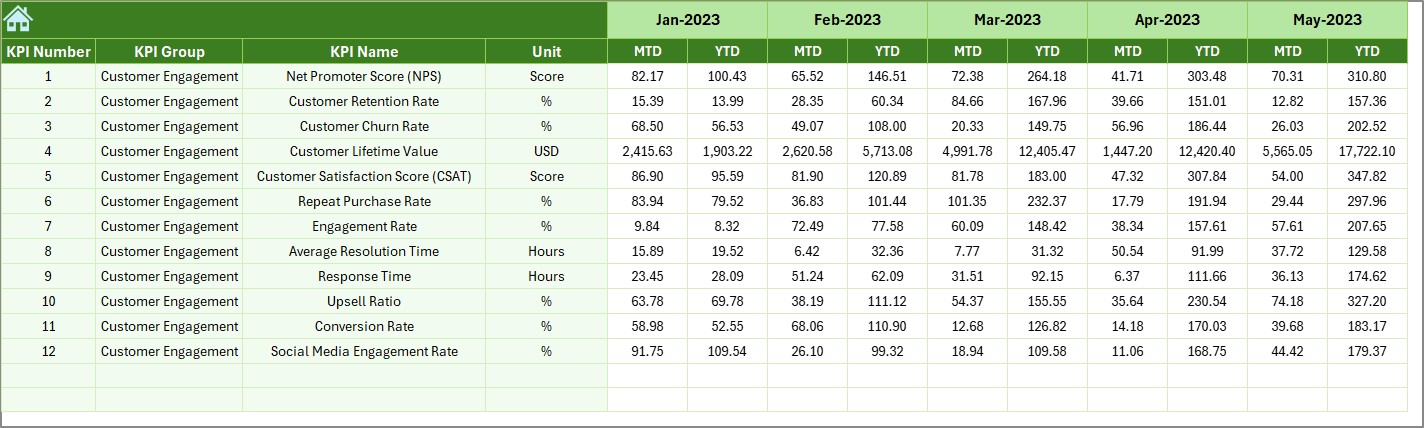
Here you can:
- Input monthly historical numbers for comparison.
- Benchmark current performance against past results.
KPI Definition Sheet
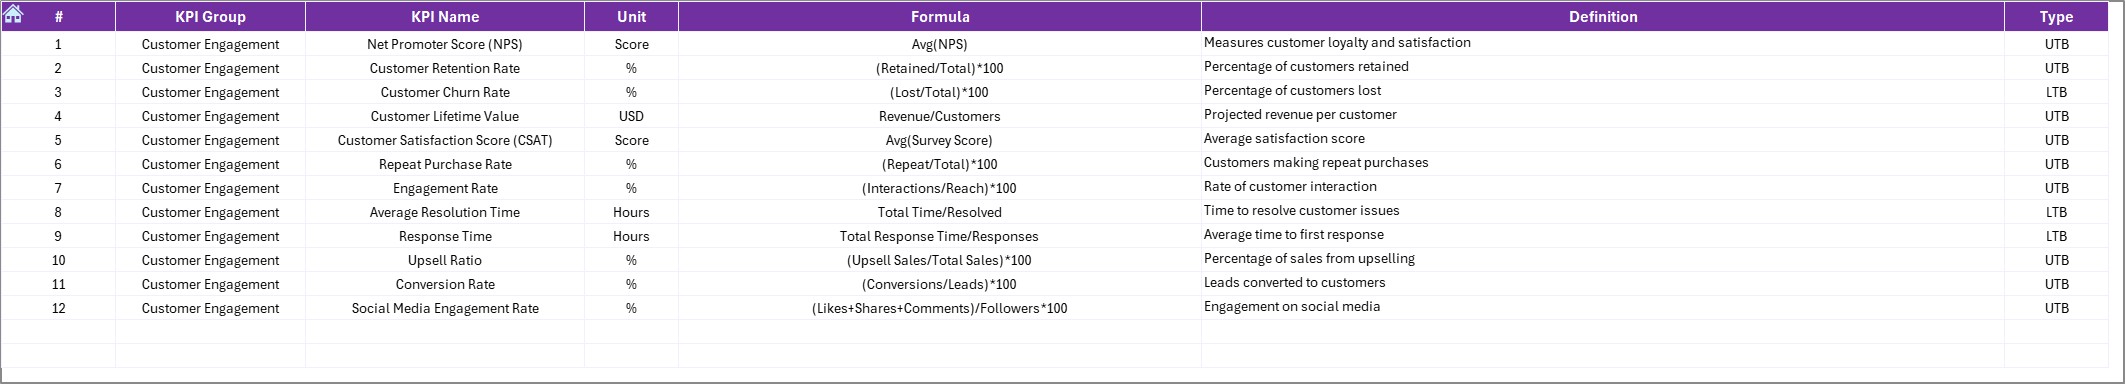
- This tab provides the backbone of your KPI system:
- Add each KPI’s name, group, unit, formula, and definition.
- Classify the KPI type: Upper the Better (UTB) or Lower the Better (LTB).
Advantages of Using This KPI Dashboard
📊 Centralized Data Management: You can store all actual, target, and historical KPI data in one place without having to look into separate files.
🌐 Informed Decision-Making: By comparing current and previous year data, leaders can identify patterns and make proactive decisions.
🌟 Real-Time Monitoring: The dashboard updates automatically with your data inputs, allowing real-time performance tracking.
📈 Visual Insights: Trend charts, conditional formatting, and dynamic summaries make it easy to spot areas of concern or excellence.
⏳ Time Efficiency: Automated drop-downs, pre-built formulas, and clickable navigation reduce the manual effort required.
Best Practices for the Sales and Marketing Customer Engagement KPI Dashboard
To make the most of this dashboard, follow these best practices:
- Keep Data Entry Consistent: Update your actual and target numbers on a fixed schedule (weekly or monthly) to keep metrics accurate.
- Use the KPI Definitions Effectively: Educate your team about each KPI’s purpose and calculation. It improves consistency in reporting.
- Monitor Both MTD and YTD: While Month-to-Date shows short-term progress, YTD offers long-term trends and helps avoid misleading results.
- Customize KPIs: Tailor the KPIs based on your industry, audience, and goals. Use the KPI Definition sheet to add or revise indicators.
- Analyze Trends Monthly: Spend time on the KPI Trend sheet to identify recurring dips or spikes. This helps in root-cause analysis.
Final Thoughts
The Sales and Marketing Customer Engagement KPI Dashboard in Excel is not just a reporting tool; it’s a strategic enabler. By using it regularly, your teams stay focused, aligned, and data-driven.
From improving lead conversions to increasing customer satisfaction, this dashboard empowers you to monitor what matters and act fast.
So, whether you’re a small business owner or a marketing executive, this Excel template will simplify your reporting and boost your results.
Frequently Asked Questions (FAQs)
Who can use this dashboard?
Any sales or marketing professional, team leader, or business owner can use it to track customer engagement KPIs.
Do I need advanced Excel skills to use it?
No, this dashboard is user-friendly and designed for those with basic Excel knowledge.
Can I add more KPIs?
Yes, simply go to the KPI Definition sheet and add your new KPI. Update related sheets accordingly.
Click to Purchases Sales and Marketing Customer Engagement KPI Dashboard in Excel
Visit our YouTube channel to learn step-by-step video tutorials