In today’s fast-paced digital world, businesses must protect sensitive data and streamline operations across departments. That’s why combining sales, marketing, and cybersecurity KPIs into one integrated dashboard is not just smart but necessary. This article will guide you through the benefits, best practices, and powerful features of the Sales and Marketing Cybersecurity KPI Dashboard in Excel.
Let’s dive into how this ready-to-use Excel dashboard template empowers you to monitor, track, and improve key performance indicators with ease.
Click to Purchases Sales and Marketing Cybersecurity KPI Dashboard in Excel
What Is the Sales and Marketing Cybersecurity KPI Dashboard?
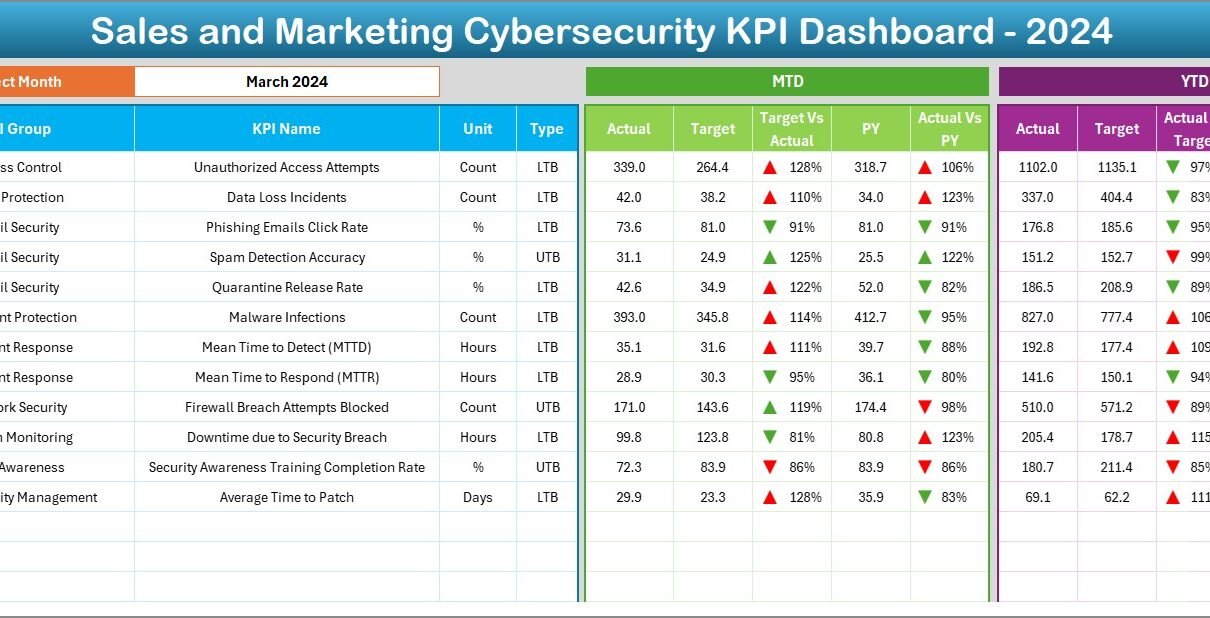
The Sales and Marketing Cybersecurity KPI Dashboard in Excel is a dynamic and user-friendly tool that lets you monitor key metrics across departments. It tracks Month-to-Date (MTD), Year-to-Date (YTD), and Previous Year data while presenting comparisons using visual cues and conditional formatting.
This dashboard consists of 7 well-structured worksheet tabs, each designed to perform specific roles to help you get insights at a glance.
Structure of the Dashboard
Home Sheet
- Serves as an index or navigation hub.
- Contains 6 clickable buttons to jump to the key dashboard sections.
- Helps users move across sheets quickly without scrolling or searching.
Dashboard Sheet Tab
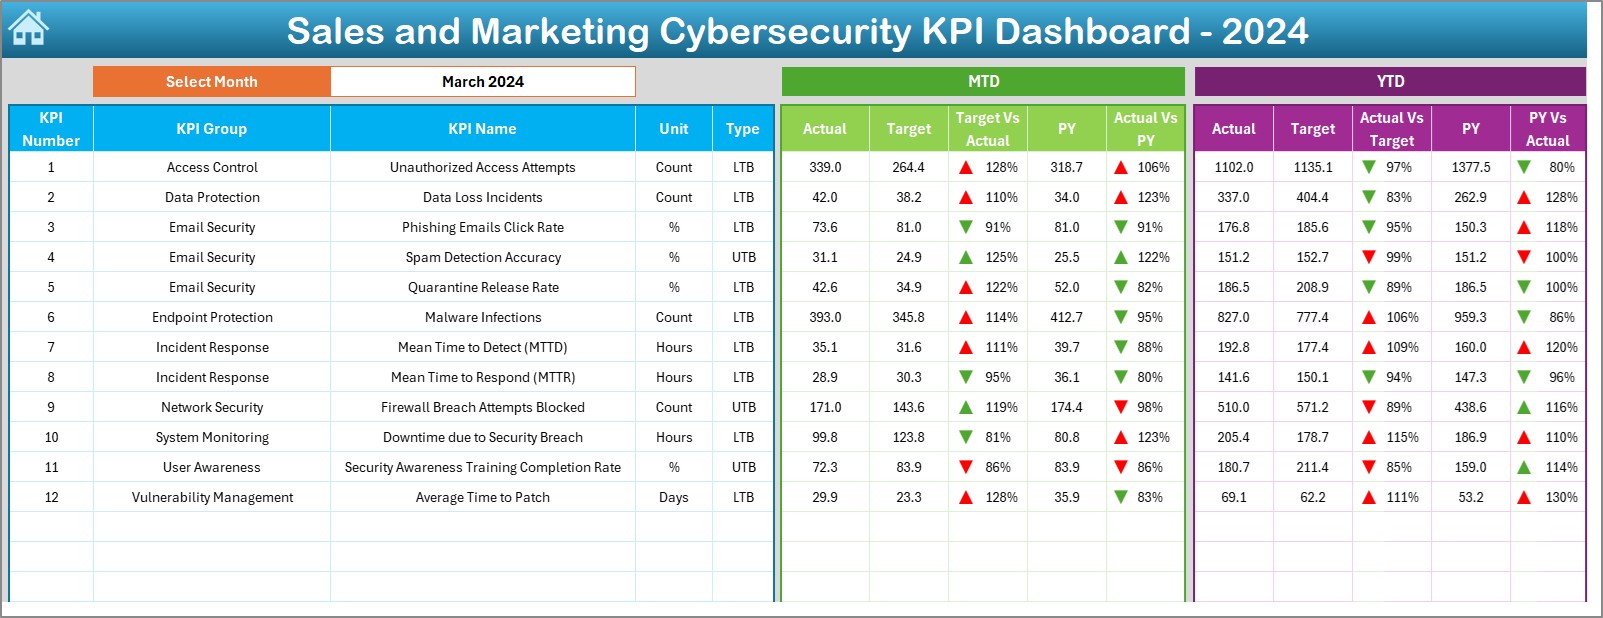
- The heart of the entire system.
- Select any month from the dropdown in cell D3.
- Automatically updates all KPIs for the selected month.
Displays:
- MTD Actual vs Target
- MTD vs Previous Year
- YTD Actual vs Target
- YTD vs Previous Year
Uses conditional formatting (up and down arrows) for intuitive insights.
KPI Trend Sheet Tab
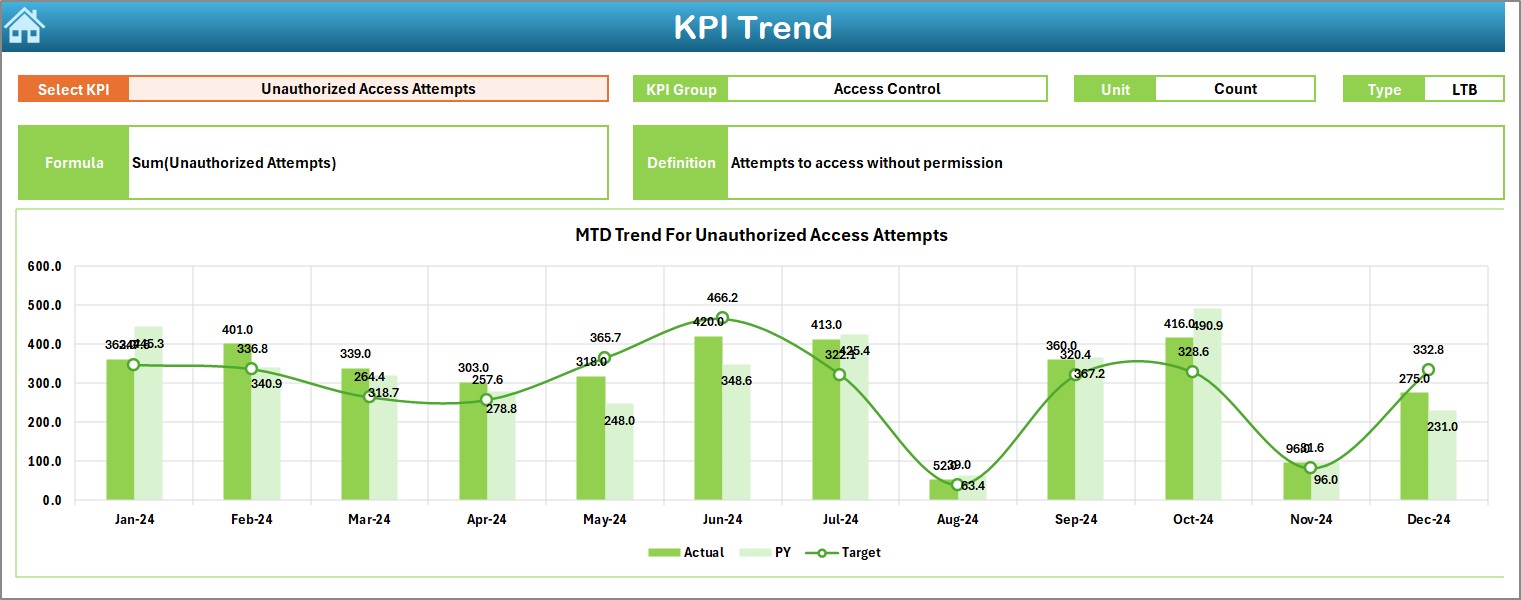
Choose any KPI from a dropdown in cell C3.
Displays:
- KPI Group
- Unit
- KPI Type (UTB or LTB)
- Formula
- Definition
Includes dynamic line charts showing MTD and YTD trends for Actual, Target, and PY values.
Actual Numbers Input Sheet
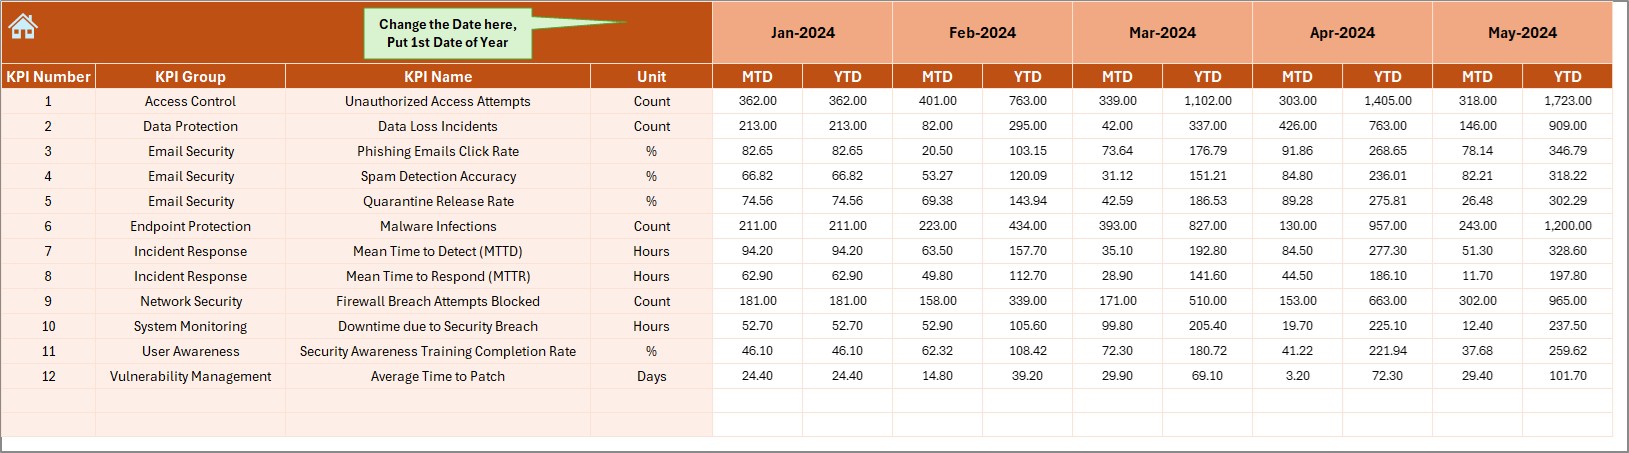
- Enter monthly actuals for MTD and YTD.
- Change the fiscal year starting month via cell E1.
- Keeps your data organized and current.
Click to Purchases Sales and Marketing Cybersecurity KPI Dashboard in Excel
Target Sheet Tab
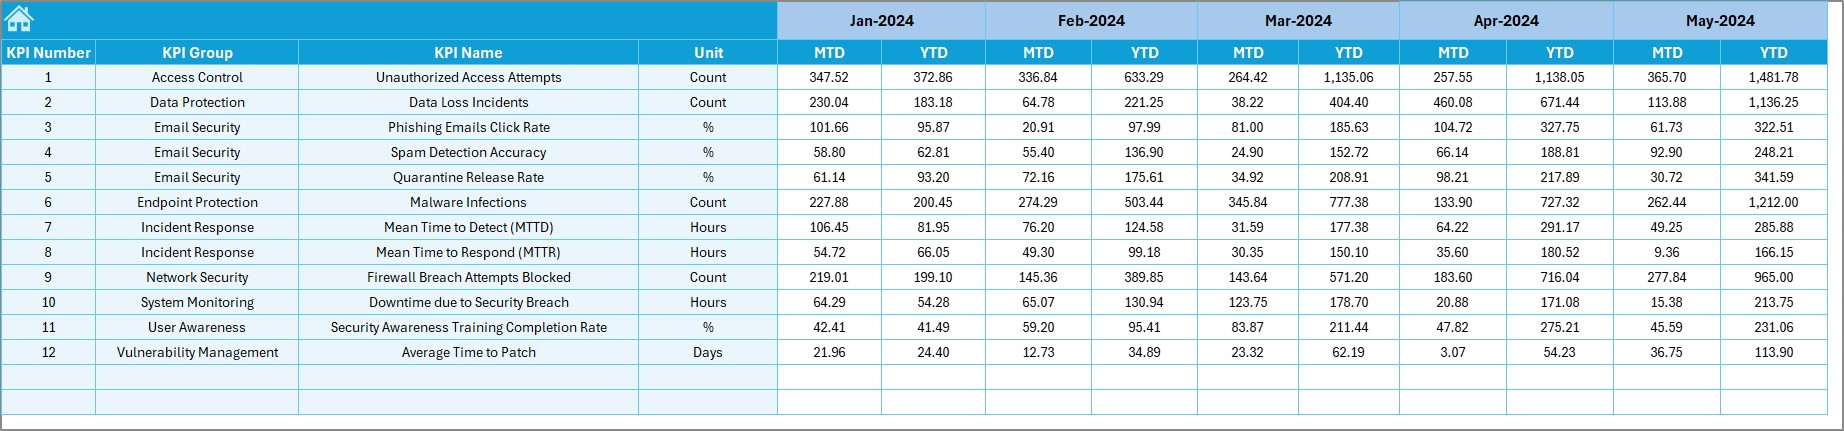
- Enter monthly targets for each KPI.
- Helps in performance comparison against set benchmarks.
Previous Year Number Sheet Tab
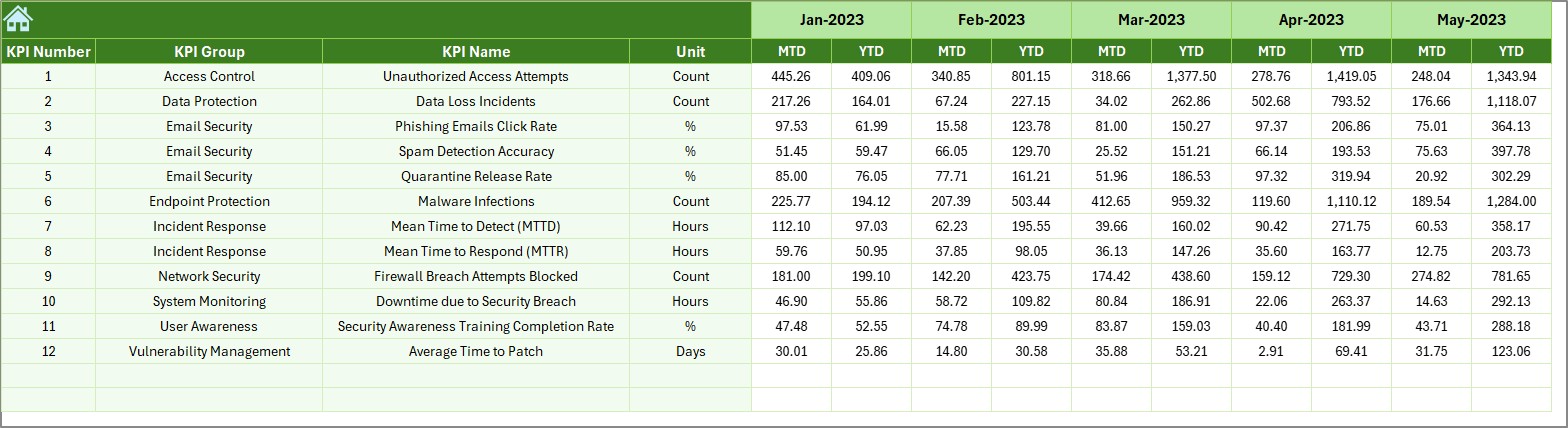
- Input last year’s data to measure YoY performance.
KPI Definition Sheet Tab
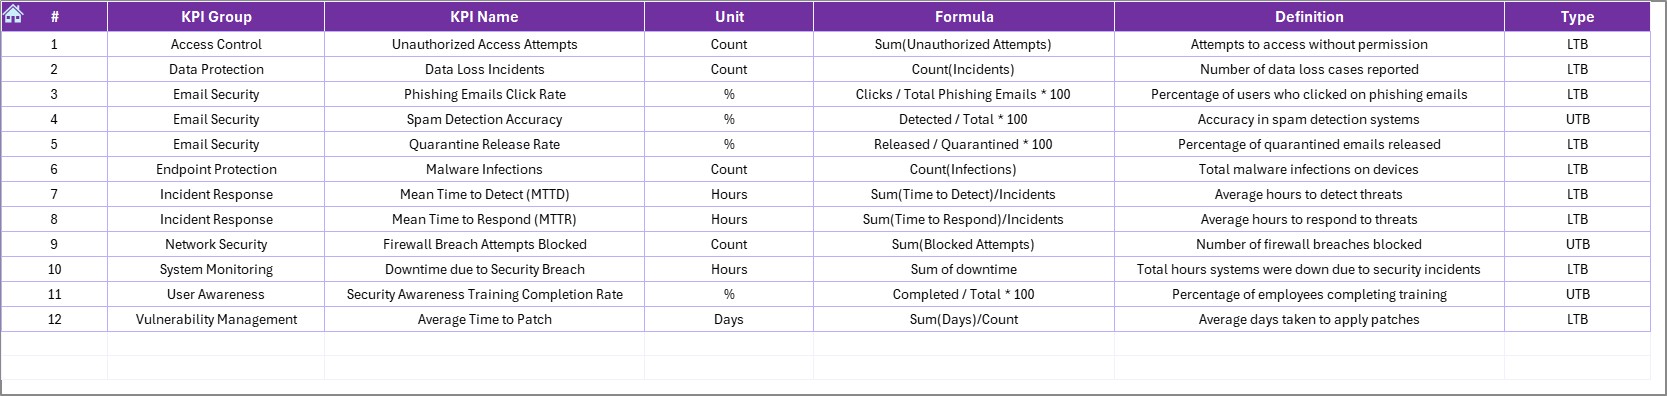
Maintain a clear dictionary of KPIs.
- Fields include: KPI Name, Group, Unit, Formula, and Definition.
Advantages of Using a Sales and Marketing Cybersecurity KPI Dashboard
🔹 Real-time Monitoring
- View current KPI performance instantly by selecting the month.
- Reduce the guesswork in performance tracking.
🔹 Centralized Data
- Keep all your KPI-related data in one place.
- Easy access for all stakeholders.
🔹 Enhanced Decision-Making
- Make strategic decisions based on accurate data.
- Identify underperforming KPIs early on.
🔹 Improved Collaboration
- Sales, marketing, and IT security teams stay aligned.
- Helps avoid silos across departments.
🔹 User-Friendly Interface
- No coding required.
- Navigation and interactivity simplify data exploration.
Best Practices for Using the Dashboard
To get the most value from your Sales and Marketing Cybersecurity KPI Dashboard, follow these best practices:
Update Data Monthly
- Ensure actual, target, and previous year values are input on time.
- This keeps the dashboard accurate and relevant.
Stick to Standardized KPI Definitions
- Use the KPI Definition sheet to maintain clarity and avoid confusion.
Keep Your Fiscal Year Aligned
- Update the starting month in cell E1 for consistency.
Review Conditional Formatting Rules
- Use visual indicators like arrows and colors for quicker insights.
Train Your Team
- Spend a session explaining how to use each sheet.
- This reduces the learning curve and ensures adoption.
Key KPIs You Should Include
Here are some essential KPIs included in the dashboard:
- Sales KPIs
- Revenue Growth Rate (Unit: %, UTB)
- Sales Conversion Rate (Unit: %, UTB)
- Customer Acquisition Cost (CAC) (Unit: $, LTB)
- Average Deal Size (Unit: $, UTB)
- Marketing KPIs
- Lead Conversion Rate (Unit: %, UTB)
- Marketing ROI (Unit: %, UTB)
- Cost per Lead (Unit: $, LTB)
- Email Open Rate (Unit: %, UTB)
- Cybersecurity KPIs
- Phishing Email Click Rate (Unit: %, LTB)
- Security Incident Response Time (Unit: Hours, LTB)
- User Access Review Completion Rate (Unit: %, UTB)
- System Vulnerability Patch Time (Unit: Days, LTB)
Conclusion
The Sales and Marketing Cybersecurity KPI Dashboard in Excel bridges the gap between data and action. With just a few clicks, you can track vital metrics across departments, drive better decisions, and improve your overall performance.
By combining visualizations, dropdown filters, and structured data input, this Excel-based tool empowers your team to stay on top of targets while ensuring cybersecurity remains a top priority.
Frequently Asked Questions (FAQs)
What is the purpose of the Sales and Marketing Cybersecurity KPI Dashboard?
This dashboard helps track critical KPIs across sales, marketing, and cybersecurity departments in a centralized Excel file.
How often should I update the dashboard?
You should update it monthly to ensure MTD and YTD data reflect current performance.
Can I customize the KPIs?
Yes, simply modify the KPI Definition, Actual, and Target sheets based on your requirements.
Do I need advanced Excel skills to use this?
No. Basic Excel knowledge is enough. The file is user-friendly and intuitive.
Who should use this dashboard?
This tool is ideal for sales managers, marketing heads, IT security officers, and C-level executives.
Click to Purchases Sales and Marketing Cybersecurity KPI Dashboard in Excel
Visit our YouTube channel to learn step-by-step video tutorials
Watch the step-by-step video Demo: