Employee satisfaction plays a crucial role in the long-term success of any business, especially in the dynamic fields of sales and marketing. A motivated team not only boosts performance but also positively influences customer engagement and revenue growth. That’s why measuring employee satisfaction using a dedicated KPI dashboard is essential.
In this article, we will walk you through everything you need to know about the Sales and Marketing Employee Satisfaction KPI Dashboard in Excel. From key features and advantages to best practices and improvement areas, we will cover it all. Plus, we will end with frequently asked questions to help you get even more clarity.
What is a Sales and Marketing Employee Satisfaction KPI Dashboard?
A Sales and Marketing Employee Satisfaction KPI Dashboard is a specialized Excel-based tool used to track, measure, and visualize employee satisfaction metrics specifically within the sales and marketing departments. It allows managers and team leaders to:
- Monitor the performance and satisfaction of team members
- Compare actual outcomes with set targets and previous year data
- Identify trends, gaps, and opportunities for improvement
Why Use Excel for This Dashboard?
Click to Purchases Sales and Marketing Employee Satisfaction KPI Dashboard in Excel
While there are many tools available online, Excel remains one of the most accessible, flexible, and powerful platforms for tracking KPIs. Here’s why:
- Easy customization based on business needs
- No additional software cost
- Seamless data integration
- Simple and effective visualization features
Key Features of the KPI Dashboard
This ready-to-use Excel template includes seven well-structured worksheets, each serving a unique purpose:
Home Sheet
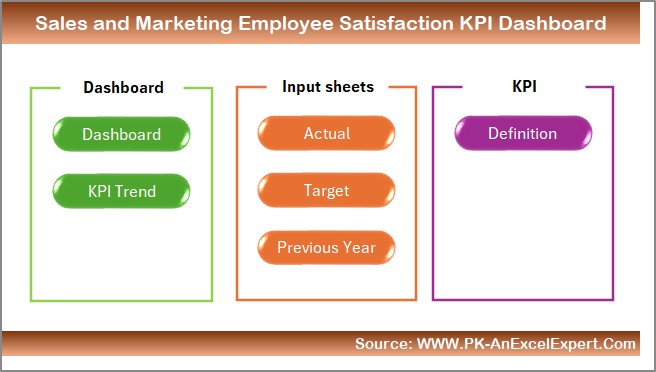
This is the navigation center of the dashboard. It includes six interactive buttons:
- Dashboard View
- KPI Trend
- Actual Input
- Target Sheet
- Previous Year Numbers
- KPI Definitions
You can jump directly to any of these sheets with a single click.
Dashboard Sheet
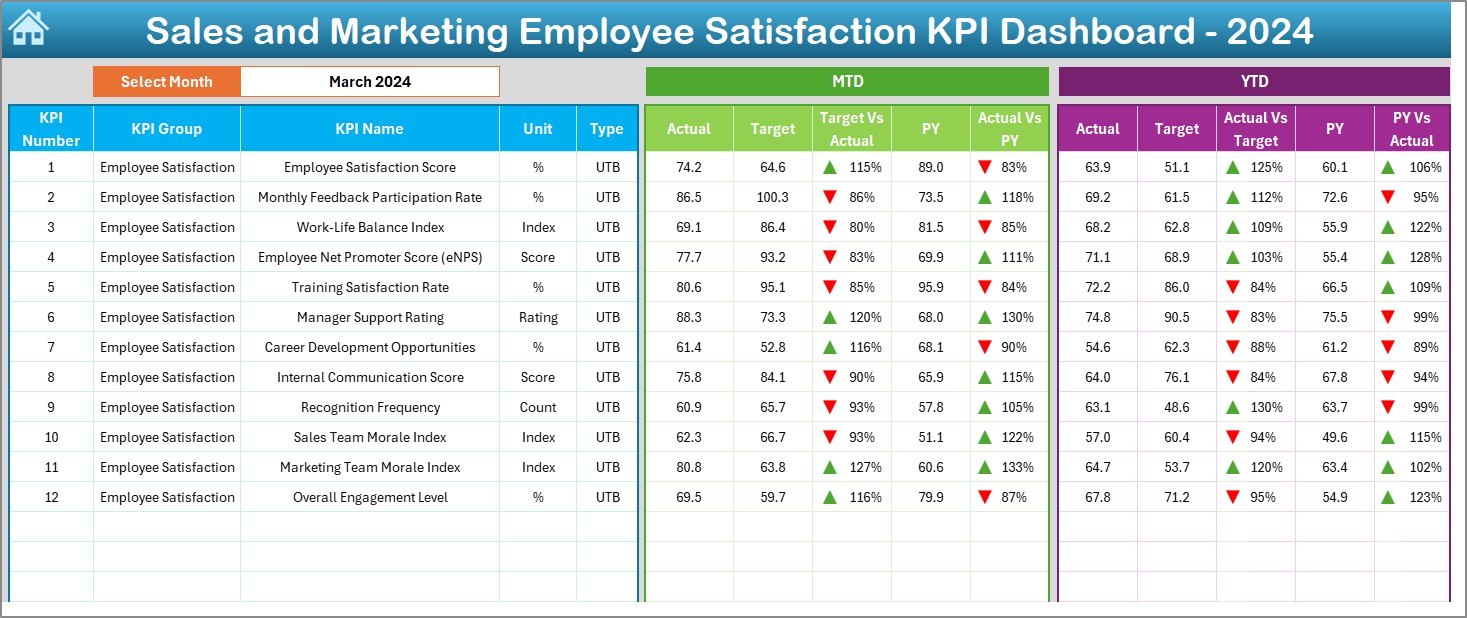
- This is the heart of the dashboard where all KPI metrics are presented. Here’s what you can do:
- Select the month from a dropdown (cell D3)
- View MTD (Month-to-Date) and YTD (Year-to-Date) actuals
- Compare them against Target and Previous Year
- Instantly identify performance using up/down arrows with conditional formatting
KPI Trend Sheet
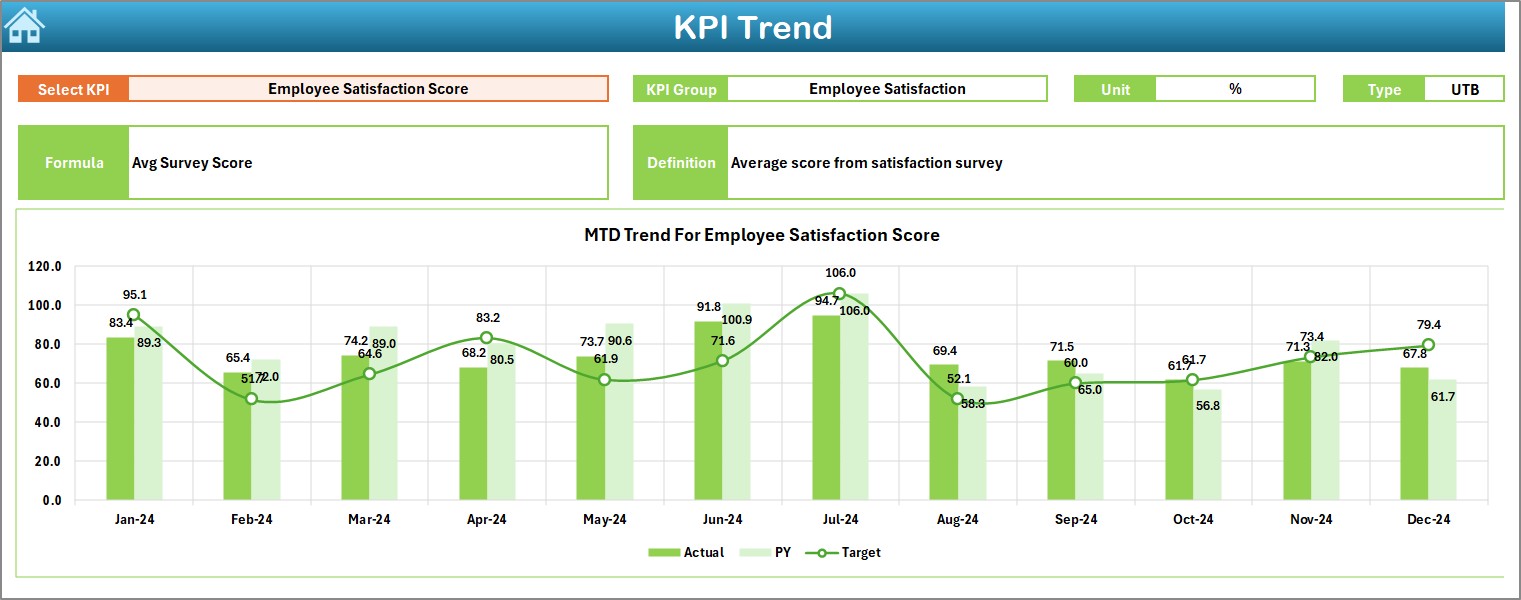
In this sheet:
Choose the KPI from a dropdown (cell C3)
- View associated details: Group, Unit, Type (UTB/LTB), Formula, Definition
Analyze MTD and YTD trend charts for actuals, targets, and PY data
Actual Numbers Input Sheet
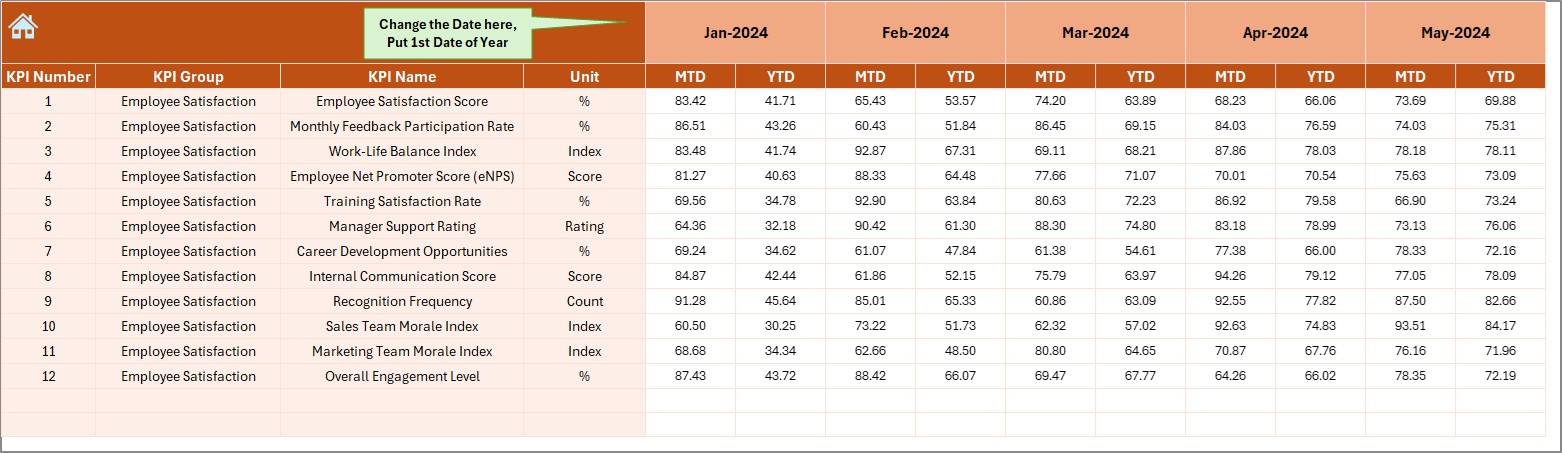
- This is where you manually input actual performance data:
- Choose the starting month in cell E1
- Enter MTD and YTD values per KPI and month
Target Sheet
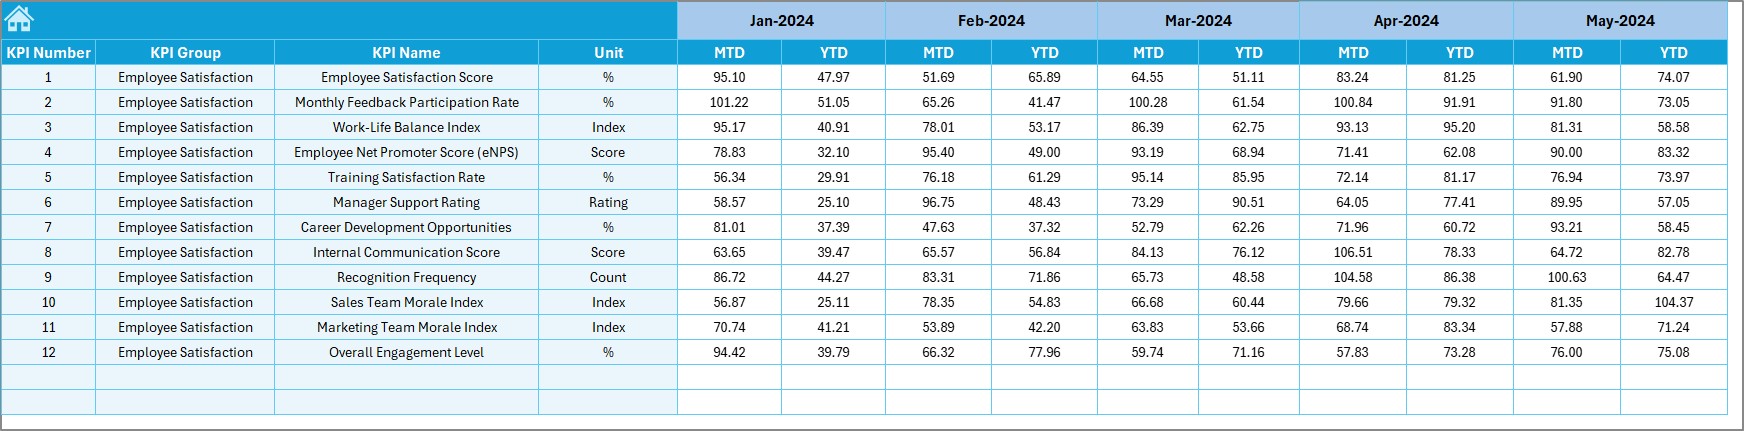
- Define your monthly performance expectations here:
- Input MTD and YTD Target values per KPI
Previous Year Numbers
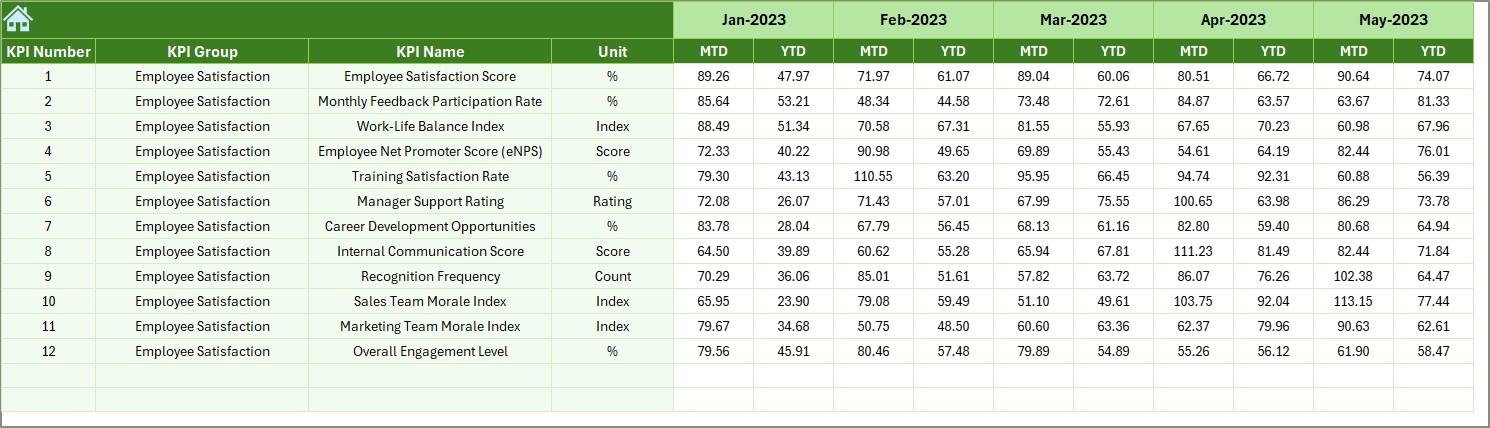
- A reference sheet to input PY data in the same structure as current year:
- Enables year-over-year performance comparison
Click to Purchases Sales and Marketing Employee Satisfaction KPI Dashboard in Excel
KPI Definition Sheet
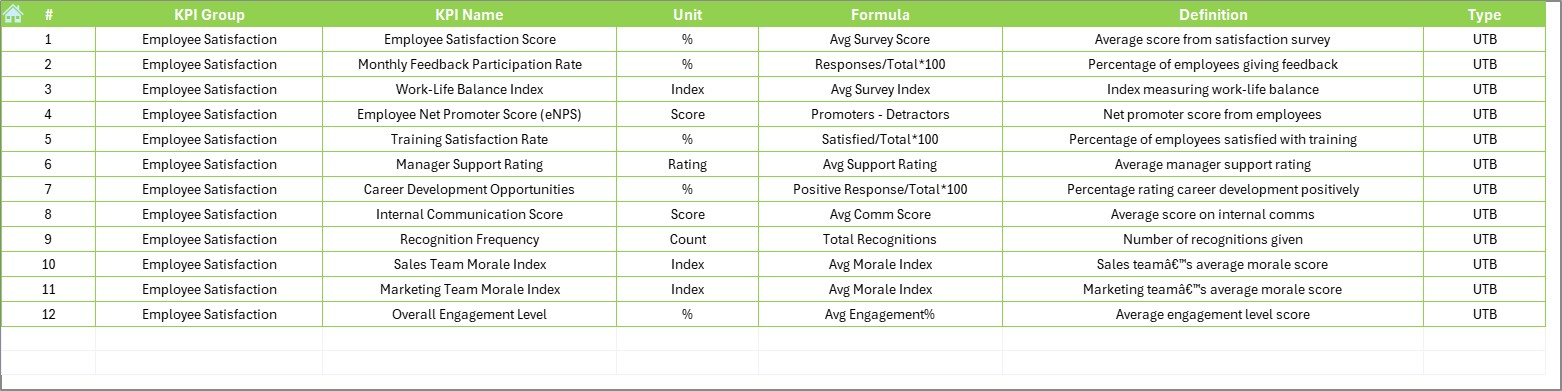
- Maintain a master list of all KPIs:
- Include KPI Name, Group, Unit, Formula, and Definition
What KPIs Can You Track?
Here are some common employee satisfaction KPIs you can track using this dashboard:
- Employee Engagement Score
- Absenteeism Rate
- Training Hours per Employee
- Employee Turnover Rate
- Internal Mobility Rate
- Employee Recognition Count
- Feedback Implementation Rate
- Onboarding Satisfaction
- Team Collaboration Score
- Work-Life Balance Rating
- Sales Performance Satisfaction
- Marketing Campaign Satisfaction
Each KPI is linked with clear targets and compared against actual and previous year data to offer a comprehensive performance view.
Advantages of Using This Dashboard
✅ Easy Monitoring: You get a centralized location to view employee satisfaction trends across months.
✅ Goal Alignment: Compare actual performance with predefined monthly and yearly goals.
✅ Instant Insights: Use of conditional formatting and visual indicators helps in identifying high and low performers.
✅ Improved Decision Making: Trend charts and historical comparisons offer clear insights for better planning.
✅ Time-Saving: No need to create reports manually. Just update actual data and see results instantly.
Best Practices for the Sales and Marketing Employee Satisfaction KPI Dashboard
To get the best out of this Excel dashboard, follow these tips:
- Update Data Monthly: Regular updates keep insights accurate.
- Keep KPI Definitions Clear: Avoid confusion by maintaining an updated KPI definition sheet.
- Use Color Coding: Conditional formatting should be intuitive.
- Automate Where Possible: Use formulas to auto-calculate YTD, growth rates, and differences.
- Engage Team Leaders: Let department heads review and use the data for targeted improvements.
- Opportunities for Improvement in the Dashboard
Final Thoughts
The Sales and Marketing Employee Satisfaction KPI Dashboard in Excel is a powerful tool that brings clarity and structure to employee satisfaction monitoring. With its interactive features, visual insights, and ease of use, this dashboard makes it easier than ever to keep your team happy, motivated, and aligned with organizational goals.
Frequently Asked Questions (FAQs)
What are the most important KPIs to measure employee satisfaction in sales and marketing?
Some key KPIs include Employee Engagement Score, Turnover Rate, Feedback Implementation Rate, and Work-Life Balance Rating.
Can I add my own KPIs to this Excel template?
Yes! The dashboard is fully customizable. You can easily add or remove KPIs by modifying the KPI Definition and Data sheets.
How often should I update the dashboard?
Ideally, update it monthly. This helps track both short-term and long-term trends.
Do I need Excel skills to use this dashboard?
Basic Excel skills are enough. Most formulas and dropdowns are already set up. You just need to input your data.
Is this dashboard suitable for other departments too?
Absolutely. While designed for sales and marketing, you can adapt it to any department by changing the KPIs.
Can I track historical trends using this dashboard?
Yes, the KPI Trend sheet allows you to view both MTD and YTD performance trends over time.
Click to Purchases Sales and Marketing Employee Satisfaction KPI Dashboard in Excel
Visit our YouTube channel to learn step-by-step video tutorials