In today’s fast-paced and data-driven business world, tracking performance is not just a good practice—it’s essential. That’s where the Sales and Marketing Growth Metrics KPI Dashboard in Excel steps in. This ready-to-use dashboard empowers businesses to measure, monitor, and improve their sales and marketing performance all in one place.
Whether you’re a sales manager trying to track conversion rates or a marketing executive focused on campaign performance, this dashboard brings together the most critical KPIs to drive strategic growth decisions.
Click to Purchases Sales and Marketing Growth Metrics KPI Dashboard in Excel
What Is a Sales and Marketing Growth Metrics KPI Dashboard?
A Sales and Marketing Growth Metrics KPI Dashboard is a centralized tool that consolidates all your sales and marketing KPIs (Key Performance Indicators) in one visually engaging interface. Built using Microsoft Excel, it leverages formulas, charts, and automation to turn raw data into actionable insights.
Unlike traditional spreadsheets, this dynamic dashboard is interactive and fully customizable. You can track monthly progress, analyze trends, and compare results with historical and target data in just a few clicks.
Key Features of the Dashboard Template
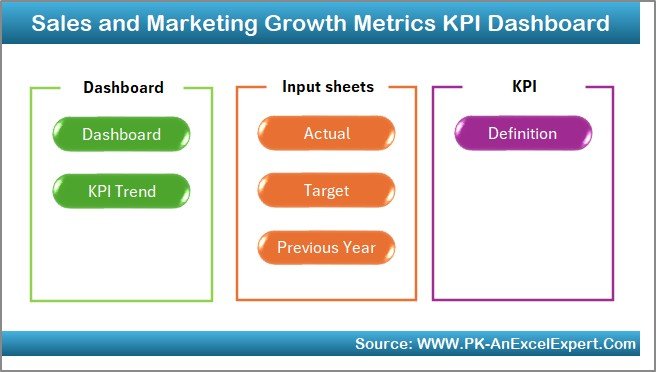
This powerful Excel dashboard template includes seven well-structured worksheets, each designed for a specific function:
Home Sheet
- Acts as the index page
- Provides buttons for easy navigation to all other sheets
- Offers a user-friendly interface to improve usability
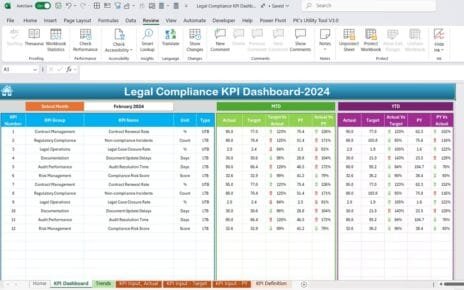
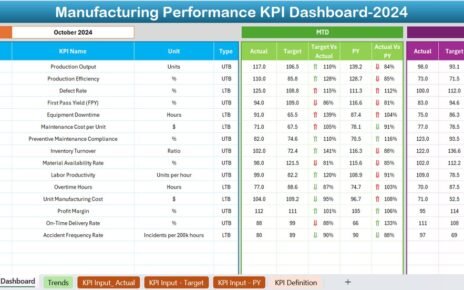
Dashboard Sheet Tab

- The main visual interface of the tool
- Allows you to select the month from a drop-down (cell D3)
Dynamically displays:
- MTD (Month-To-Date) Actual, Target, and Previous Year data
- YTD (Year-To-Date) Actual, Target, and Previous Year data
Shows comparison indicators:
- Target vs. Actual
- Previous Year vs. Actual
- Conditional formatting with up/down arrows for quick visual cues
KPI Trend Sheet Tab

- Select the KPI from the drop-down in cell C3
Displays:
- KPI Group
- Unit
- KPI Type (UTB/LTB)
- KPI Formula and Definition
- Presents trend charts for MTD and YTD across Actual, Target, and PY
Actual Numbers Input Sheet

- Enter actual performance data monthly
- Uses cell E1 to define the first month of the year for dynamic updates
- Helps update all dependent sheets automatically
Click to Purchases Sales and Marketing Growth Metrics KPI Dashboard in Excel
Target Sheet Tab

- Input monthly target values for each KPI (both MTD and YTD)
- Keeps the dashboard goal-focused
Previous Year Number Sheet Tab

- Enter the prior year’s performance figures here
- Enables accurate year-over-year comparisons
KPI Definition Sheet Tab

Contains metadata about each KPI
Includes fields like:
- KPI Name
- Group
- Unit
- Formula
- Definition
Why You Need a Sales and Marketing KPI Dashboard
Still wondering why this dashboard is a must-have for your team? Let’s break it down:
- Simplifies complex data: Consolidates your entire sales and marketing performance into a single sheet.
- Boosts accountability: Everyone sees what’s being measured and how performance stacks up.
- Promotes timely decisions: With real-time visuals and trends, you’re always ahead.
- Improves alignment: Both sales and marketing teams get on the same page.
Advantages of Sales and Marketing Growth Metrics KPI Dashboard
🔄 Real-Time Tracking: Track live data across months without the need for external tools.
🌐 Universal Accessibility: Works on any system with Microsoft Excel. No need for cloud tools.
✨ Visual Insights: Charts and arrows make trends easy to digest at a glance.
⚖️ Data-Driven Decision Making: Helps teams focus on what matters most.
✏️ Easy Customization: Add new KPIs, adjust formulas, or switch themes easily.
Best Practices for Using This KPI Dashboard
To get the most value from this template, consider the following best practices:
- Keep your data updated: Regularly enter MTD and YTD values for accuracy.
- Define SMART targets: Ensure your goals are Specific, Measurable, Achievable, Relevant, and Time-bound.
- Involve your team: Make sure both sales and marketing teams contribute to data entry.
- Review trends monthly: Use the KPI Trend tab to analyze patterns and identify anomalies.
- Refine KPIs quarterly: Your business evolves, and your KPIs should too.
Frequently Asked Questions (FAQs)
What KPIs are included in this dashboard?
This template includes KPIs like Sales Growth Rate, Customer Acquisition Cost, Lead Conversion Rate, Return on Marketing Investment, and more. Each KPI is categorized under groups like Sales Performance, Campaign Effectiveness, and Customer Metrics.
Can I customize the KPIs or add new ones?
Absolutely. You can add new KPIs in the KPI Definition tab and reflect them in the Actual, Target, and Previous Year sheets.
Does this dashboard require Excel Macros?
No, the current version runs without macros. However, advanced users can add VBA automation if needed.
Is the dashboard compatible with older versions of Excel?
Yes, it’s compatible with Excel 2013 and above. Ensure your version supports dynamic formulas and charts.
Can I use this dashboard for quarterly or weekly tracking?
Currently, it’s designed for monthly tracking. But you can modify the structure to accommodate different timeframes.
How often should I update the dashboard?
Update the MTD and YTD values every month to keep the insights fresh and relevant.
Conclusion
The Sales and Marketing Growth Metrics KPI Dashboard in Excel is more than a spreadsheet. It’s a strategic tool designed to align teams, track goals, and accelerate performance. By organizing key data into an easy-to-use format, this dashboard simplifies decision-making and fuels growth.
Click to Purchases Sales and Marketing Growth Metrics KPI Dashboard in Excel
Visit our YouTube channel to learn step-by-step video tutorials