In today’s data-driven world, tracking your sales and marketing operations is not just an option—it’s a necessity. Businesses that monitor key performance indicators (KPIs) regularly are more likely to make smart, strategic decisions. That’s where the Sales and Marketing Operations KPI Dashboard in Excel comes into play. This powerful Excel-based dashboard helps you consolidate your performance data, track progress, and measure success with ease.
Let’s walk through everything you need to know about this dashboard, including its structure, how to use it, best practices, and more.
Click to Purchases Sales and Marketing Operations KPI Dashboard in Excel
What is a Sales and Marketing Operations KPI Dashboard?
A Sales and Marketing KPI Dashboard is a tool used to track and visualize the performance of your sales and marketing activities. It provides an overview of important metrics such as monthly sales, leads generated, conversion rates, and campaign performance.
When built in Excel, this dashboard becomes both flexible and customizable—perfect for any business size or industry.
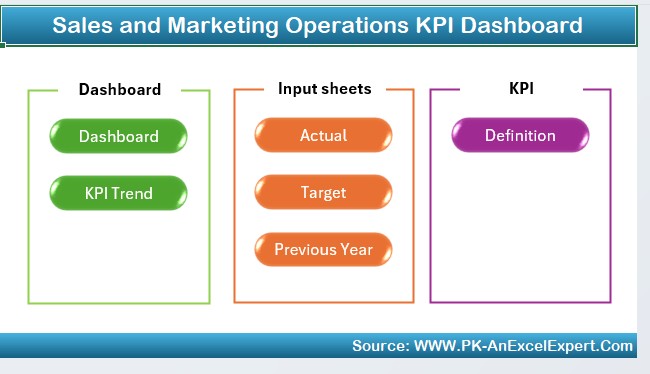
Key Components of the Dashboard
This Sales and Marketing Operations KPI Dashboard in Excel includes 7 powerful worksheets that work together seamlessly:
Home Sheet (Navigation Panel)
- Acts as the central index
- Includes 6 clickable buttons that allow quick access to each dashboard component
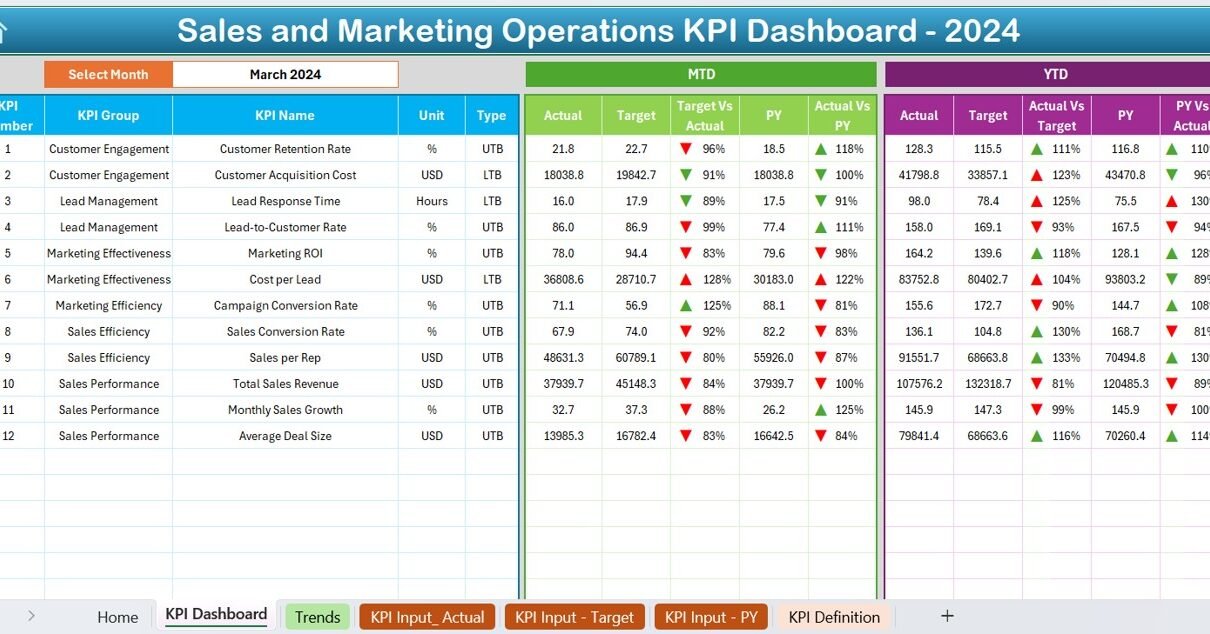
Dashboard Sheet
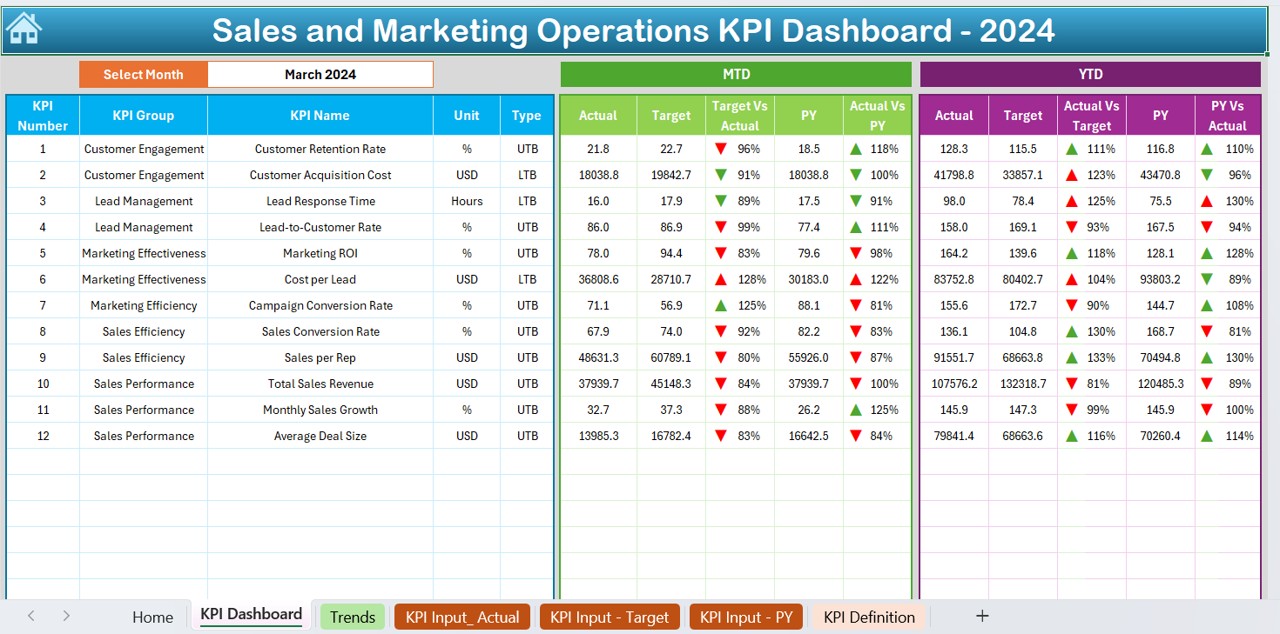
- The main dashboard interface
- Select a specific month from cell D3 to view dynamic results
Displays:
- MTD (Month-to-Date) values: Actual, Target, Previous Year
- YTD (Year-to-Date) values: Actual, Target, Previous Year
- Comparative metrics with conditional formatting (up/down arrows)
KPI Trend Sheet
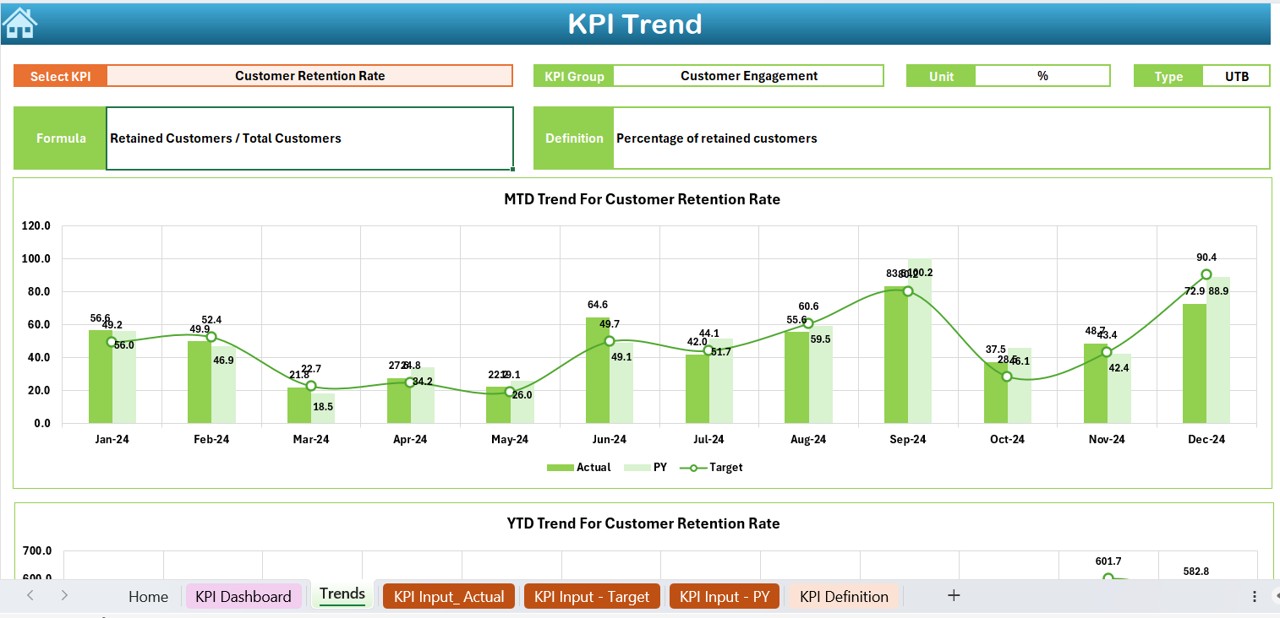
- Interactive KPI selector in cell C3
- Displays detailed information:
- KPI Group, Unit, Type (UTB/LTB), Formula, and Definition
- Trend charts for MTD and YTD performance vs. targets and previous year
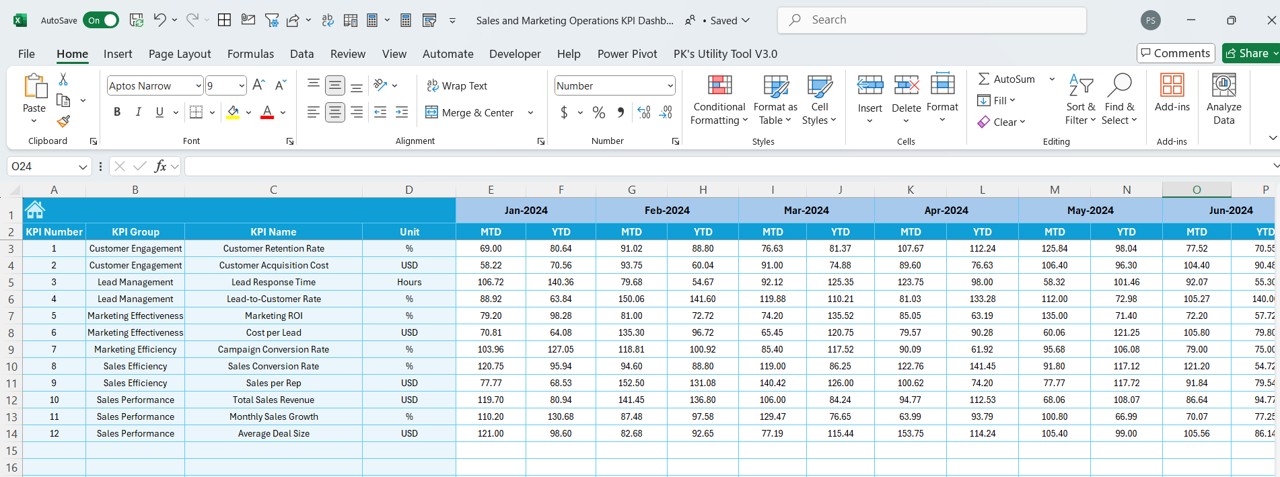
Actual Numbers Input Sheet
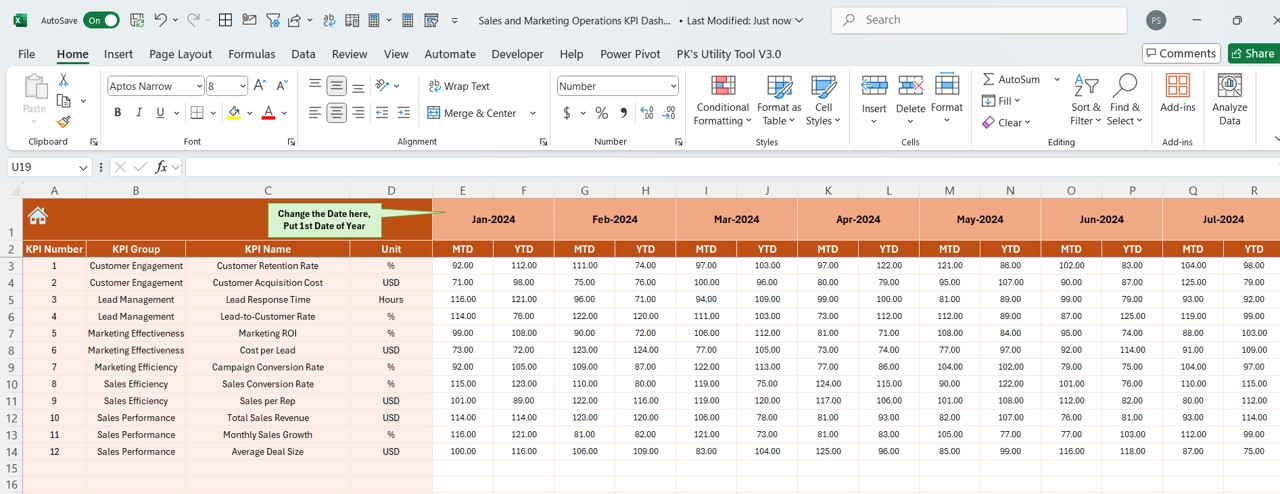
- Update actual KPI values here for both MTD and YTD
- Change the reporting month from cell E1
- Automatically updates dashboard visuals based on entered values
Click to Purchases Sales and Marketing Operations KPI Dashboard in Excel
Target Sheet
- Input target values per KPI for each month (MTD and YTD)
- Acts as your benchmark sheet for measuring performance
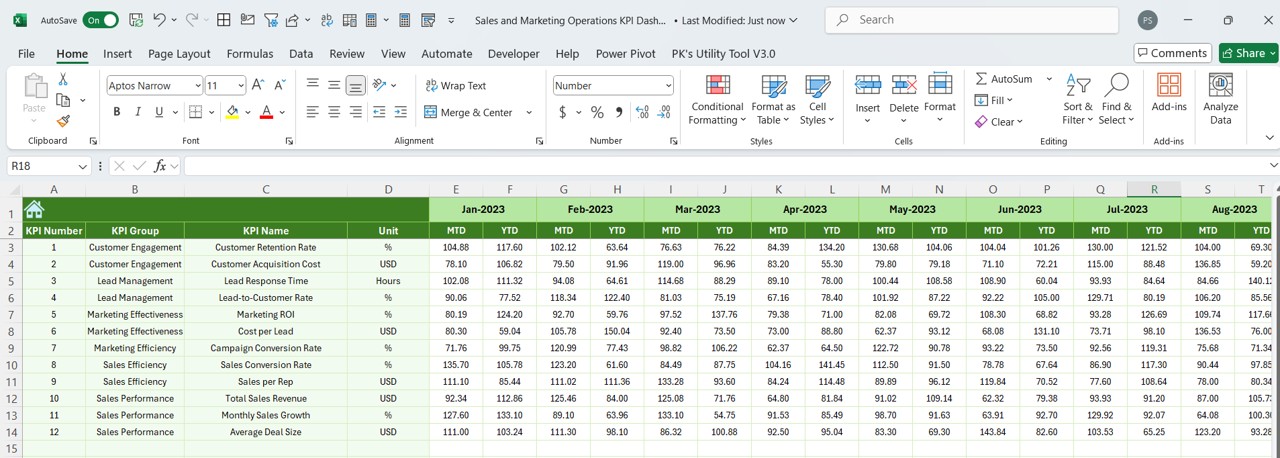
Previous Year Number Sheet
- Enter last year’s MTD and YTD figures for comparison
- Helps identify year-over-year growth or decline
KPI Definition Sheet
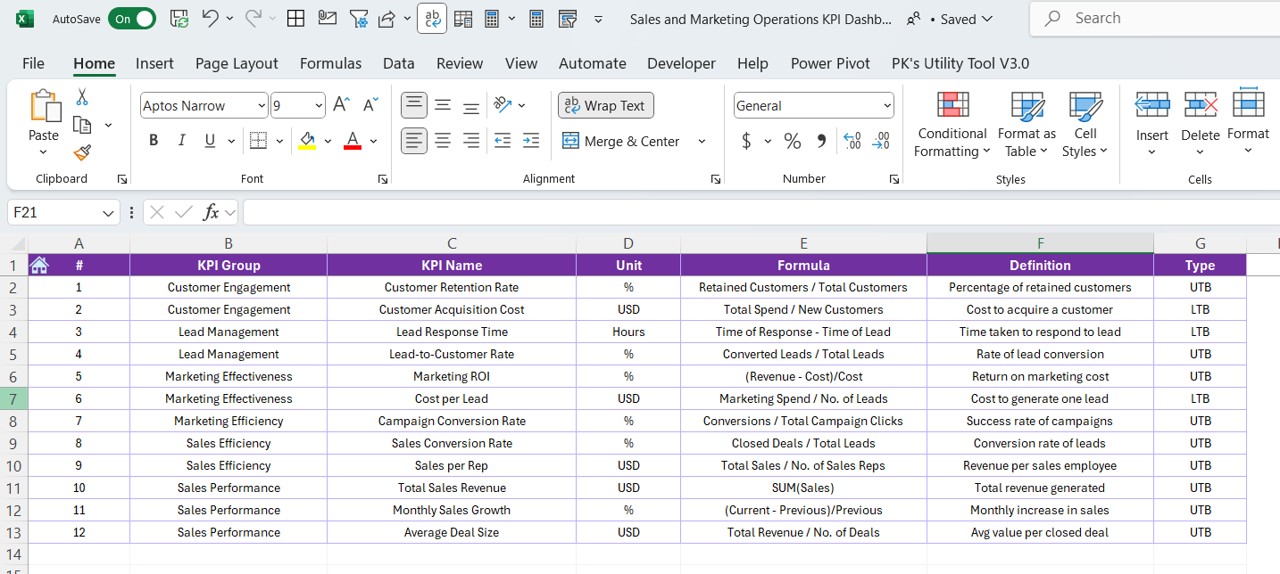
Stores all metadata for each KPI
Includes:
- KPI Name
- KPI Group
- Unit of Measurement
- Formula
- Short KPI Definition
Advantages of Using a Sales and Marketing Operations KPI Dashboard
Using this Excel dashboard provides multiple benefits for your team:
✨ Centralized Data View: No more hunting for numbers in multiple sheets or systems
💡 Quick Decision-Making: Easily identify which campaigns or sales efforts need more attention
📊 Better Performance Tracking: See both MTD and YTD progress side-by-side
⏳ Saves Time: Auto-updating visuals reduce time spent on manual reporting
🌐 Fully Customizable: Adapt KPI definitions, formulas, and visuals to fit your unique business needs
Best Practices for Sales and Marketing KPI Tracking
To make the most of your dashboard, follow these expert tips:
✅ Keep KPI definitions clear and simple
📊 Avoid tracking too many KPIs—stick to the most impactful ones
🔄 Review data monthly for timely decisions
📊 Visualize progress with charts and color indicators (like conditional formatting)
🔎 Validate data regularly to ensure accurate results
💻 Back up your dashboard file regularly to avoid data loss
❓ Frequently Asked Questions (FAQs)
What is the difference between MTD and YTD in this dashboard?
MTD stands for Month-to-Date, reflecting values from the beginning of the month to the current date. YTD means Year-to-Date, showing cumulative values since the start of the year.
What does LTB and UTB mean in KPI tracking?
LTB means Lower the Better, useful for tracking metrics like costs or downtime. UTB stands for Upper the Better, ideal for metrics like sales, revenue, and leads.
Can I customize this dashboard for my specific business needs?
Absolutely! You can edit KPI names, formulas, and visuals. The dashboard is built in Excel and can be easily adapted.
Is there a learning curve to using this dashboard?
If you are familiar with basic Excel operations, using this dashboard will be a breeze. Each sheet is self-explanatory and designed for easy navigation.
Can this dashboard be shared with my team?
Yes, it can be shared like any Excel file. For best results, use shared drives or cloud storage with version control.
Conclusion
A well-designed Sales and Marketing Operations KPI Dashboard in Excel can make a huge difference in how you track, analyze, and act on your performance metrics. This dashboard template empowers your team with real-time insights and helps you stay on track with business goals.
Click to Purchases Sales and Marketing Operations KPI Dashboard in Excel
Visit our YouTube channel to learn step-by-step video tutorials