In today’s fast-paced business world, tracking product development performance across sales and marketing is crucial. Whether you’re a product manager, sales strategist, or marketing lead, having a clear view of key performance indicators (KPIs) helps teams align goals, make faster decisions, and boost productivity. One of the most efficient ways to do this is by using a Sales and Marketing Product Development KPI Dashboard in Excel.
This article dives deep into how this dashboard works, why it matters, and how you can implement and benefit from it. We also explore best practices and answer frequently asked questions to help you get the most out of your KPI tracking system.
Click to Purchases Sales and Marketing Product Development KPI Dashboard in Excel
What is a Sales and Marketing Product Development KPI Dashboard?
A Sales and Marketing Product Development KPI Dashboard is a visual Excel tool that helps track and analyze performance indicators tied to the development and success of products across sales and marketing functions.
This dashboard lets you:
- Monitor Month-to-Date (MTD) and Year-to-Date (YTD) metrics.
- Compare Actual, Target, and Previous Year (PY) numbers.
- Identify performance gaps and improvement areas.
- Stay aligned with strategic goals.
With its Excel-based layout, even non-technical users can easily access, update, and share KPI data.
Why Do You Need a KPI Dashboard in Excel?
Excel remains one of the most accessible and powerful tools for data visualization and analysis. A well-structured KPI dashboard helps teams:
- Centralize performance tracking
- Visualize progress clearly
- Encourage accountability
- Support data-driven decisions
When you integrate both sales and marketing KPIs in one dashboard, you ensure better collaboration and transparency across departments.
Key Features of the Sales and Marketing Product Development KPI Dashboard
This dashboard contains 7 well-structured worksheets, each serving a specific purpose:
Home Sheet
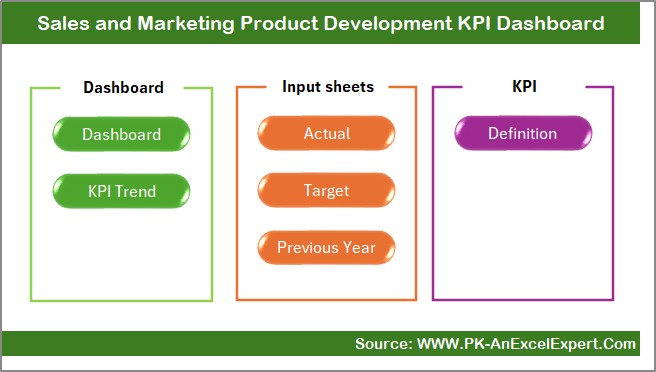
- Acts as an index or landing page.
- Includes 6 clickable buttons for easy navigation to different sheets.
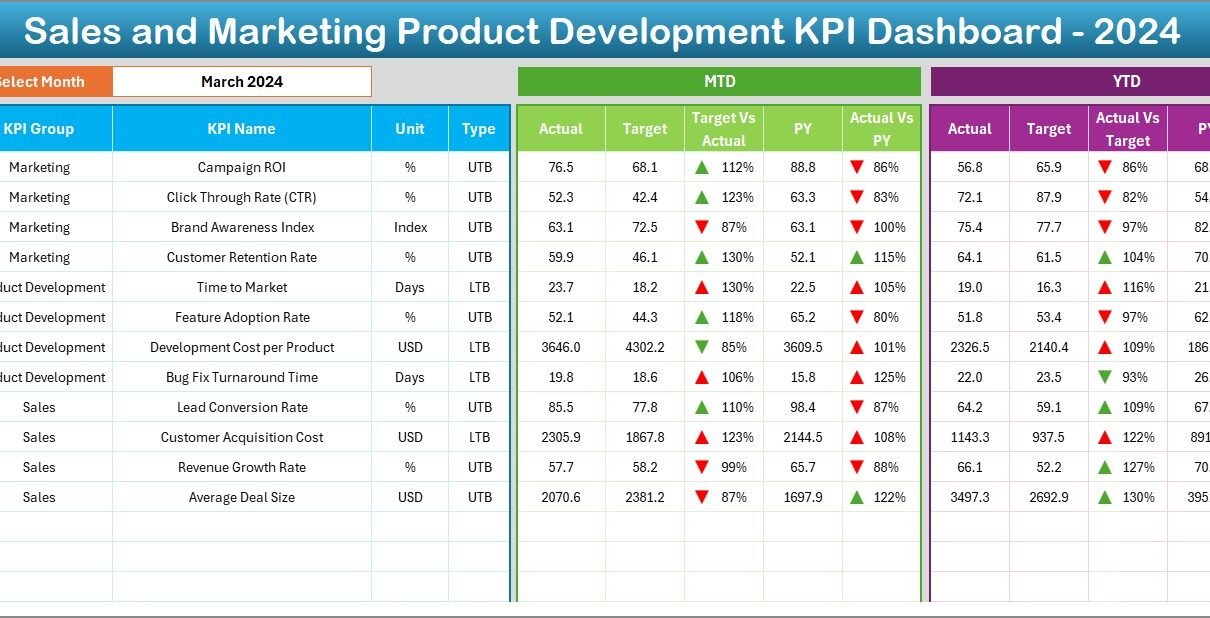
Dashboard Sheet
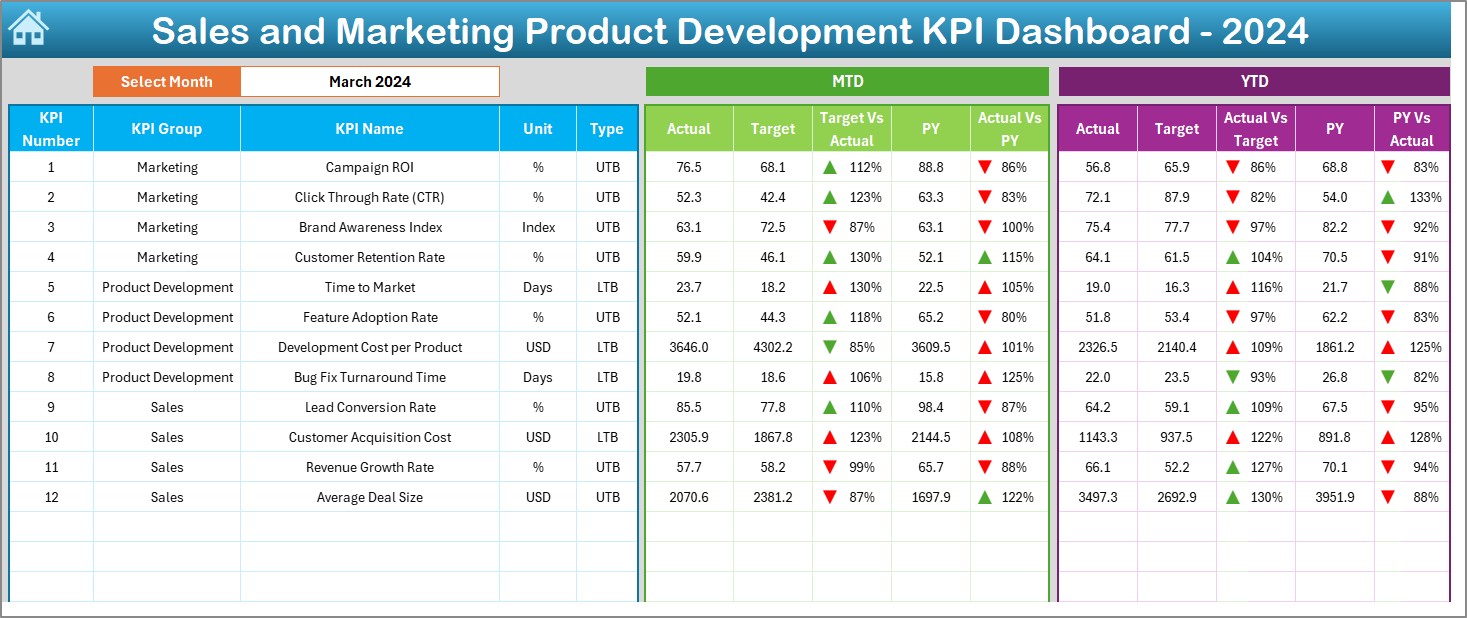
- The main visual area of the dashboard.
- Drop-down in cell D3 lets you select the month.
- Automatically updates KPI visuals for selected month.
Displays:
- MTD: Actual, Target, and PY values
- YTD: Actual, Target, and PY values
Conditional formatting with up/down arrows for quick insights
KPI Trend Sheet
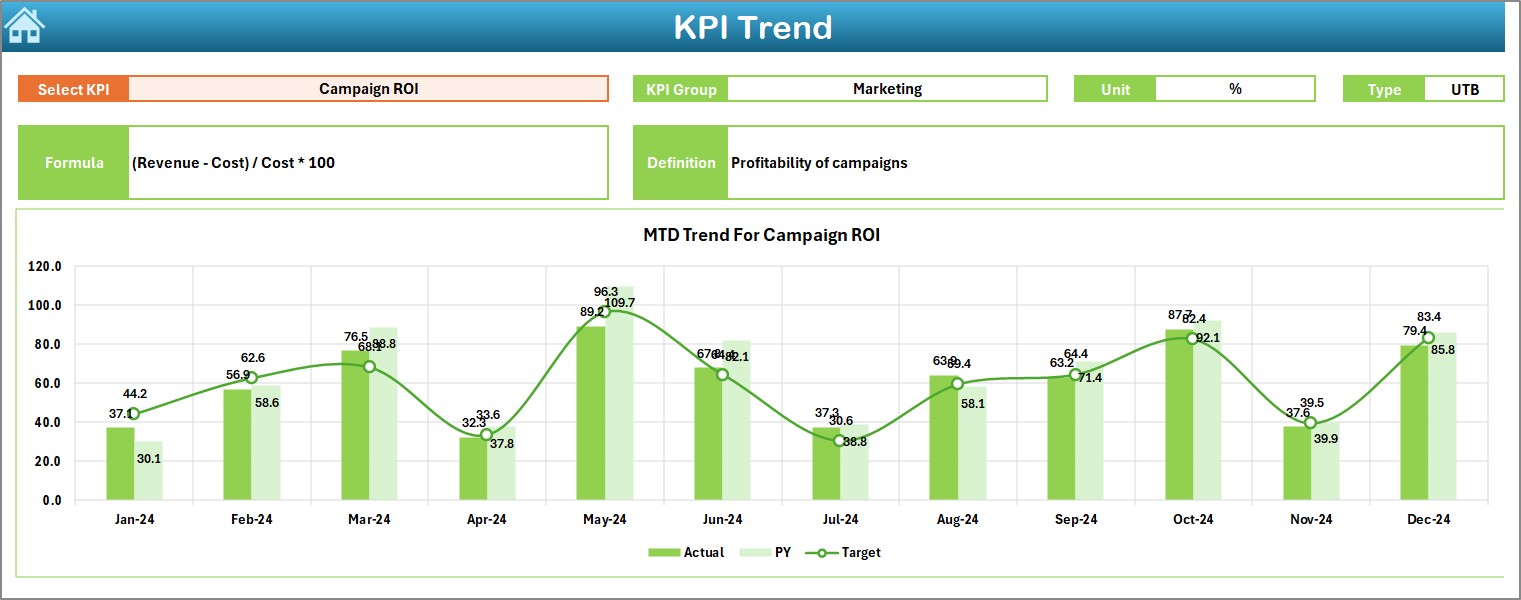
Choose a KPI from the drop-down at cell C3.
View details such as:
- KPI Group
- Unit
- Type (LTB or UTB)
- Formula
- Definition
Includes MTD and YTD trend charts (Actual, Target, PY)
Actual Numbers Input Sheet
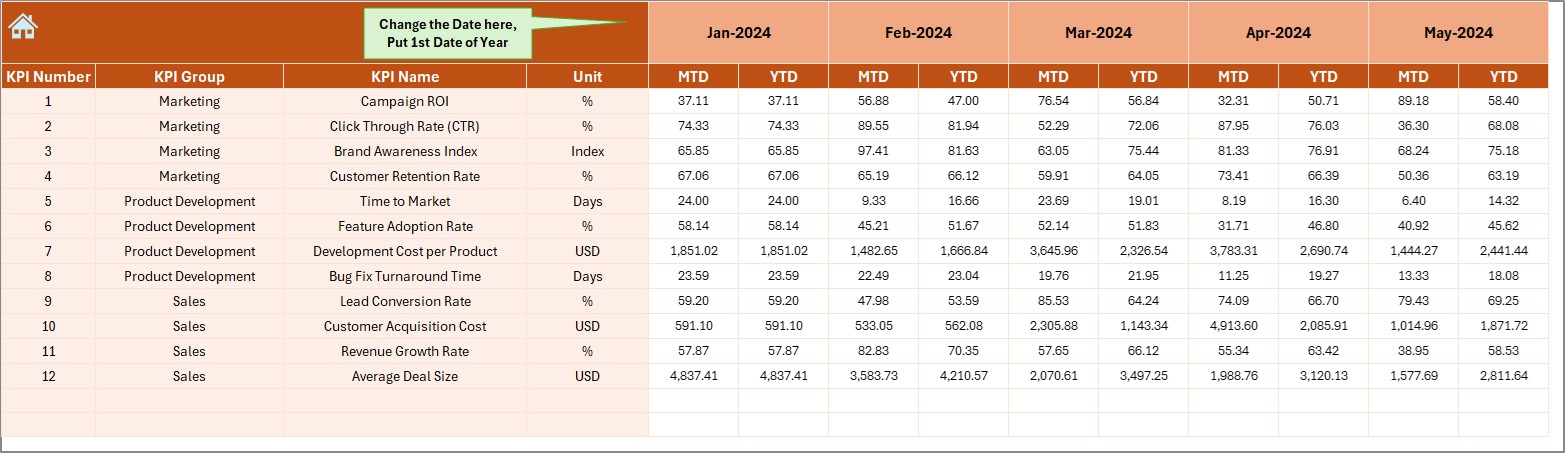
- Input actual MTD and YTD data for each KPI.
- Change base month using cell E1.
Target Sheet
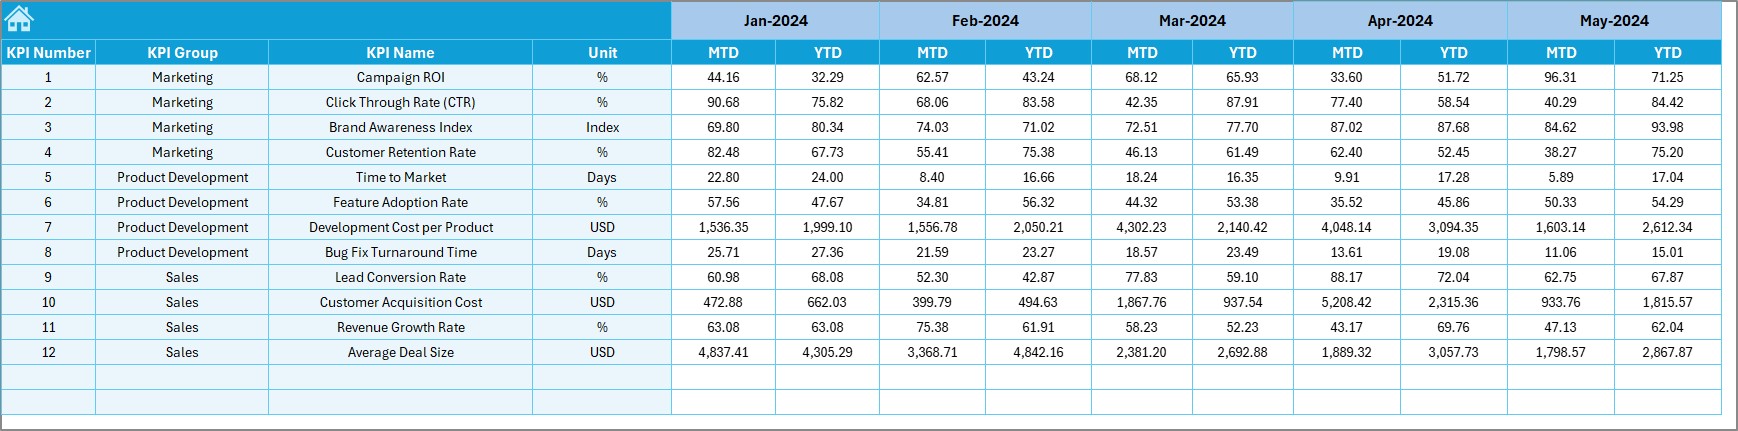
- Enter monthly target values for all KPIs.
- Input both MTD and YTD values.
Previous Year Number Sheet
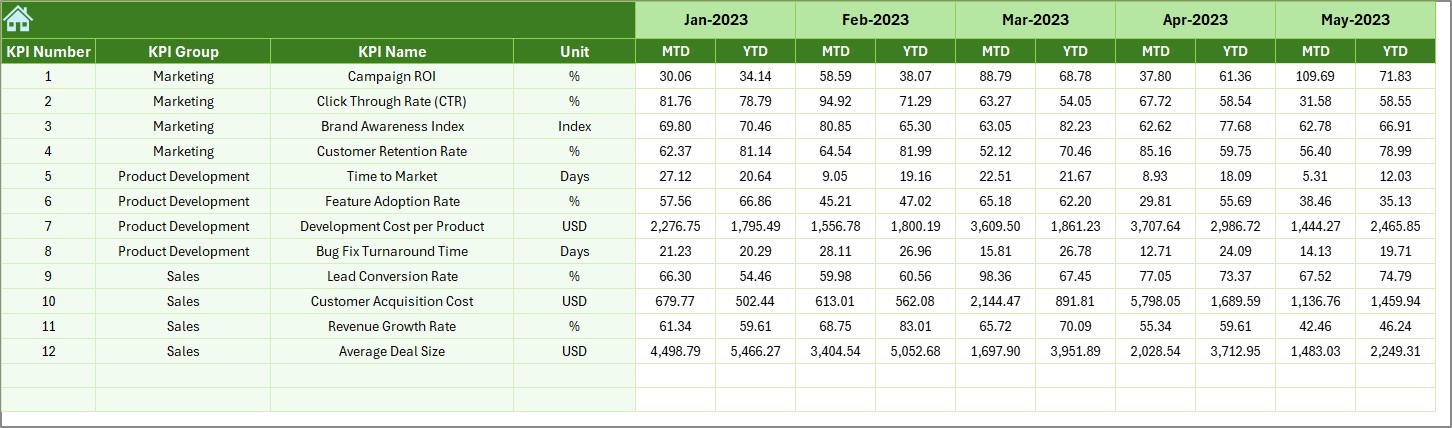
- Record previous year’s performance figures.
- Structure matches the current year data.
KPI Definition Sheet
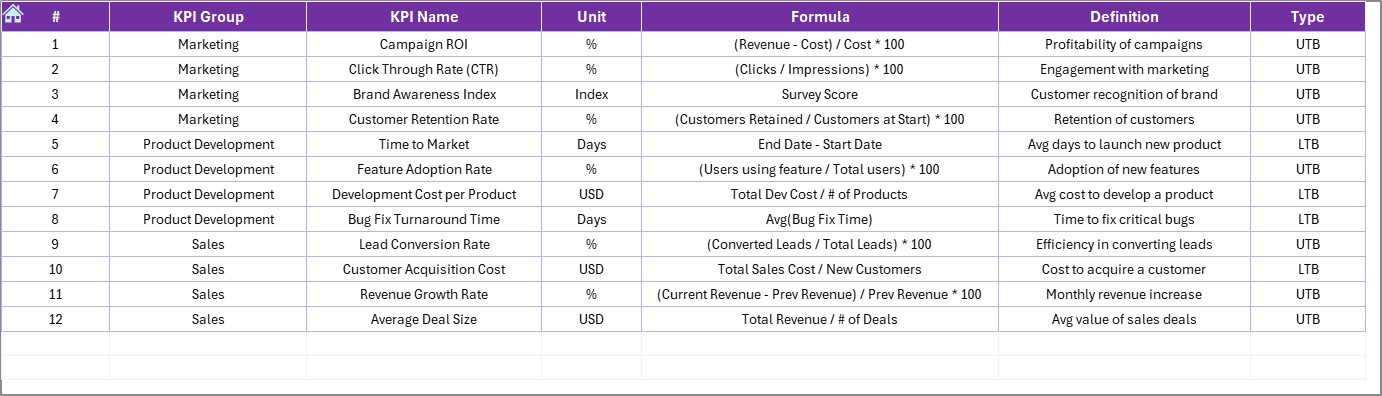
Maintain a complete database of your KPIs.
Click to Purchases Sales and Marketing Product Development KPI Dashboard in Excel
Columns include:
- KPI Name
- KPI Group
- Unit
- Formula
- Definition
Advantages of Using a Sales and Marketing Product Development KPI Dashboard
✅ Real-Time Decision Making: The dashboard updates instantly based on user input or selection, enabling faster decisions.
✅ Departmental Alignment: Combining sales and marketing KPIs in one dashboard aligns cross-functional goals.
✅ Simplified Reporting: Eliminates the need for manual reports with automated visuals and summaries.
✅ Customizable and Scalable: Easily add more KPIs, customize visuals, or modify definitions without major redesigns.
✅ User-Friendly Interface: Thanks to Excel’s familiar layout and drop-down controls, anyone on your team can use it.
Best Practices for Sales and Marketing KPI Dashboards
To make the most of your dashboard, follow these proven practices:
- Define KPIs Clearly: Ensure each KPI has a clear goal, formula, and owner. Use the “KPI Definition” sheet to manage this.
- Review Monthly: Use the drop-down month selector to review KPIs each month and spot changes early.
- Input Data Consistently: Maintain a routine for entering actual, target, and previous year data. Avoid delays to ensure up-to-date visuals.
- Keep the Layout Simple: Don’t overload the dashboard with too many charts. Focus on the most important KPIs first.
- Use Conditional Formatting Wisely: The use of arrows to show trends helps users quickly identify performance changes.
- Communicate Insights: Encourage regular meetings to discuss the dashboard insights across sales and marketing teams.
Conclusion
A well-designed Sales and Marketing Product Development KPI Dashboard in Excel acts as the nerve center for product teams. By tracking vital metrics across marketing and sales, this tool fosters alignment, encourages data-driven strategies, and simplifies decision-making.
Because it’s built in Excel, it’s flexible, affordable, and scalable. Whether you are launching a new product or improving an existing one, this dashboard ensures you stay on top of every performance detail.
Start using this dashboard today and empower your team with the insights they need to deliver exceptional results.
Frequently Asked Questions (FAQs)
Can I customize the KPIs in this dashboard?
Yes. You can easily update the KPI Definition sheet to add, remove, or modify KPIs as per your business needs.
How do I change the start of the year in the dashboard?
Go to the “Actual Numbers Input” sheet and update the month in cell E1. The dashboard will adjust accordingly.
Is this dashboard suitable for small businesses?
Absolutely. The Excel format is user-friendly and cost-effective, making it ideal for businesses of any size.
Can I share this dashboard with my team?
Yes. You can share the Excel file through cloud platforms like OneDrive or Google Drive for real-time collaboration.
Do I need Excel expertise to use this dashboard?
Not at all. The dashboard includes simple drop-downs, input fields, and visual charts that anyone with basic Excel skills can use.
What if I want to track quarterly performance too?
You can extend the dashboard by adding new fields for quarterly summaries and aggregating monthly data accordingly.
How often should I update the actual and target data?
Monthly updates are ideal to stay current, though high-performing teams may choose to update it bi-weekly.
Click to Purchases Sales and Marketing Product Development KPI Dashboard in Excel
Visit our YouTube channel to learn step-by-step video tutorials
Watch the step-by-step video Demo: