In today’s competitive business world, optimizing your sales and marketing resources is no longer optional—it’s essential. Every decision, campaign, or investment must align with measurable outcomes. That’s where the Sales and Marketing Resource Allocation KPI Dashboard in Excel becomes a powerful ally. This user-friendly, data-driven Excel template helps teams monitor their performance, track trends, and allocate resources more effectively, all in one place.
This comprehensive article will walk you through everything you need to know about this dashboard—from its features to its benefits, best practices, and frequently asked questions. So, if you’re ready to improve the way your sales and marketing team works, keep reading.
Click to Purchases Sales and Marketing Resource Allocation KPI Dashboard in Excel
What is the Sales and Marketing Resource Allocation KPI Dashboard in Excel?
This dashboard is an Excel-based tool designed to track Key Performance Indicators (KPIs) that show how effectively your business allocates its sales and marketing resources. It provides a visual and analytical representation of metrics like:
- Sales revenue per campaign
- Marketing spend efficiency
- Lead conversion rates
- Customer acquisition cost
- ROI by channel
With clearly defined KPIs and interactive visuals, the dashboard helps decision-makers identify what’s working and where to improve.
Who Should Use This Dashboard?
This dashboard is ideal for:
- Sales and Marketing Managers
- Business Owners
- Operations Teams
- Consultants and Analysts
Whether you’re a startup or a large enterprise, this dashboard gives everyone the same level of insight to make data-backed decisions.
Key Features of the Sales and Marketing KPI Dashboard
This ready-to-use Excel dashboard includes 7 powerful worksheet tabs, each designed for clarity and automation.
Home Sheet
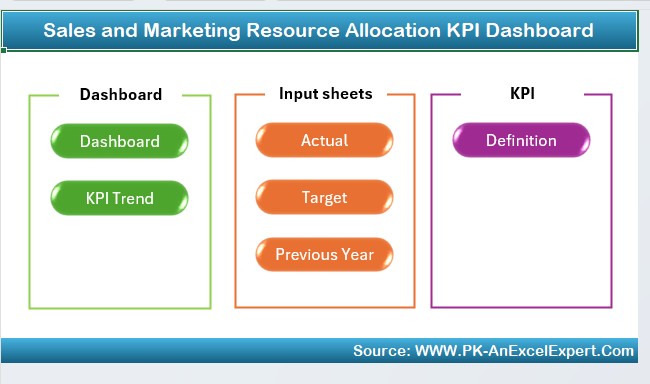
- Serves as the dashboard’s navigation center.
- Contains 6 quick-access buttons to jump to other sheets.
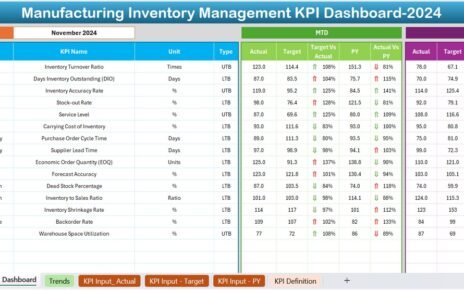
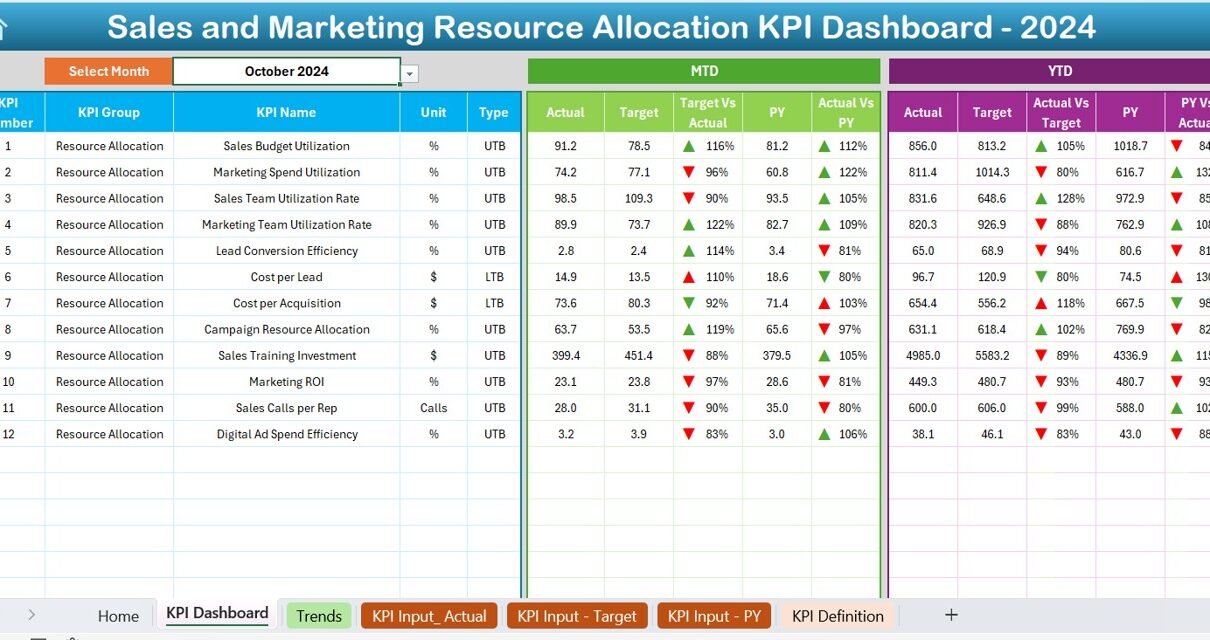
Dashboard Sheet
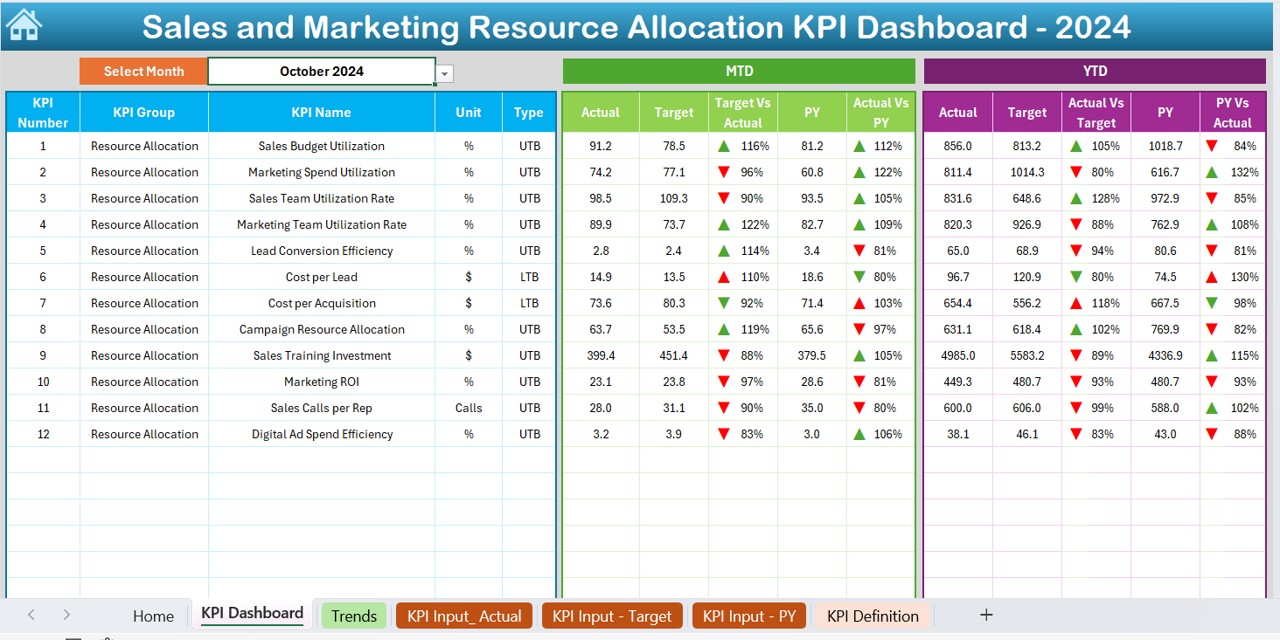
- This is the core visual reporting page.
- Select a month using the drop-down menu in D3.
Instantly view:
- MTD (Month-To-Date) Actual, Target, and Previous Year data
- YTD (Year-To-Date) summaries
- Visual arrows for performance comparison
KPI Trend Sheet
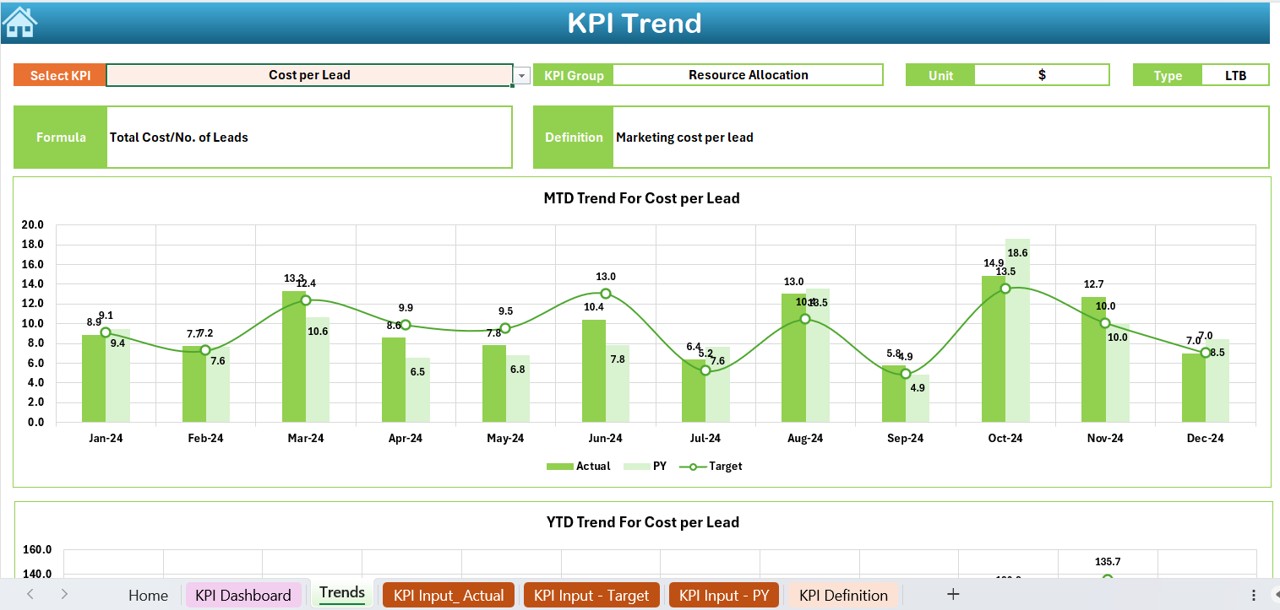
- Choose a KPI from the dropdown in C3.
- View KPI details: Group, Unit, Type (UTB or LTB), Formula, and Definition.
- Includes dynamic charts for MTD and YTD performance trends.
Click to Purchases Sales and Marketing Resource Allocation KPI Dashboard in Excel
Actual Numbers Input Sheet
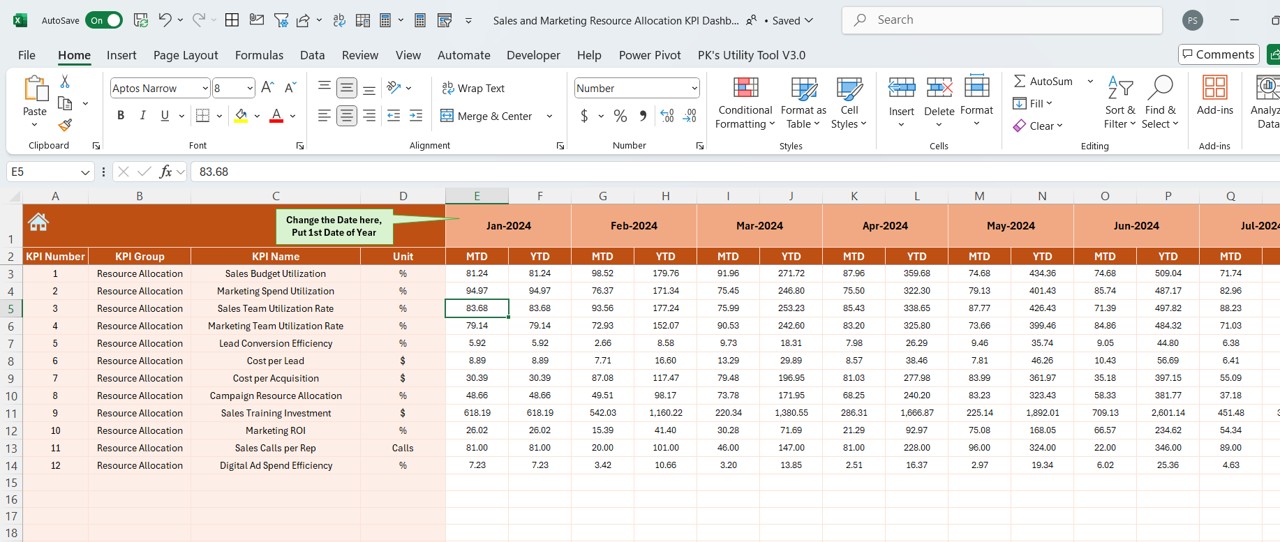
- Update monthly actual values.
- Change the start month using E1.
Target Sheet
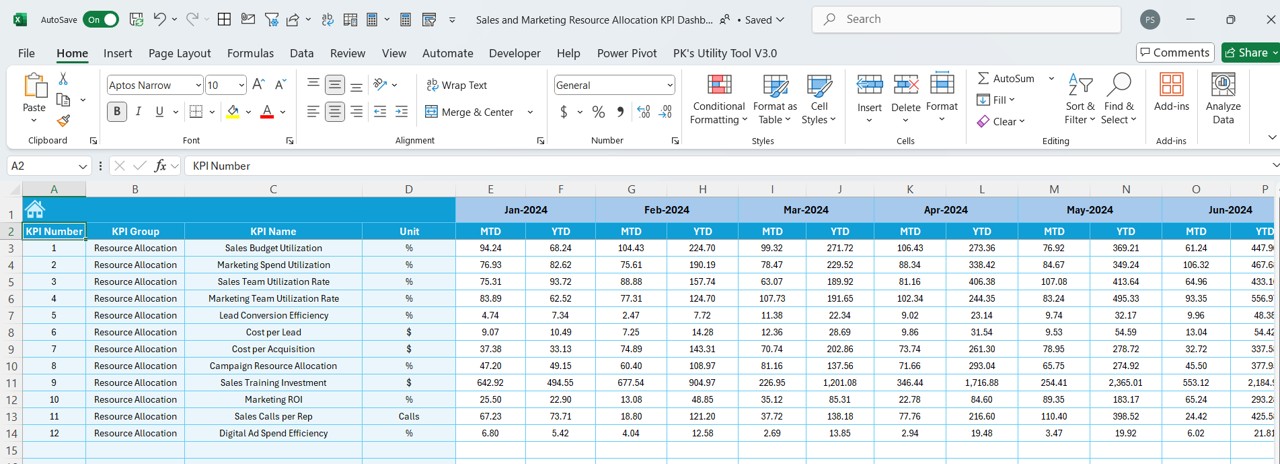
- Enter MTD and YTD targets for each KPI.
- Ensure every goal is clear and measurable.
Previous Year Number Sheet
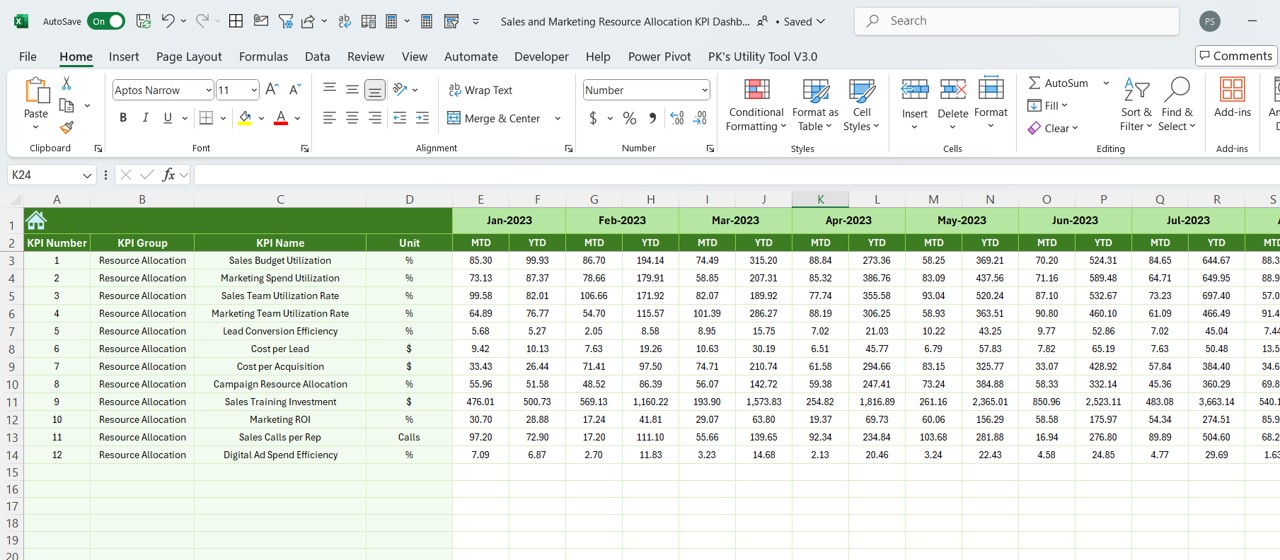
- Input historical data to compare year-over-year performance.
KPI Definition Sheet
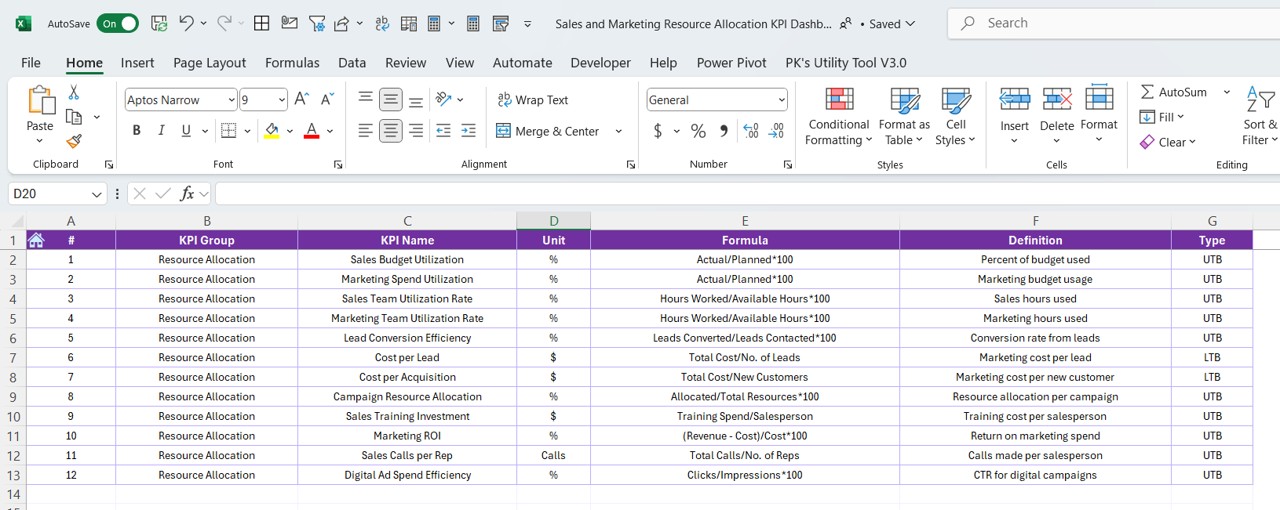
- Maintain a database of all KPIs: Name, Group, Unit, Formula, and Description.
- Keeps the dashboard consistent and easy to update.
Advantages of Using a Sales and Marketing Resource Allocation KPI Dashboard
✅ Improved Decision-Making Instantly compare actual vs. target vs. previous year data to make informed choices.
✅ Performance Visibility Quickly spot underperforming areas and redirect your resources.
✅ Goal Alignment Ensure all stakeholders are working toward the same objectives.
✅ Historical Comparisons Analyze how far you’ve come by checking trends and year-over-year growth.
✅ Simplified Reporting Present performance metrics in a clear, professional layout.
Best Practices for Using the Dashboard
To get the most out of your dashboard, follow these best practices:
- Keep Data Updated: Always enter your actuals, targets, and previous year data on time. This ensures your dashboard shows real-time insights.
- Define KPIs Clearly: Use the KPI Definition Sheet to ensure everyone understands what each metric means.
- Review Monthly: Hold monthly meetings to review trends, adjust strategies, and set new targets.
- Use Color-Coding Wisely: Highlight top-performing and underperforming KPIs using Excel’s conditional formatting.
- Avoid Overloading: Focus on high-impact KPIs. Too much data can cause confusion.
How Can This Dashboard Boost Your Sales and Marketing?
- This dashboard not only helps you track performance but also drive strategy. For example:
- You can see which campaign brings the most leads with the lowest cost.
- You can measure if reallocating budget from ads to influencer marketing improved ROI.
- You can forecast future sales based on monthly conversion trends.
- In short, it allows you to spend smarter and plan better.
Why Use Excel for a KPI Dashboard?
- Although many tools exist for KPI tracking, Excel remains a popular choice because:
- It’s widely accessible and requires no additional software.
- It supports custom formulas, charts, and conditional formatting.
- It’s perfect for custom reporting without monthly fees.
How to Customize This Dashboard?
- Even though it’s ready to use, the dashboard is fully customizable:
- Add your own KPIs in the Definition tab.
- Insert new columns for region- or team-level analysis.
- Change visuals to match your brand colors.
- Add slicers to filter by campaign, region, or salesperson.
- You don’t need to be an Excel wizard. The dashboard’s structure makes editing simple.
How to Ensure Data Accuracy in This Dashboard?
- Since decisions rely on your data, accuracy is critical. Follow these tips:
- Cross-check numbers with your CRM or accounting software.
- Lock formulas in the Dashboard and Trend sheets.
- Use data validation to avoid incorrect entries.
Collaboration Made Easy
You can share the file with your team via cloud tools like OneDrive or Google Drive. Since Excel supports simultaneous editing, multiple team members can update data without conflicts.
Final Thoughts
The Sales and Marketing Resource Allocation KPI Dashboard in Excel is more than a spreadsheet—it’s a strategic tool that empowers teams to make better decisions, track results, and grow revenue. With a well-structured layout, dynamic visuals, and practical inputs, this dashboard can truly transform the way your sales and marketing team operates.
If you’re ready to improve your performance visibility and allocate your resources more effectively, download and start using this dashboard today.
🧰 Frequently Asked Questions (FAQs)
Can I use this dashboard without advanced Excel skills?
Yes! This dashboard is beginner-friendly. Drop-downs, formulas, and visuals are already built in. You just need to input your data.
Is the dashboard suitable for small businesses?
Absolutely. It’s designed for both startups and large enterprises. You can scale it according to your data volume.
How often should I update the dashboard?
Monthly updates are ideal. However, for real-time tracking, you can update it weekly too.
Can I add more KPIs later?
Yes. Use the KPI Definition sheet to add new KPIs. Just make sure to link them properly across other sheets.
Does it support year-over-year comparison?
Yes, it includes dedicated columns and visuals to compare current performance with the previous year.
Can this dashboard track ROI by marketing channel?
Yes. You can define KPIs by channel and monitor ROI accordingly.
Can I share the dashboard with others?
Yes, you can share via email, cloud storage, or even embed it in internal tools like Microsoft Teams.
Click to Purchases Sales and Marketing Resource Allocation KPI Dashboard in Excel
Visit our YouTube channel to learn step-by-step video tutorials