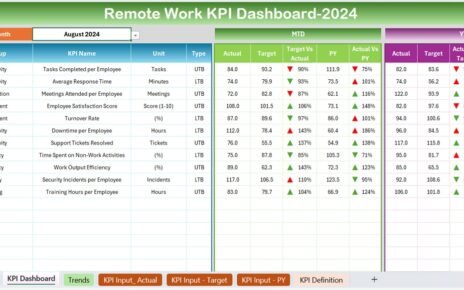
Home>Blogs>Charts and Visualization>Sales funnel infographic chart in Excel>Sales Funnel infographic Chart -4
Sales Funnel infographic Chart -4
17
Feb 2024
0Comments Off on Sales Funnel infographic Chart -4
PK
Meet PK, the founder of PK-AnExcelExpert.com! With over 15 years of experience in Data Visualization, Excel Automation, and dashboard creation. PK is a Microsoft Certified Professional who has a passion for all things in Excel. PK loves to explore new and innovative ways to use Excel and is always eager to share his knowledge with others. With an eye for detail and a commitment to excellence, PK has become a go-to expert in the world of Excel. Whether you're looking to create stunning visualizations or streamline your workflow with automation, PK has the skills and expertise to help you succeed. Join the many satisfied clients who have benefited from PK's services and see how he can take your Excel skills to the next level!
https://www.pk-anexcelexpert.com
Related Articles
MINIFS formula in Excel with Examples
If you're looking to simplify your data analysis in Excel, you've come to the right place! In this article, we'll
Investor Relations Calendar in Excel
In the fast-paced world of finance, investor relations (IR) teams are tasked with keeping stakeholders informed and up to date.
Income Dashboard in Excel
An income dashboard in Excel is a powerful tool that helps you track and analyze your income sources and financial