Creating and managing KPIs (Key Performance Indicators) is crucial to track the success of your sales strategies. A well-designed Sales KPI Dashboard in Excel can be the game-changer, providing a comprehensive overview of your business performance in one place. In this article, we will explore the structure, features, and best practices for creating and using a Sales KPI Dashboard in Excel.
What are a Sales KPI Dashboard?
Click to buy Sales KPI Dashboard in Excel
A Sales KPI Dashboard is a visual representation of key metrics used to monitor the performance of sales activities. It helps decision-makers analyse real-time data and trends, empowering them to make informed decisions. The dashboard typically includes metrics such as Monthly and Year-To-Date (YTD) performance, sales targets, comparisons with the previous year, and trend analysis.
Click to buy Sales KPI Dashboard in Excel
Key Features of the Sales KPI Dashboard in Excel
Our Sales KPI Dashboard template is designed to provide a user-friendly and practical solution. It includes 7 key worksheets to help businesses efficiently monitor KPIs and achieve their targets. Let’s explore each sheet in detail:
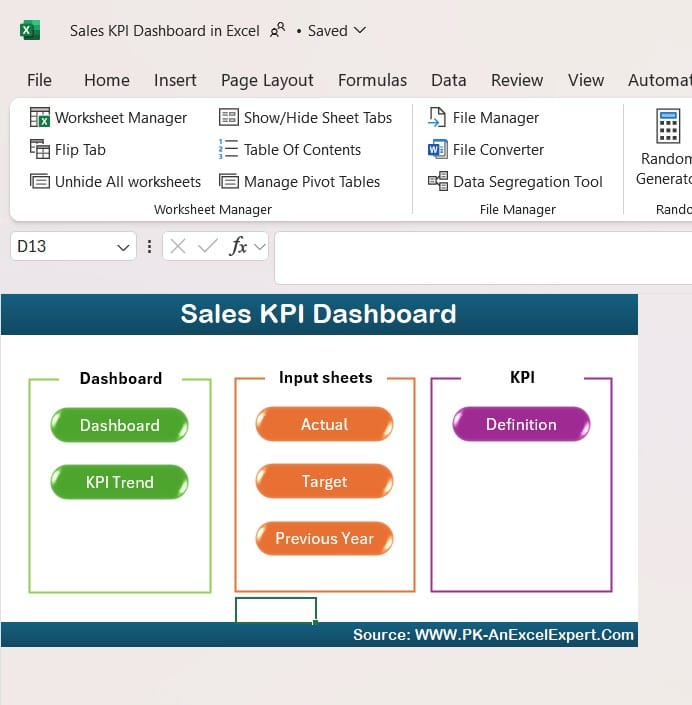
Home Sheet
Click to buy Sales KPI Dashboard in Excel
- The Home Sheet serves as a control panel with 6 buttons, allowing users to quickly navigate to different sheets within the dashboard.
- This makes it easier to find relevant information without scrolling through multiple tabs.
Dashboard Sheet Tab
Click to buy Sales KPI Dashboard in Excel
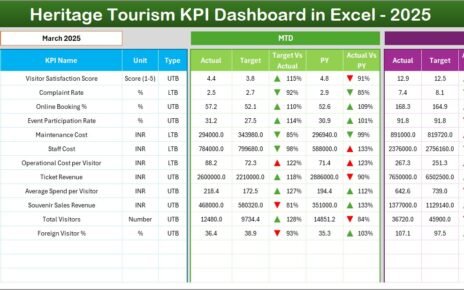
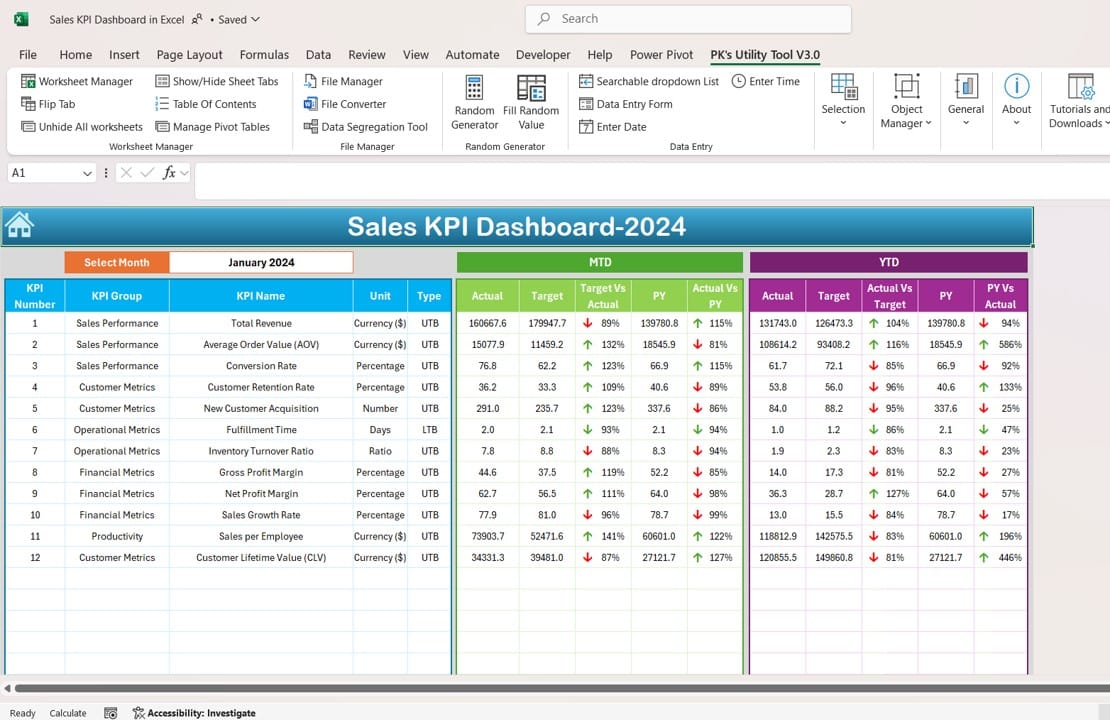
- This is the central hub where all KPI metrics are displayed for analysis.
- Users can select a month using the dropdown in range D3. The dashboard will automatically update the data to reflect the selected month’s performance.
-
Metrics Included:
- MTD (Month-to-Date): Displays actual sales, targets, and previous year data for the month selected.
- YTD (Year-to-Date): Summarizes performance from the start of the year to the selected month.
-
Conditional Formatting Arrows:
- Target vs Actual: Displays up/down arrows to visually indicate whether the actual performance is on track or below the target.
- Previous Year vs Actual: Similar arrows highlight the comparison with last year’s numbers.
Click to buy Sales KPI Dashboard in Excel
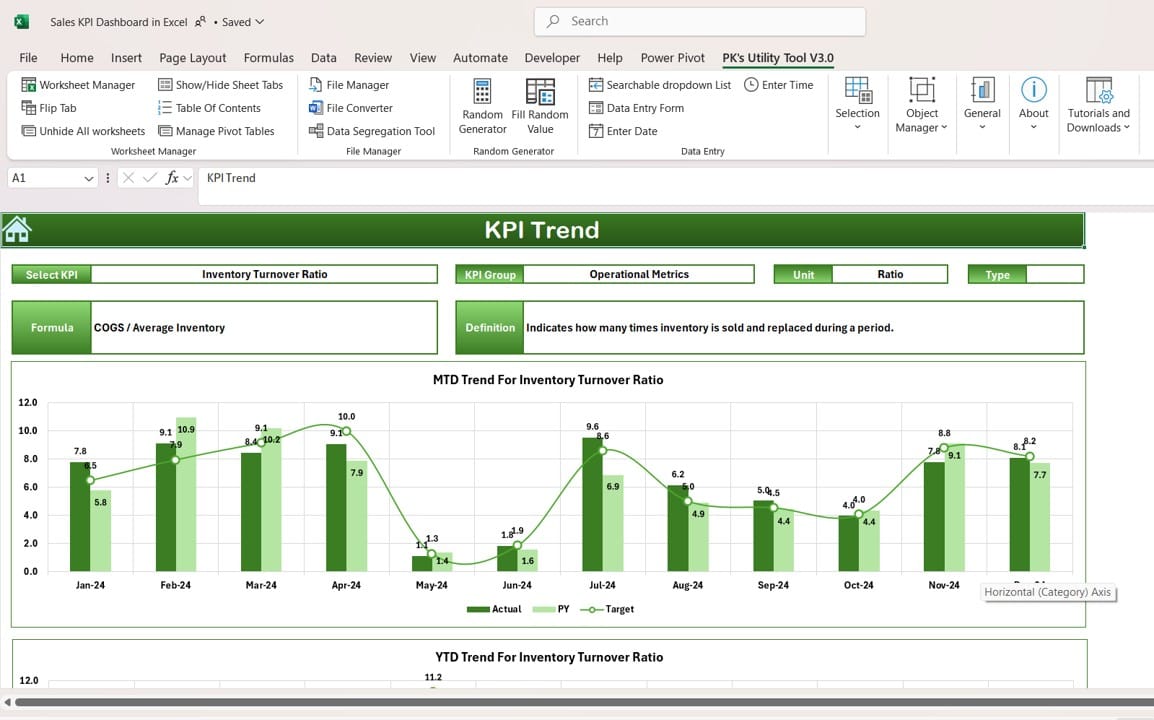
KPI Trend Sheet Tab
Click to buy Sales KPI Dashboard in Excel
- This tab offers trend analysis for individual KPIs. Users can select the KPI name from a dropdown (located at range C3).
- KPI Details Displayed:
- KPI Group
- Unit of Measurement
- KPI Type: Whether “Lower the Better” or “Upper the Better”.
- Formula and Definition: Offers clarity on how each KPI is calculated.
- MTD and YTD Charts: Displays the trend for Actual, Target, and Previous Year metrics, helping users visualize performance over time.
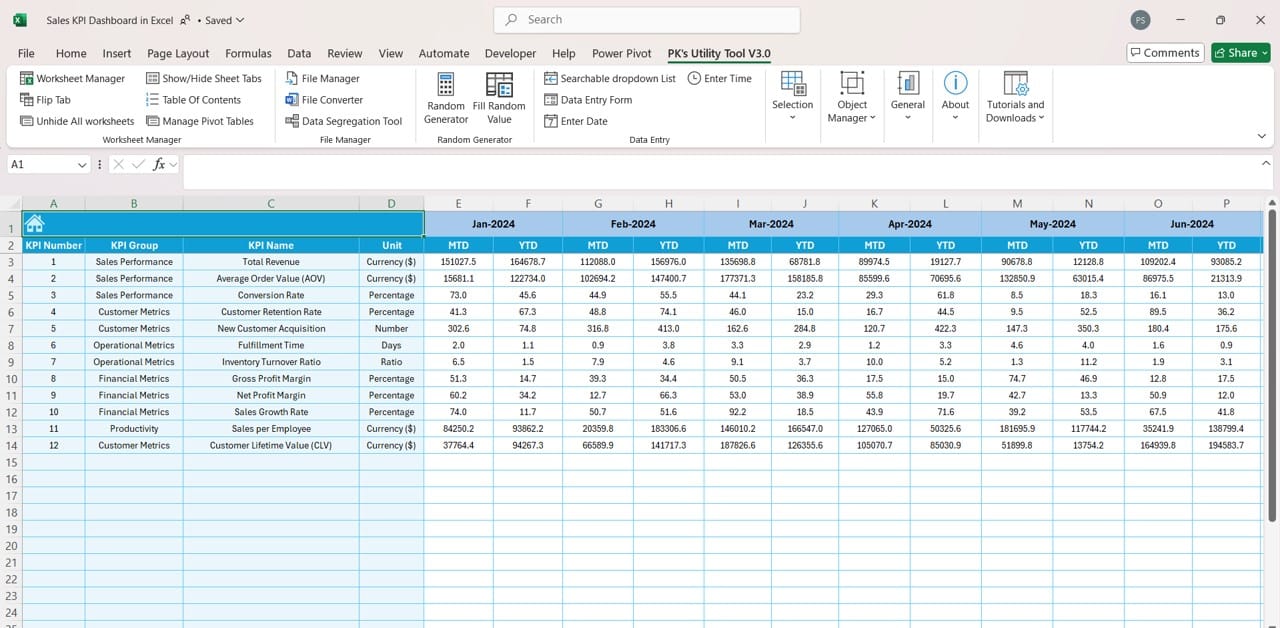
Actual Numbers Input Sheet

Actual Numbers Input
Click to buy Sales KPI Dashboard in Excel
- Users can enter the actual performance data for each KPI, both MTD and YTD.
- The month selection is available at range E1. By changing the value in E1, users can quickly update data across the dashboard.
Target Sheet Tab
Click to buy Sales KPI Dashboard in Excel
- This sheet helps users input monthly targets for each KPI.
- It accommodates both MTD and YTD targets, ensuring that businesses track progress comprehensively.
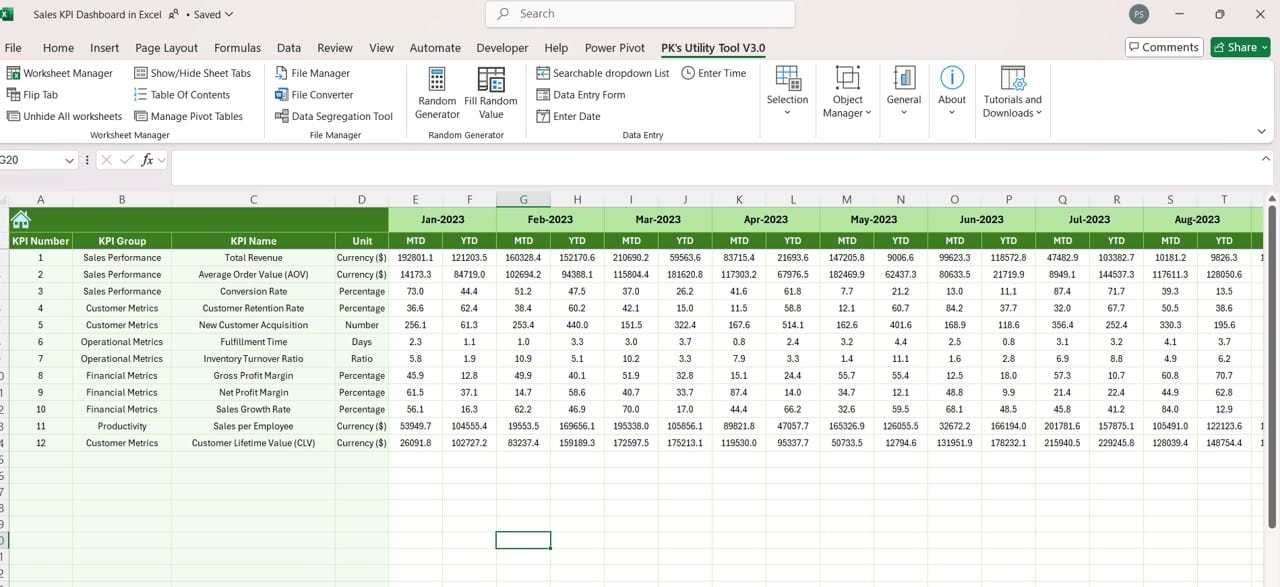
Previous Year Numbers Sheet Tab
Click to buy Sales KPI Dashboard in Excel
- This tab is dedicated to storing last year’s data.
- It mirrors the format of the current year’s input, ensuring an apples-to-apples comparison between this years and last year’s performance.
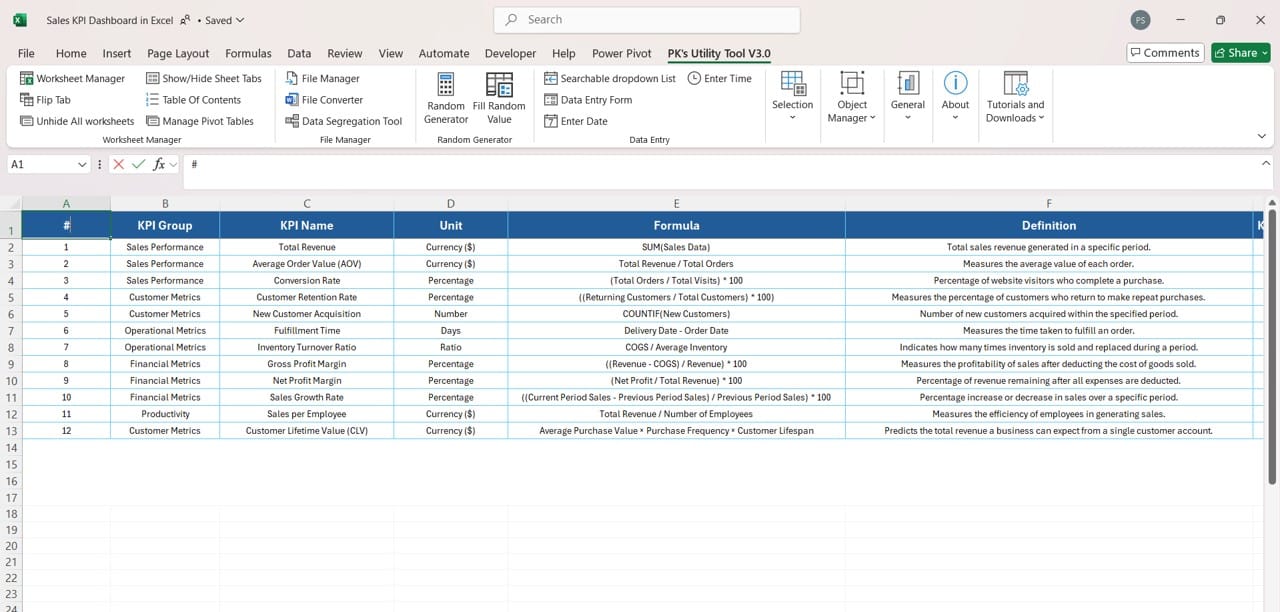
KPI Definition Sheet Tab
Click to buy Sales KPI Dashboard in Excel
- This sheet serves as a reference guide for all KPIs used in the dashboard.
- It includes essential information such as:
- KPI Name
- KPI Group and Unit
- Formula and KPI Definition
Click to buy Sales KPI Dashboard in Excel
Advantages of the Sales KPI Dashboard in Excel
- Easy Data Input: The template makes it simple to input actuals, targets, and previous year’s data.
- Real-Time Insights: Dropdowns and conditional formatting provide dynamic updates, ensuring accurate and current performance tracking.
- Comprehensive Analysis: The dashboard offers both MTD and YTD views, helping businesses monitor short-term and long-term goals simultaneously.
- Trend Visualization: The KPI Trend tab allows businesses to spot patterns and take corrective actions proactively.
Click to buy Sales KPI Dashboard in Excel
Opportunity for Improvement in Sales KPI Dashboard
While this Sales KPI Dashboard template is highly effective, there is always room for improvement. Here are a few areas where enhancements could be made:
- Automation with VBA: Automating the dashboard with VBA macros can streamline data updates and reduce manual work.
- Data Validation Checks: Implementing validation rules can help ensure accuracy in data input.
- Dynamic KPI Definitions: Allowing users to customize KPI formulas and definitions on the go would provide greater flexibility.
- Mobile-Friendly Design: Adapting the dashboard for mobile access can benefit remote teams and enhance accessibility.
Click to buy Sales KPI Dashboard in Excel
Best Practices for Using the Sales KPI Dashboard in Excel
- Set Clear Targets: Define realistic and measurable targets for each KPI to avoid ambiguity.
- Update Data Regularly: Ensure that actual numbers and targets are updated consistently to maintain data accuracy.
- Focus on Actionable Insights: Use the dashboard to identify areas where improvement is needed and take action accordingly.
- Engage Teams with Visuals: Utilize the trend charts and conditional formatting to keep stakeholders engaged with performance updates.
Click to buy Sales KPI Dashboard in Excel
Conclusion
A Sales KPI Dashboard in Excel is a powerful tool that offers a detailed view of sales performance. By consolidating key metrics and trends into one dashboard, businesses can stay on top of their goals and make timely decisions. The ability to switch between MTD and YTD views, coupled with dynamic trend analysis, makes this template invaluable for organizations of all sizes. Whether you need to analyse targets or compare performance with last year, this dashboard provides everything you need to track and achieve your sales objectives effectively.
Frequently Asked Questions (FAQs)
Q. How do I update the month in the Sales KPI Dashboard?
You can change the month by selecting it from the dropdown menu located at range D3 on the Dashboard sheet. The entire dashboard will refresh with the updated data for that month.
Q. Can I add more KPIs to the existing template?
Yes, you can easily add more KPIs. Make sure to update the KPI Definition Sheet, Target Sheet, and Actual Numbers Input Sheet with the new KPI data.
Q. How can I automate data input in the dashboard?
You can automate data entry using VBA macros. This will allow the dashboard to pull data directly from source files, reducing manual efforts.
Q. What if my sales data changes during the year?
If your sales data changes, simply update the Actual Numbers Input Sheet and Target Sheet. The dashboard will reflect the changes automatically.
Q. Can this dashboard be shared with other team members?
Yes, you can share the Excel file. However, ensure that team members have access to Excel or compatible software to use all features properly.
Click to buy Sales KPI Dashboard in Excel
This Sales KPI Dashboard in Excel is not just a reporting tool but a complete performance tracking system. By following the best practices and using this dashboard to its full potential, businesses can drive growth, improve team performance, and achieve their sales targets efficiently.
Visit our YouTube channel to learn step-by-step video tutorials
View this post on Instagram
Click to buy Sales KPI Dashboard in Excel