Sales tracking is very important for any business to scale and optimize its performance. Here, we have created a solution is the Sales Tracking Dashboard with Data Entry Form in Excel. In this guide, we will dive deep into how this ready-to-use template can streamline your sales management process.
Why Use a Sales Tracking Dashboard in Excel?
Before we explore the specifics of the template, let’s understand the benefits of using a sales tracking dashboard in Excel:
- Easy Access to Data: Excel is a widely accessible tool, making it easier for businesses of all sizes to manage their sales data without investing in expensive software.
- Customizable: With Excel, you have the freedom to modify dashboards and data sheets to suit your business’s specific needs.
- Automated Reporting: The data entry form automates the process of adding, updating, and deleting records, ensuring that your dashboard remains up-to-date with minimal manual effort.
Now, let’s explore the key features of the Sales Tracking Dashboard with Data Entry Form in Excel.
Key Features of the Sales Tracking Dashboard
In this template, we have 5 worksheets as given below:
1. Dashboard sheet tab:
Click to buy Sales Tracking Dashboard in Excel
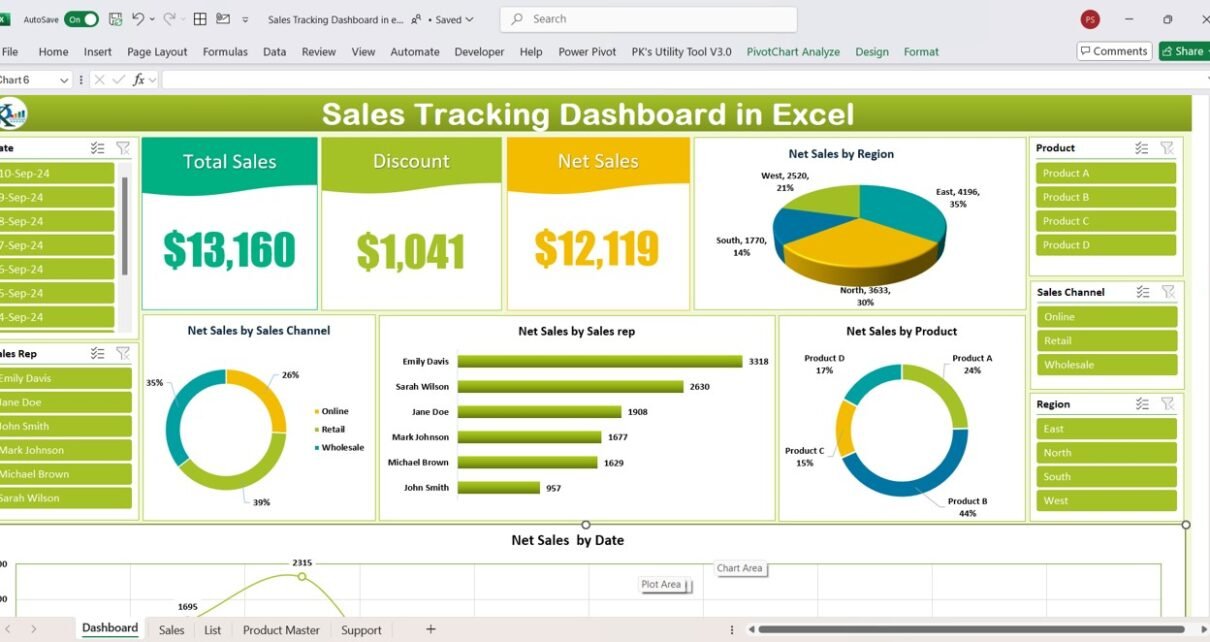
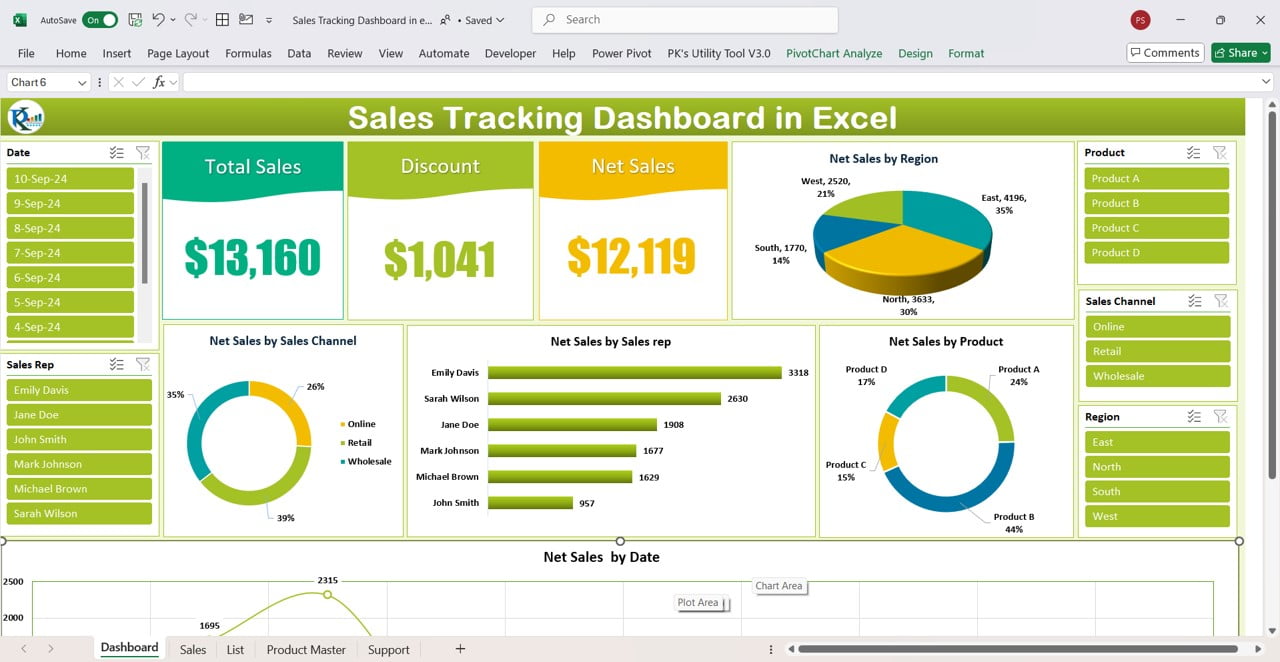
This is visual view of sales data. Here, we have multiple slicers to filter the data.
- Top section: we have 3 cards for Total Sales, Discount and Nets Sales. We have displayed a 3D pie chart for Net Sales by Region.
- Middle section: we have 3 charts as Doughnut charts for Net Sales by Sales Channel, Bar chart for Net Sales by Sales rep and Doughnut chart for Net Sales by Product.
- Bottom Section: In this section, we have Net sales trend chart. We are showing date wise net sales on a line chart.
2. Sales sheet tab:
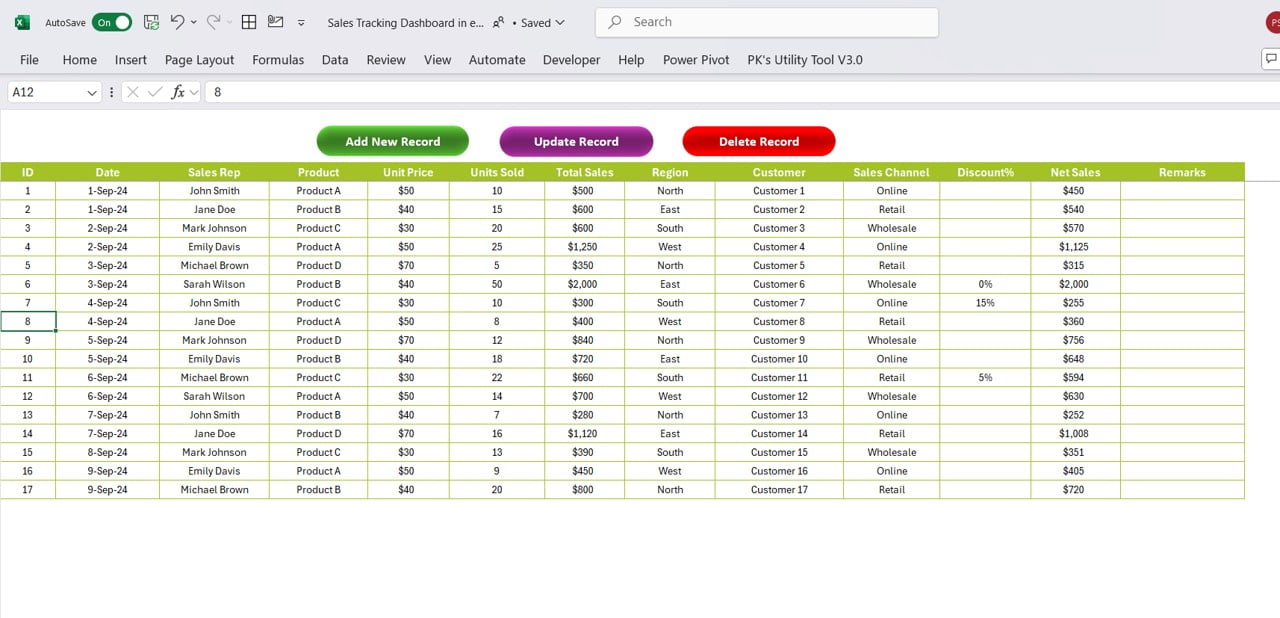
In this sheet tab, we have ID, Date, Sales Rep, Product, Unit Price, Units Sold, Total Sales, Region, Customer, Sales Channel, Discount%, Net Sales and Remarks columns to capture the data.
Click to buy Sales Tracking Dashboard in Excel
On the top of the sheet, we have given 3 buttons as given below:
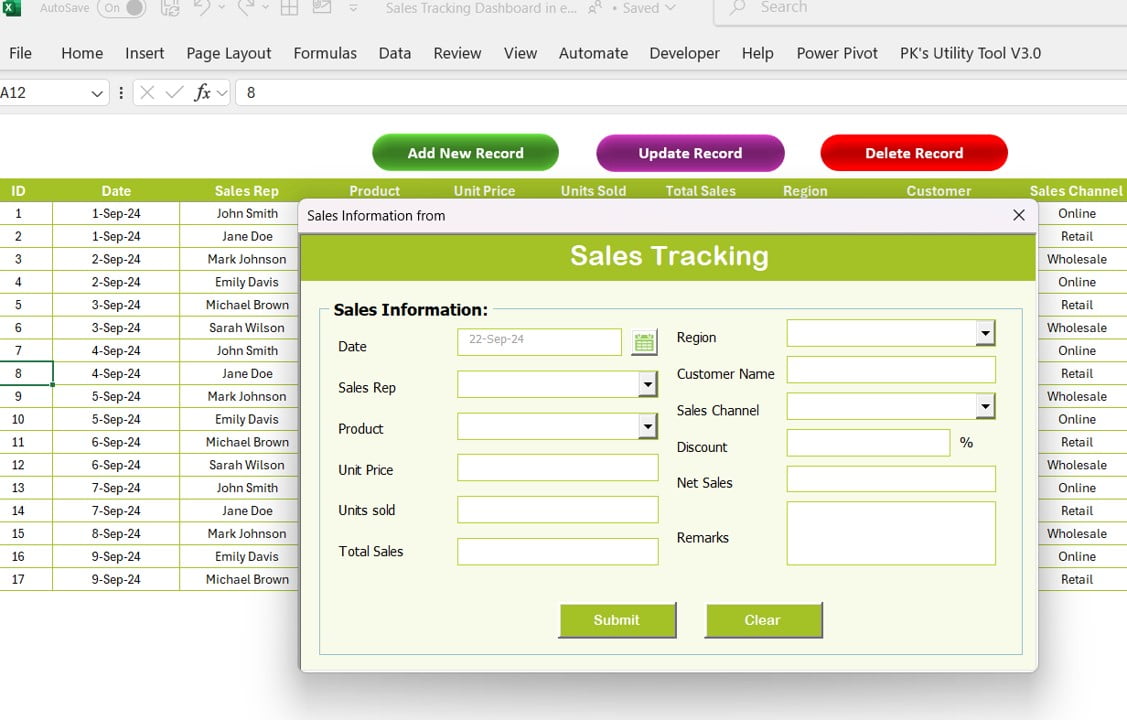
Add New Record:
To add a new record, you can use this button. It will open a data entry form. You can fill the information and click on submit. It will add the data on the sheet and will refresh the dashboard sheet also.
Click to buy Sales Tracking Dashboard in Excel
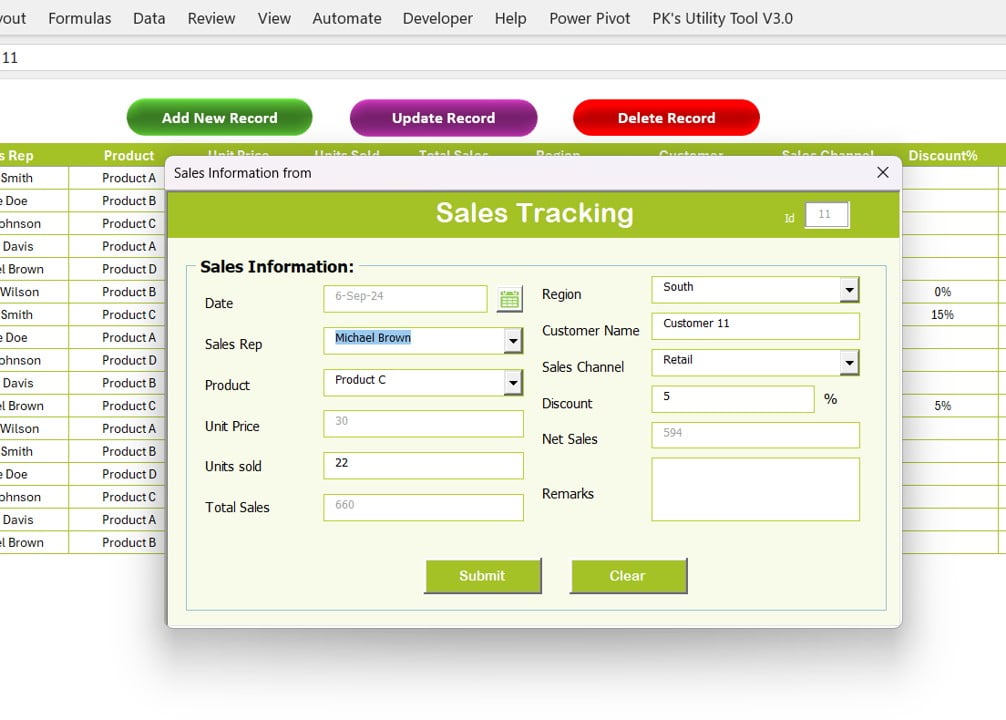
Update Record:
If you want to update the existing record, then just click on the Id (available on column A) of that record and click on the update Record button. It will open the same form but with prefilled information. You can change the information in the form and click on submit button.
Click to buy Sales Tracking Dashboard in Excel
Delete Record:
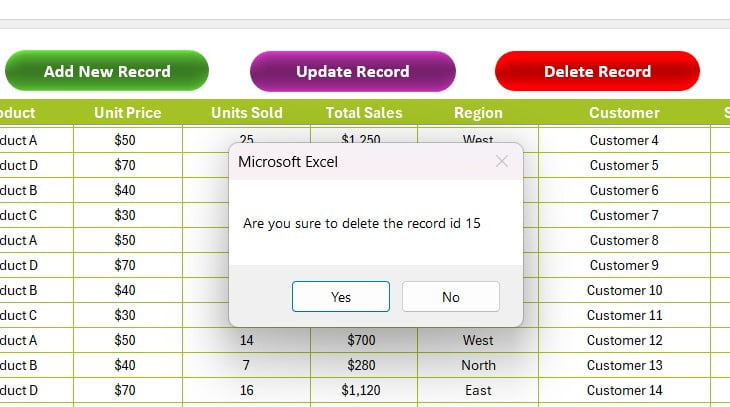
To delete a record from Sales sheet, just select the id of the record and click on the Delete Record button. It will confirm before deleting the record.
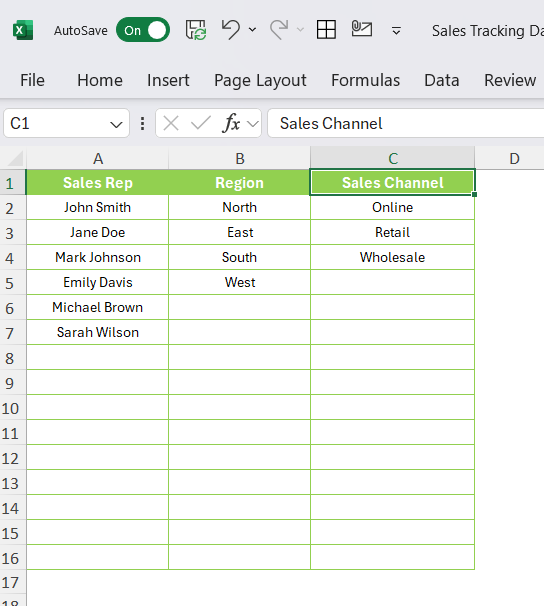
3. List sheet tab:
Here, you can enter the list of Sales Rep, Region and Sales Channel. This list will be used in the combo box of the data entry form.
4. Product Master sheet tab:
Click to buy Sales Tracking Dashboard in Excel
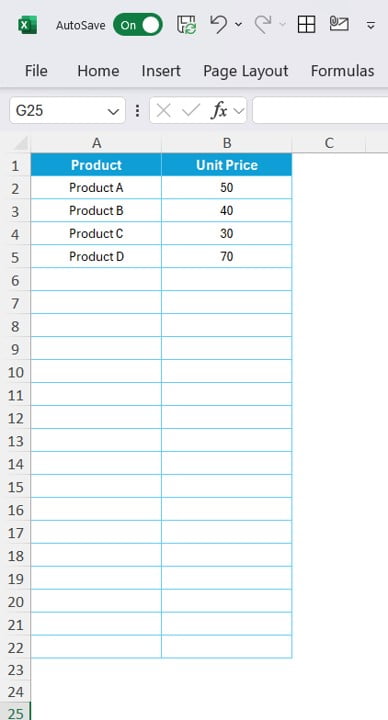
Enter the details of the Product Name and Unit Price of the Product. This information will be used on the data entry form.
Click to buy Sales Tracking Dashboard in Excel
5. Support sheet tab:
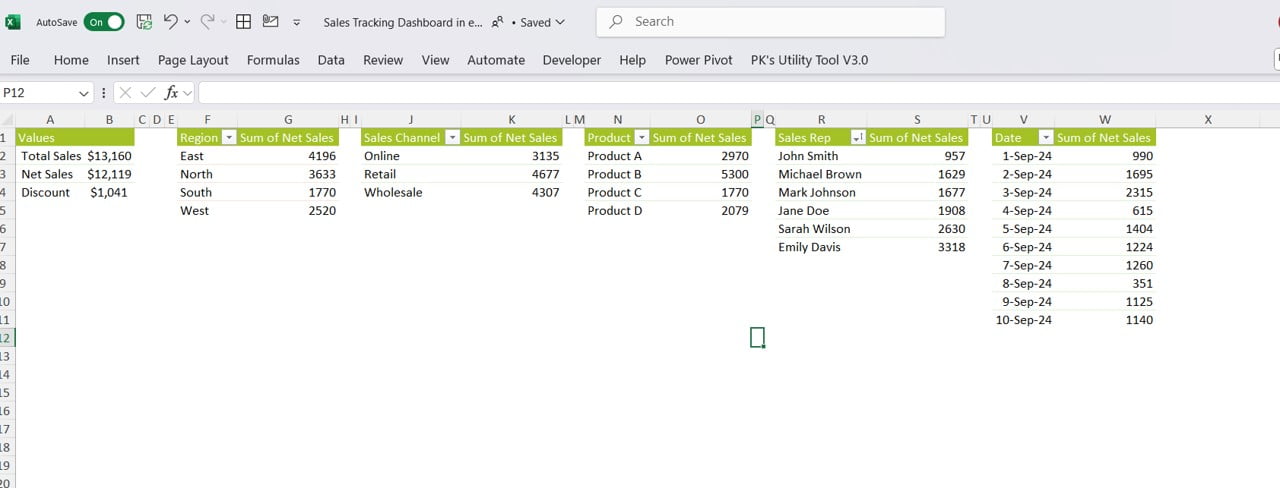
This is a support sheet wherein we have created few pivot tables to create the charts and cards on the Dashboard sheet. You can don’t need to do anything here. You can hide this sheet tab.
Click to buy Sales Tracking Dashboard in Excel
Best Practices for Using the Sales Tracking Dashboard
To ensure you get the most out of your Sales Tracking Dashboard in Excel, here are some best practices:
- Regular Data Entry: Consistently entering sales data ensures your dashboard remains updated, allowing for accurate reporting and trend analysis.
- Use Slicers Effectively: Take full advantage of the slicers on the dashboard to filter data by region, sales rep, product, or channel. This feature allows for deep dives into specific segments of your sales performance.
- Clean and Organize Lists: Regularly updating the List Sheet with correct information ensures your data entry form works smoothly without errors.
Monitor Trends: The Net Sales Trend chart is one of the most powerful tools in the dashboard. Regularly monitor this chart to spot significant trends and take proactive measures to improve performance.
Advantages of the Sales Tracking Dashboard with Data Entry Form
Using this template offers numerous benefits that can help your business:
- Automated Data Entry: With the built-in data entry form, adding, updating, and deleting records becomes a streamlined, error-free process.
- Clear Visual Insights: The dashboard provides a visual representation of your data, making it easier to identify trends and assess performance.
- Enhanced Data Accuracy: Pre-populating fields from the Product Master Sheet and using dropdowns from the List Sheet reduce the chances of manual data entry errors.
- Comprehensive Reporting: With different types of charts and filters, this dashboard offers a complete view of your sales performance across regions, sales reps, products, and channels.
Best Practices for Data Entry in the Sales Sheet
Data entry is the backbone of your sales tracking system. Here are some tips to ensure smooth and error-free data management:
- Use Validations: Set up data validation rules for fields such as dates, sales reps, and product names to avoid incorrect entries.
- Keep the Remarks Column Detailed: The Remarks column is essential for documenting any special conditions or notes related to each sale. Ensure it’s detailed enough to provide context when reviewing past sales.
- Regular Backups: Always keep a backup of your sales data in case of accidental deletions or file corruption.
Conclusion
A Sales Tracking Dashboard with Data Entry Form in Excel is a powerful, flexible, and cost-effective tool for businesses aiming to streamline their sales management processes. The combination of a user-friendly data entry form and a visually rich dashboard makes it an invaluable resource for tracking performance, identifying trends, and making data-driven decisions.
Visit our YouTube channel to learn step-by-step video tutorials
Watch the step-by-step video tutorial:
Click to buy Sales Tracking Dashboard in Excel
