In the competitive retail industry, efficient shelf space utilization is crucial for maximizing sales and improving customer experience. To help businesses monitor and optimize their shelf space usage, we have developed a Shelf Space Utilization KPI Dashboard in Excel. This ready-to-use template simplifies tracking essential KPIs and provides insightful data for better decision-making.
This article will explain what the Shelf Space Utilization KPI Dashboard is, its key features, advantages, best practices, and frequently asked questions. By the end, you’ll understand how to leverage this dashboard to enhance retail efficiency and profitability.
Click to Shelf Space Utilization
What is the Shelf Space Utilization KPI Dashboard?
The Shelf Space Utilization KPI Dashboard in Excel is a data-driven tool that allows retailers to track the efficiency of shelf space usage. It provides insights into how well products are displayed and how effectively shelf space contributes to overall sales and inventory management.
The dashboard includes multiple worksheets, each serving a specific function. Users can monitor monthly and yearly trends, compare actual performance with targets, and analyze historical data for better planning.
Key Features of the Shelf Space Utilization KPI Dashboard
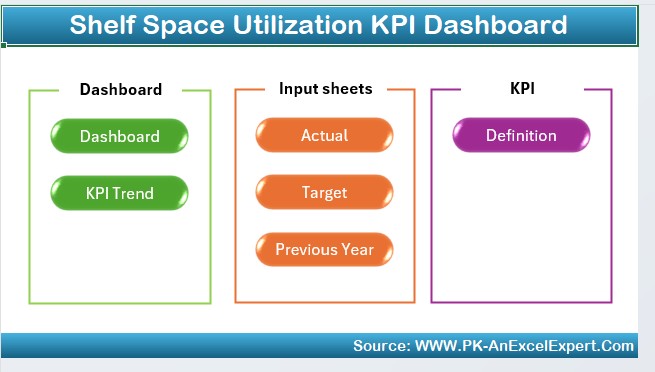
This Excel-based KPI dashboard consists of seven worksheets, each with a unique role in tracking and analyzing shelf space efficiency.
Home Sheet
- Serves as the index page.
- Contains six buttons for quick navigation to relevant sheets.
- Provides an easy-to-use interface for accessing different sections of the dashboard.
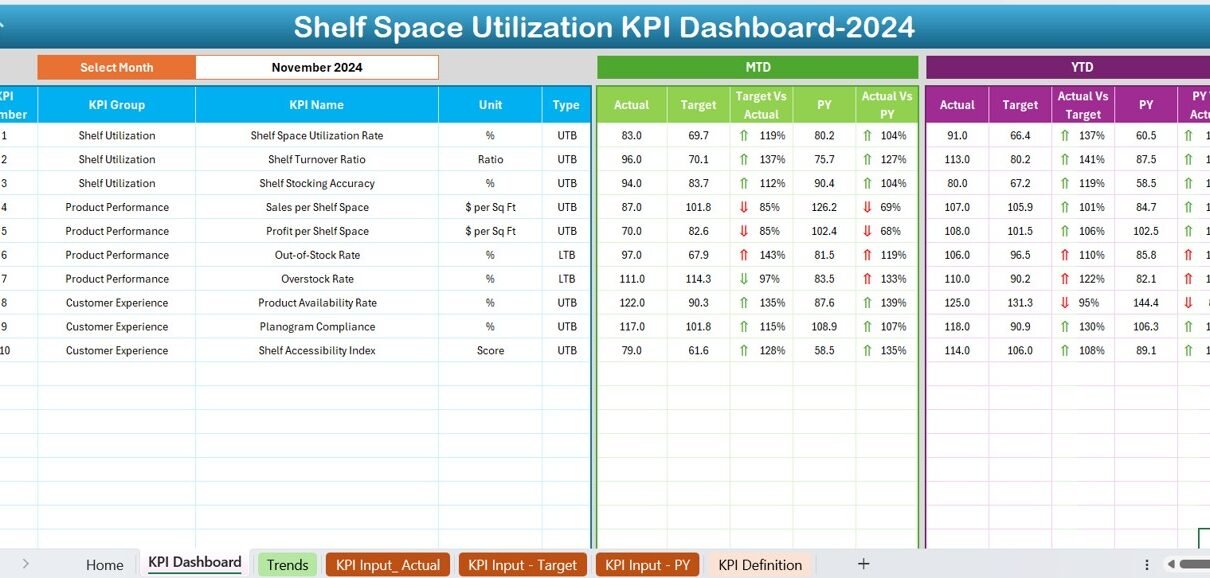
Dashboard Sheet
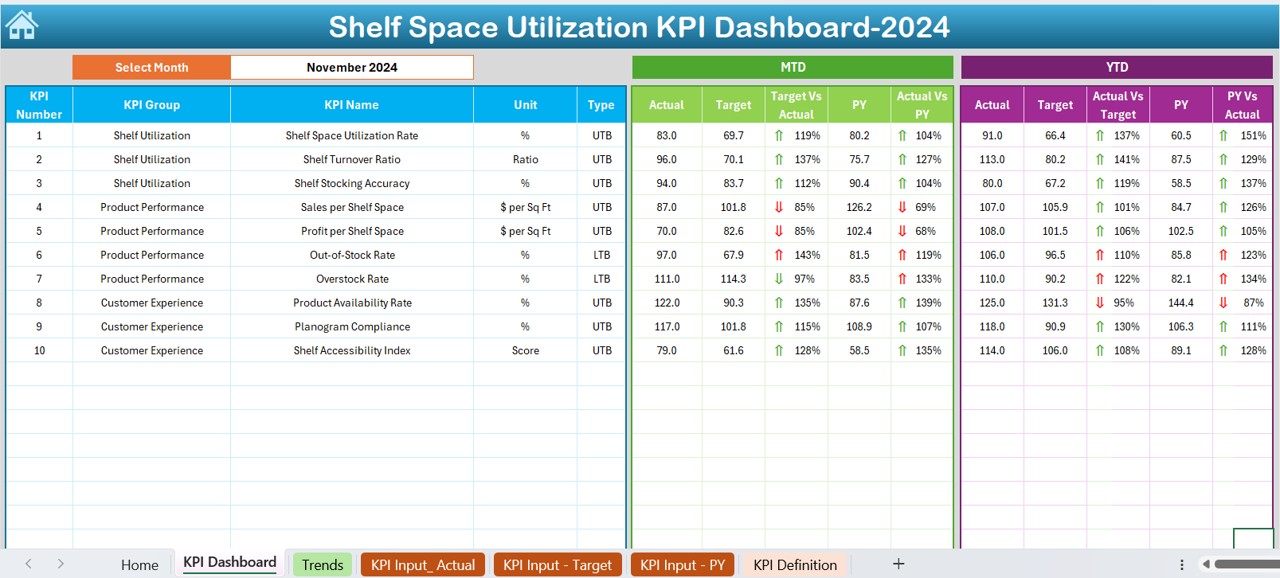
- Main visualization sheet displaying key KPIs.
- Users can select a month from a drop-down (D3) to filter data.
- Displays MTD (Month-to-Date) and YTD (Year-to-Date) Actual, Target, and Previous Year data.
- Includes conditional formatting with up/down arrows to highlight trends.
- Shows Target vs. Actual and Previous Year vs. Actual comparisons.
KPI Trend Sheet
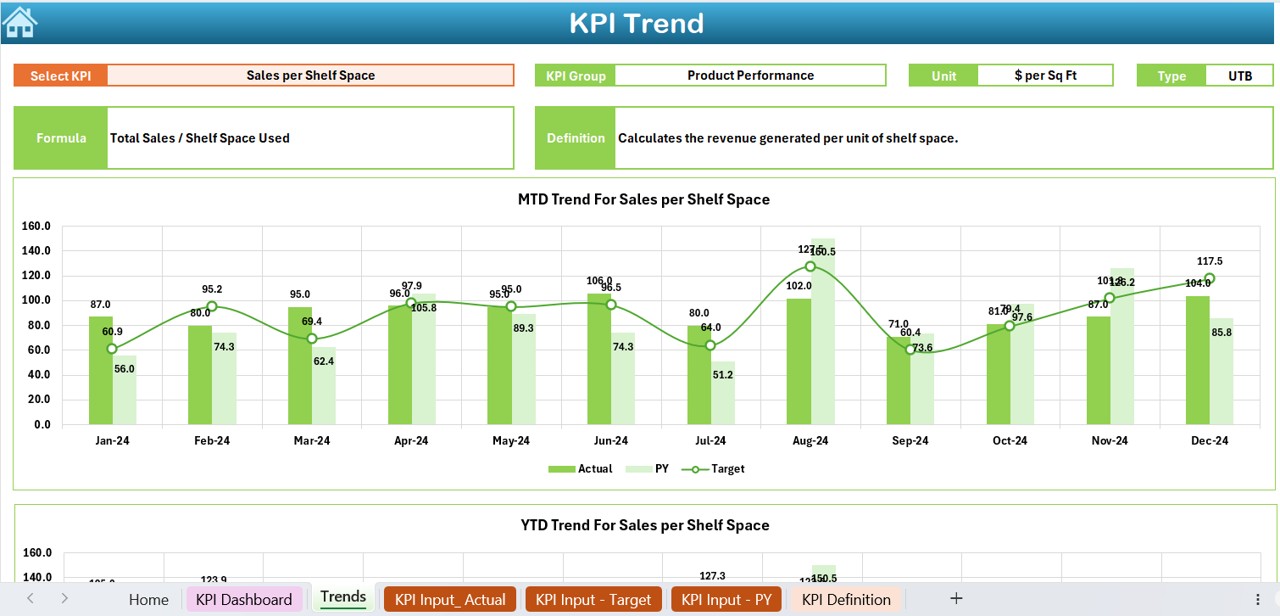
- Users can select a KPI name from the drop-down in cell C3.
- Displays KPI-related details, including:
- KPI Group
- Measurement Unit
- Performance Type (Lower is better or Upper is better)
- Formula for calculation
- KPI Definition
- Provides MTD and YTD trend charts for actual, target, and previous year values.
Click to Shelf Space Utilization
Actual Numbers Input Sheet
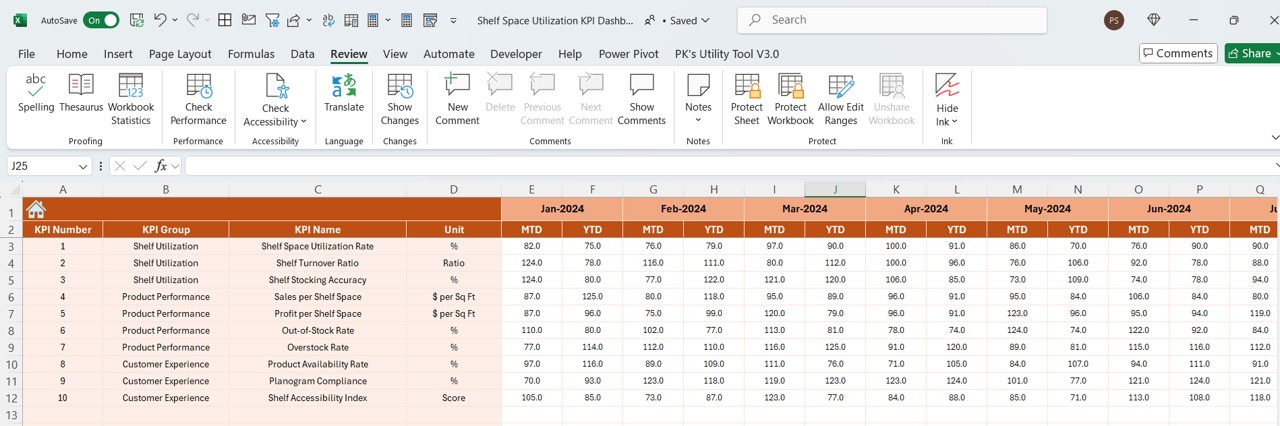
- Users input actual numbers for MTD and YTD.
- Month selection available at E1 for easy data entry.
- Essential for accurate KPI tracking and reporting.
Target Sheet
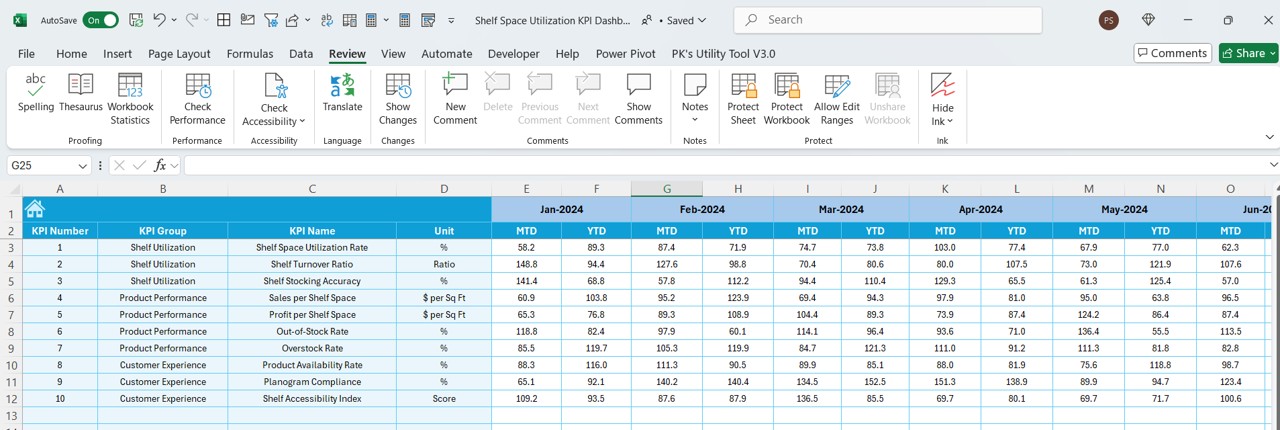
- Users enter target numbers for each KPI.
- Supports both MTD and YTD targets.
- Ensures goal-setting and performance tracking.
Previous Year Number Sheet
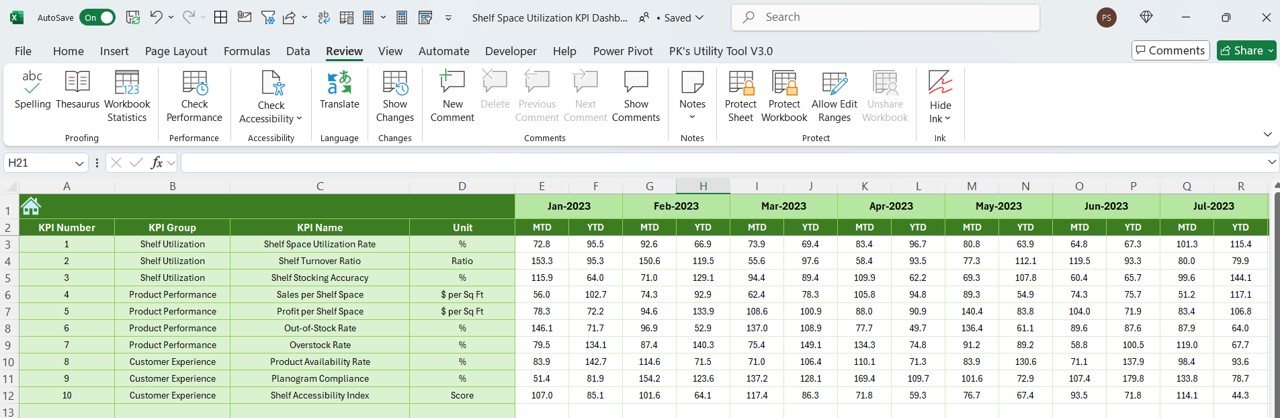
- Stores historical data from the previous year.
- Enables year-over-year comparison for performance analysis.
KPI Definition Sheet
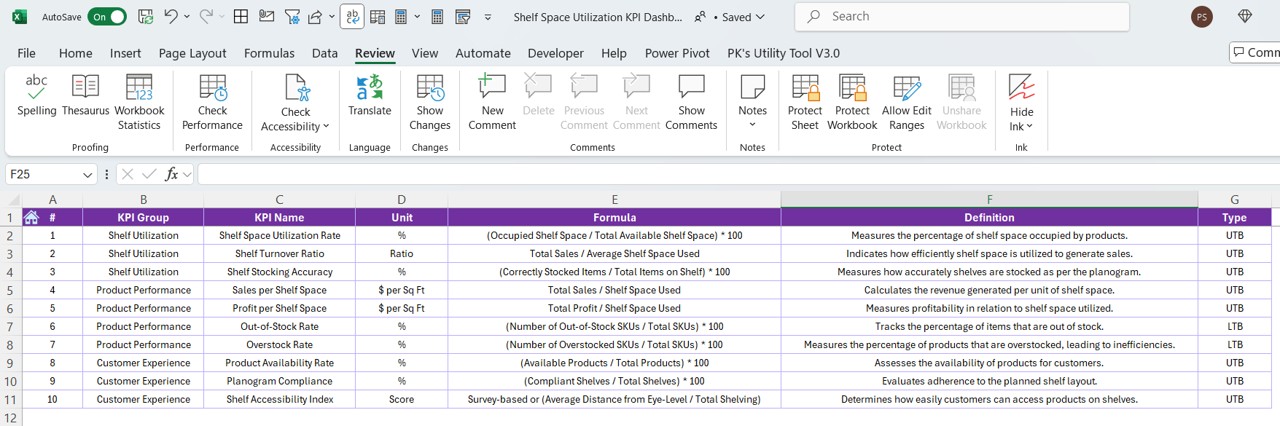
- Contains definitions and formulas for each KPI.
- Includes KPI Name, Group, Unit, Calculation Formula, and a detailed KPI definition.
Click to Shelf Space Utilization
Advantages of the Shelf Space Utilization KPI Dashboard
📈 Data-Driven Decision Making: The dashboard provides real-time insights into shelf utilization, helping businesses make informed decisions.
🎯 Performance Tracking: Track MTD and YTD performance against targets, ensuring accountability and proactive adjustments.
⚡ Quick and Easy Analysis: With built-in charts and conditional formatting, users can visually analyze trends and make strategic changes.
📊 Historical Comparisons: Compare current data with previous years to identify growth patterns and areas for improvement.
⏳ Time-Saving Automation: Eliminates manual calculations by automating KPI tracking, making reporting faster and more efficient.
Best Practices for Using the Shelf Space Utilization KPI Dashboard
- Regularly Update Data: Ensure that actual, target, and previous year numbers are updated periodically to maintain accuracy.
- Set Realistic Targets: Use historical trends to set achievable KPI targets for effective shelf space planning.
- Analyze Trends Monthly: Utilize the KPI Trend Sheet to detect seasonal fluctuations and make necessary adjustments.
- Utilize Conditional Formatting Insights: Pay attention to the up/down arrows to quickly identify performance deviations.
- Leverage Historical Data for Planning: Review past performance trends to refine shelf space allocation and improve inventory turnover.
Conclusion
The Shelf Space Utilization KPI Dashboard in Excel is an invaluable tool for retailers looking to optimize shelf space efficiency. By leveraging its automated tracking features, businesses can make data-driven decisions, improve product placement, and enhance overall store performance.
Frequently Asked Questions (FAQs)
What is shelf space utilization in retail?
Shelf space utilization refers to the effective allocation and management of store shelves to maximize sales and inventory efficiency. It ensures that high-demand products are placed strategically for better visibility and accessibility.
How does the Shelf Space Utilization KPI Dashboard help businesses?
This Excel dashboard enables retailers to track key performance indicators (KPIs) related to shelf space usage, set realistic targets, compare data with previous years, and optimize product placement based on insights.
Can I customize this KPI dashboard?
Yes! The dashboard is fully customizable. Users can modify KPI definitions, formulas, and visual elements to align with their specific business needs.
How often should I update the dashboard?
For accurate reporting and analysis, update the dashboard monthly with actual and target values. Regular updates ensure real-time performance tracking.
Is this dashboard suitable for small businesses?
Absolutely! The Shelf Space Utilization KPI Dashboard is designed to be scalable, making it ideal for both small retailers and large enterprises looking to optimize their shelf space efficiency.
Click to Shelf Space Utilization
Visit our YouTube channel to learn step-by-step video tutorials