Shipping Accuracy KPI Dashboard in Excel – A Complete Guide with Template
Managing shipping performance plays a crucial role in improving logistics, customer satisfaction, and operational efficiency. One of the most important metrics in logistics is Shipping Accuracy. And to monitor this effectively, using a Shipping Accuracy KPI Dashboard in Excel can help you stay on top of performance metrics with real-time visibility.
In this article, we’ll walk you through a professionally designed Shipping Accuracy KPI Dashboard built in Excel. Whether you’re a supply chain manager, operations analyst, or small business owner, this guide will help you understand the structure, features, benefits, and best practices of using this dashboard to its full potential.
What Is a Shipping Accuracy KPI Dashboard?
A Shipping Accuracy KPI Dashboard is a visual management tool that tracks and analyzes key performance indicators (KPIs) related to shipping accuracy. It helps organizations monitor how well they’re meeting shipping goals, such as delivering the right products to the right place at the right time.
Click to Shipping Accuracy KPI
Overview of the Dashboard Template
We’ve created a ready-to-use, interactive Shipping Accuracy KPI Dashboard in Excel with the following key components:
Home Sheet – The Navigation Hub
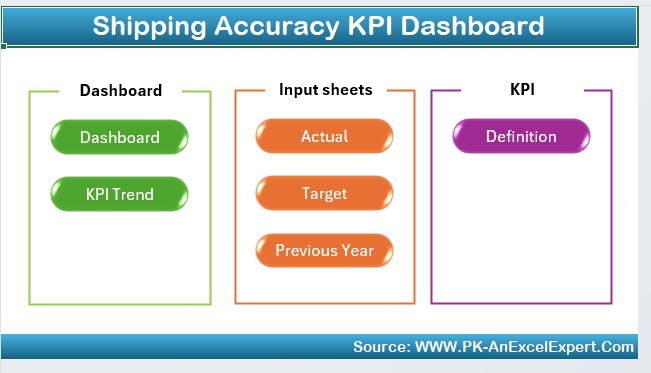
The Home sheet acts as the index of the dashboard. It contains 6 clickable buttons that help users jump to respective sheets instantly. This feature saves time and simplifies navigation across the workbook.
Dashboard Sheet – The Main Analytics View
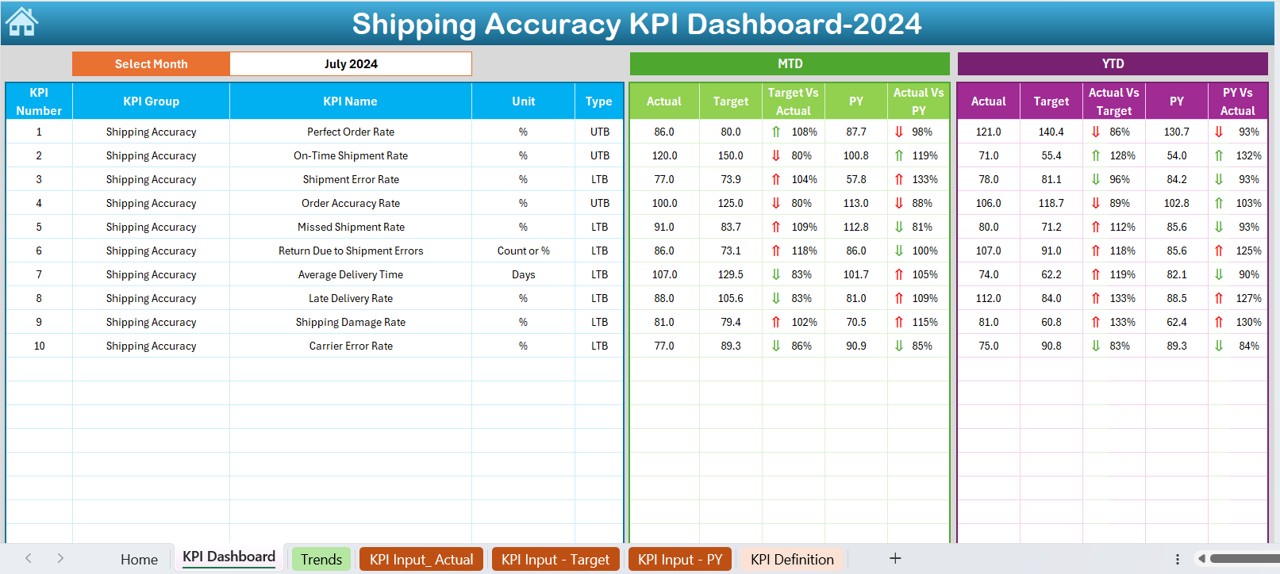
- This is the core of the dashboard. On this sheet:
- You can select the Month from a dropdown in cell D3.
- All dashboard numbers update automatically for the selected month.
- It displays MTD and YTD values for:
- Actual
- Target
- Previous Year
- It includes Target vs Actual and PY vs Actual comparisons.
- Conditional formatting shows up/down arrows for performance trends.
- This layout gives users a quick and clear view of their current standing.
Click to Shipping Accuracy KPI
KPI Trend Sheet – Dynamic Trend Visualization
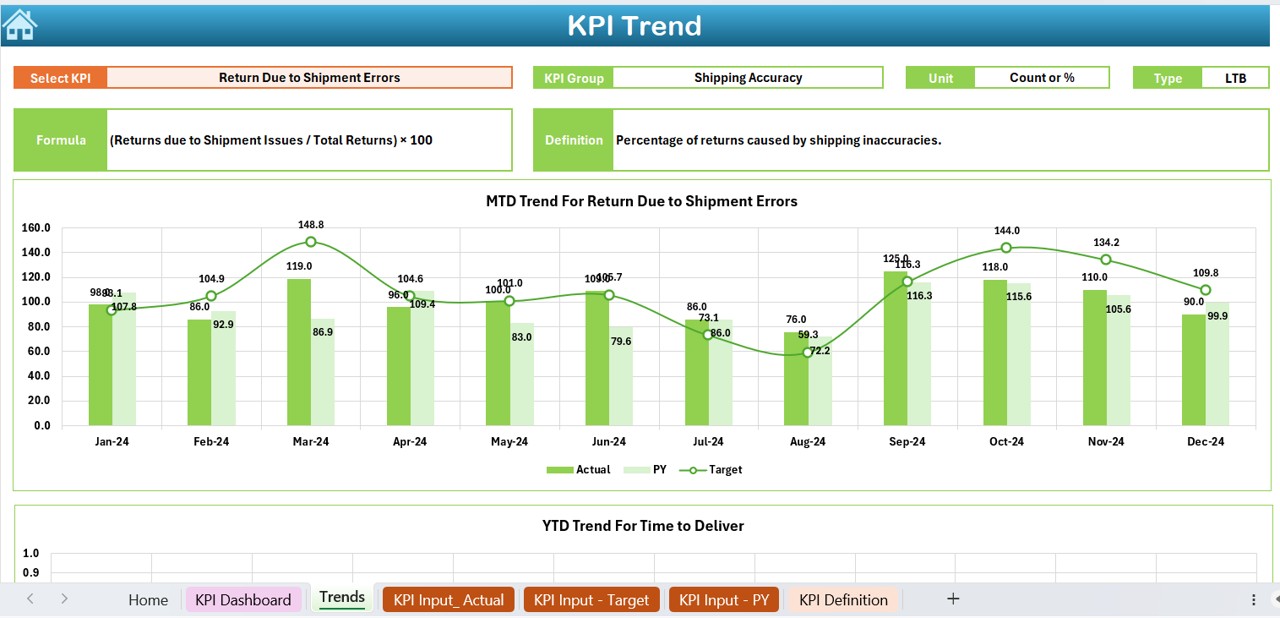
In this sheet:
- Select a KPI Name from the dropdown in cell C3.
- Instantly view:
- KPI Group
- Unit of Measure
- Type (Lower is Better or Upper is Better)
- Formula
- Definition
- It also includes MTD and YTD trend charts for:
- Actual
- Target
- Previous Year
This sheet provides clarity on KPI behavior over time and helps track progress.
Actual Numbers Input Sheet – Enter Real-Time Data
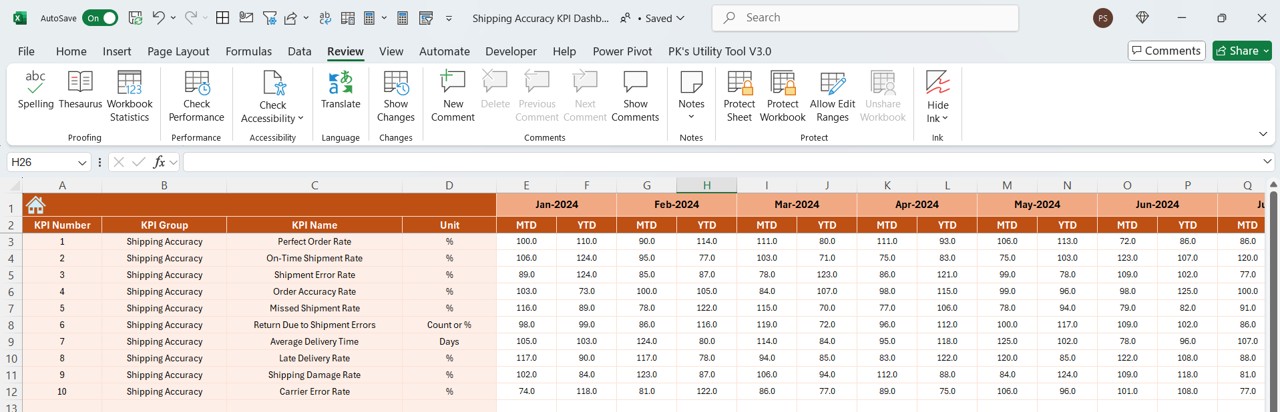
- This is the input section where you:
- Enter MTD and YTD actual data for the selected month.
- Choose the first month of the year in cell E1 to dynamically set the timeline.
- This sheet forms the basis for all calculations and visualizations in the dashboard.
Target Sheet – Set Performance Goals
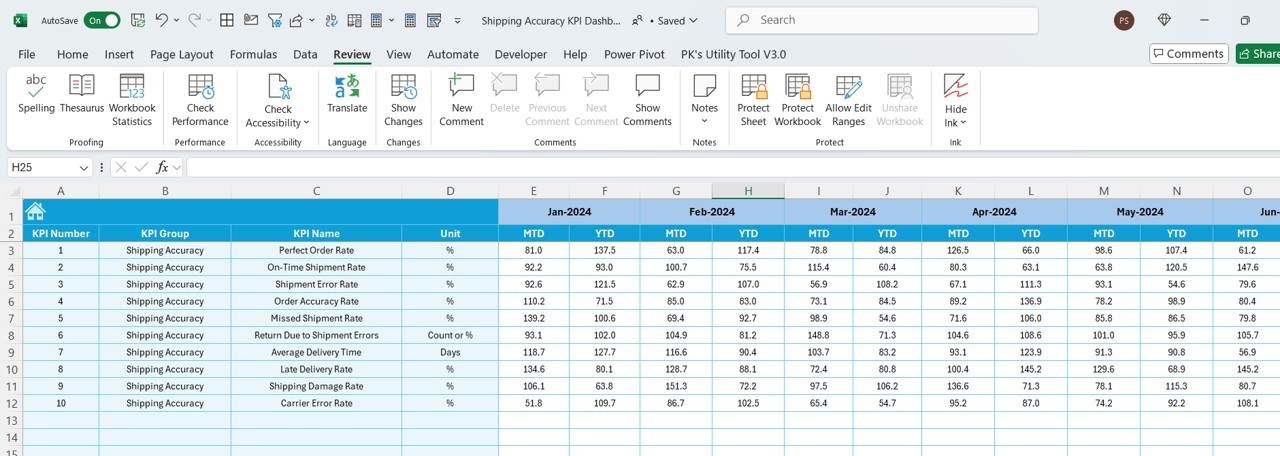
Here, users enter the MTD and YTD target values for each KPI.
- This allows you to:
- Set clear monthly goals.
- Track variances between actual and expected performance.
Click to Shipping Accuracy KPI
Previous Year Number Sheet – Comparative Analysis
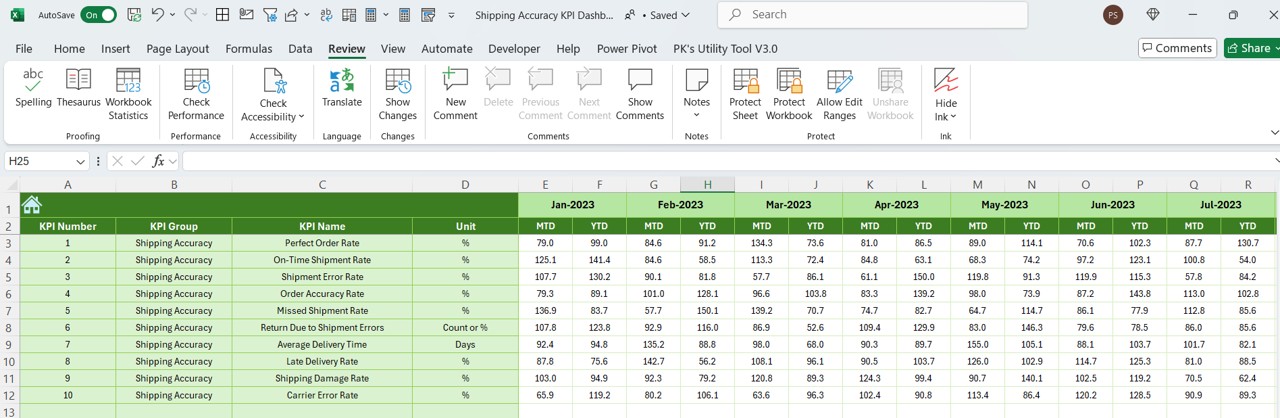
This sheet stores data from the previous year, structured the same way as the current year.
- It helps in:
- Benchmarking current performance.
- Identifying improvement areas over time.
KPI Definition Sheet – Understand the Metrics
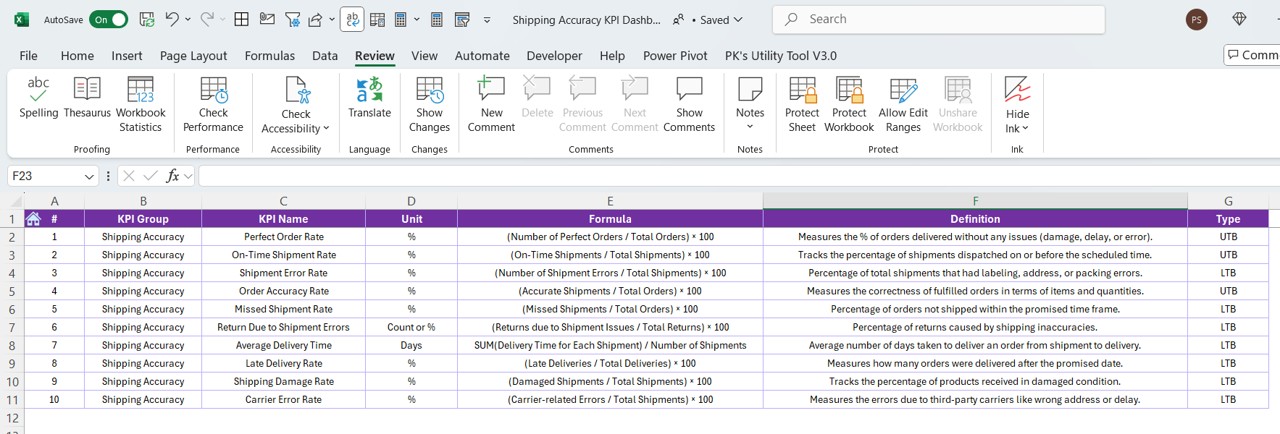
- This tab is a reference sheet to:
- Enter the KPI name, group, unit, formula, and definition.
- Ensure team members understand what each KPI measures and how it’s calculated.
Advantages of the Shipping Accuracy KPI Dashboard
Let’s explore why this dashboard is a game-changer for logistics teams:
- Clear Visibility of Shipping Metrics: You can track real-time MTD and YTD numbers, enabling faster decision-making and issue detection.
- Instant Month Selection: Simply choose the month from a dropdown, and the dashboard updates automatically.
- Visual Trend Indicators: With conditional formatting and trend charts, it’s easy to spot performance improvements or drops.
- Historical Comparison: Benchmark performance against the previous year to understand trends and seasonal changes.
- Professional and User-Friendly Design: Even non-technical users can navigate the dashboard with ease thanks to the clean layout and navigation buttons.
💡 Best Practices for Using the Shipping Accuracy KPI Dashboard
To make the most out of this dashboard, follow these best practices:
- Update Data Regularly: Input actual and target numbers consistently each month to maintain accuracy.
- Define KPIs Clearly: Ensure all team members understand KPI definitions and how they’re calculated. Use the KPI Definition tab for alignment.
- Review Monthly: Conduct regular review meetings using the dashboard as a base for decision-making.
- Keep the Template Protected: Lock cells that contain formulas and charts to avoid accidental edits.
- Customize According to Needs: Add or remove KPIs based on your specific shipping processes and goals.
Conclusion
Tracking shipping accuracy isn’t just about numbers — it’s about delivering on customer promises. With this Shipping Accuracy KPI Dashboard in Excel, you can bring clarity, control, and continuous improvement to your logistics operations.
From month-to-month analysis to year-over-year comparisons, this template has everything you need to track and improve your shipping performance — all in one place, and without any expensive software.
Don’t wait for shipping issues to escalate. Start measuring and managing your KPIs today using this powerful, professional Excel dashboard.
❓Frequently Asked Questions (FAQs)
What is shipping accuracy?
Shipping accuracy refers to the percentage of orders delivered correctly — meaning right product, quantity, and destination. High shipping accuracy improves customer satisfaction and reduces return costs.
How is shipping accuracy calculated?
Shipping Accuracy (%) =
(Correctly Shipped Orders / Total Shipped Orders) × 100
For example, if 950 out of 1,000 orders were shipped correctly, the accuracy is 95%.
Why is shipping accuracy important?
Shipping accuracy ensures that customers receive what they expect, which leads to better retention, fewer complaints, and improved operational efficiency.
Can I add more KPIs to this dashboard?
Yes, you can! Simply update the KPI Definition, Actual, Target, and Previous Year sheets accordingly. The dashboard can support many KPIs.
Is this Excel dashboard suitable for small businesses?
Absolutely. It’s designed for both small and large operations. It’s easy to use, cost-effective, and highly adaptable to business needs.
Can I track weekly or quarterly shipping accuracy?
The default dashboard tracks monthly and yearly KPIs. However, with slight modifications, you can set it up for weekly or quarterly tracking.
Do I need advanced Excel skills to use this dashboard?
No. The dashboard is built with user-friendliness in mind. Basic Excel knowledge is enough to operate it effectively.
Is the dashboard mobile-friendly?
While Excel is best used on desktops or laptops, you can view and edit it on mobile using Excel mobile apps with some layout limitations.
Click to Shipping Accuracy KPI
Visit our YouTube channel to learn step-by-step video tutorials