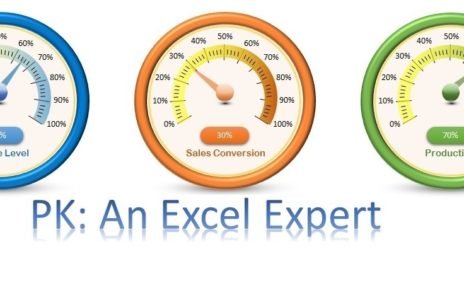
Slide Meter Chart is very useful and eye catching chart to show the KPI metrics performance. This chart has been designed with the help of Column Chart, Line Chart and Auto shapes.
Check our Slide Meter chart Version 2
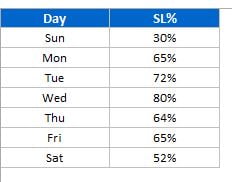
Below is the data points which has been used to create this beautiful chart-
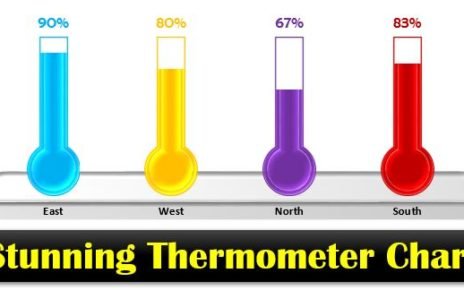
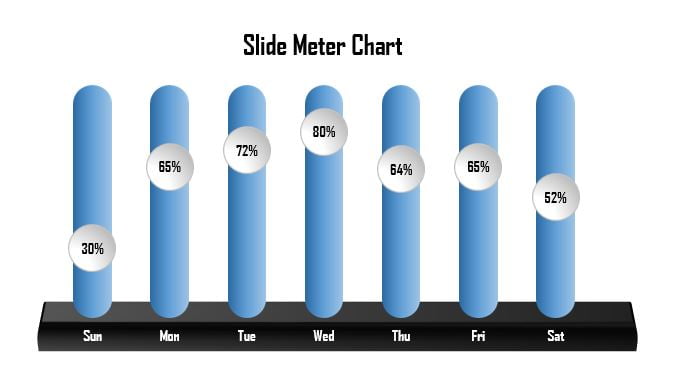
Below is the Slide Meter Chart (Ver-1).
Below is the snapshot of the slide meter chart in Excel. You can use it with your data. We are showing the Day wise Service Level but you can use it for multiple purpose.
Click to buy Slide Meter Chart – Version 1
Visit our YouTube channel to learn step-by-step video tutorials
Watch the step by step video tutorial:
Click to buy Slide Meter Chart – Version 1