In today’s data-driven world, small businesses must track their performance effectively to stay ahead of the competition. A Small Business KPI Dashboard in Power BI provides a comprehensive, easy-to-use solution for monitoring key performance indicators (KPIs). This dashboard enables businesses to analyze their financial health, operational efficiency, and customer engagement in real time.
In this article, we will discuss how a Small Business KPI Dashboard works, its key features, best practices, advantages, and frequently asked questions. Whether you’re a business owner, analyst, or manager, this guide will help you understand how to leverage Power BI for KPI tracking.
Click to buy Small Business KPI Dashboard in Power BI
What is a Small Business KPI Dashboard?
A Small Business KPI Dashboard is a visual representation of important business metrics that help decision-makers track performance against goals. These dashboards consolidate data from multiple sources, providing real-time insights into critical business areas like revenue, sales, expenses, customer retention, and productivity.
With Power BI, businesses can create interactive dashboards that allow users to drill down into detailed insights, apply filters, and analyze trends over time.
Key Features of the Small Business KPI Dashboard
Our Small Business KPI Dashboard in Power BI consists of three primary pages:
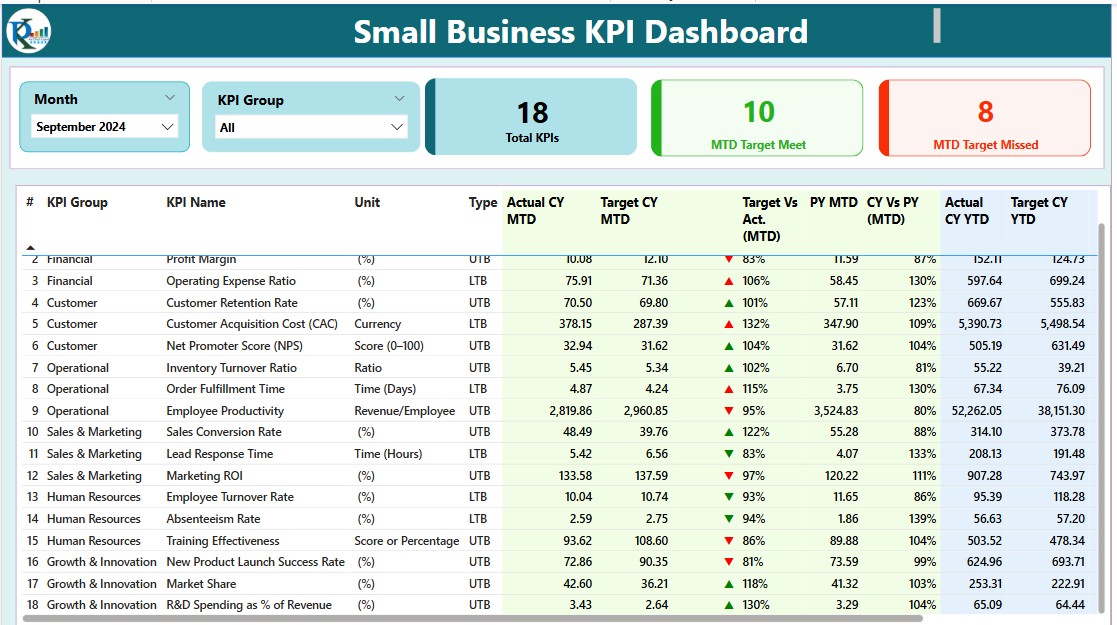
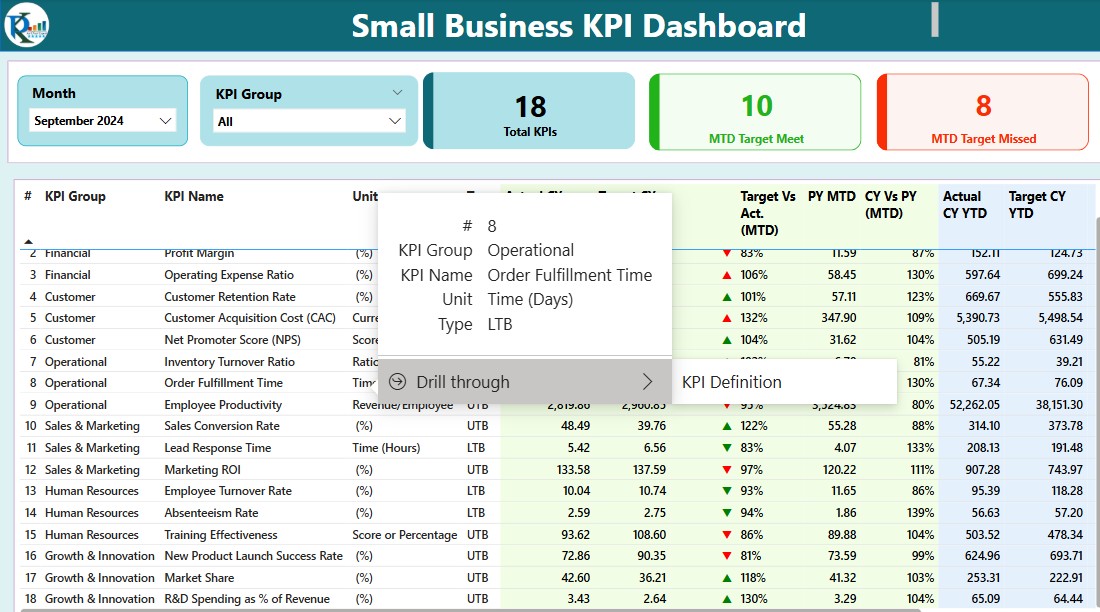
Summary Page
Click to buy Small Business KPI Dashboard in Power BI
This is the main dashboard page, providing an overview of KPIs at a glance.
- Month and KPI Group Slicer: Users can filter data based on the selected month and KPI group.
- Key Metrics Display: Shows three critical KPI cards:
Total KPI Count
- MTD (Month-to-Date) Target Met Count
- MTD Target Missed Count
- Detailed KPI Table: Displays important KPI information, including:
- KPI Number
- KPI Group (e.g., Sales, Finance, Customer Service)
- KPI Name
- Unit of Measurement (e.g., Percentage, Currency, Count)
- KPI Type: LTB (Lower The Better) or UTB (Upper The Better)
- Actual CY MTD (Current Year Month-to-Date Values)
- Target CY MTD
- MTD Indicator Icons (Green ▲ for met targets, Red ▼ for missed targets)
- CY vs PY MTD Comparison
- YTD (Year-to-Date) KPI Data
- YTD Indicator Icons (Green ▲ for met targets, Red ▼ for missed targets)
- CY vs PY YTD Comparison
Click to buy Small Business KPI Dashboard in Power BI
KPI Trend Page
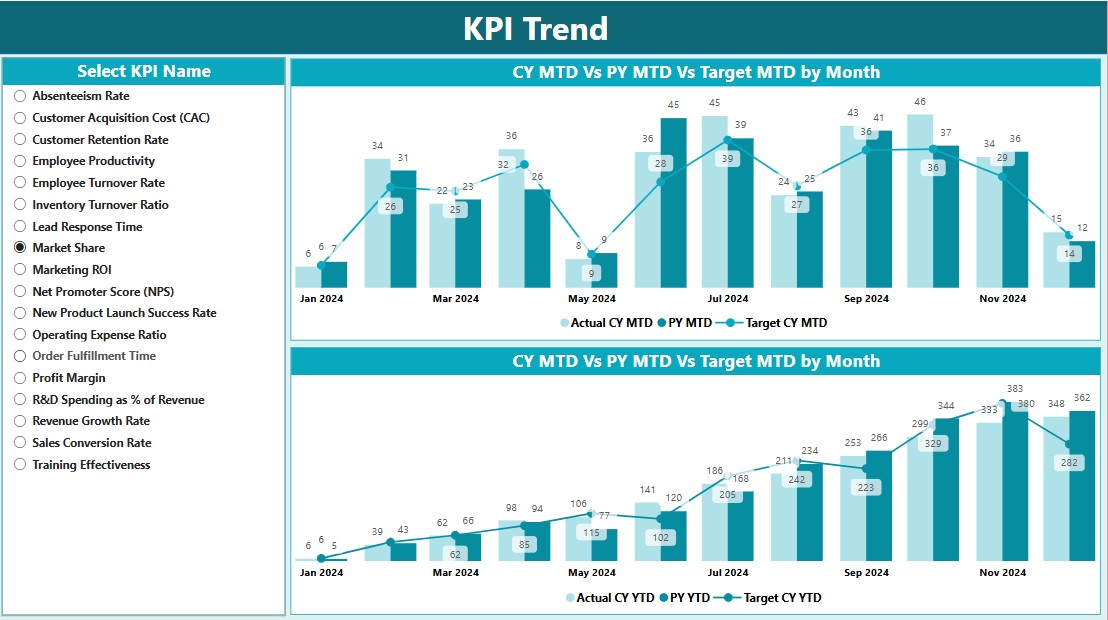
This section focuses on visual trend analysis.
- Two Combo Charts: Displays Actual Numbers vs. Targets for both MTD and YTD.
- Slicer for KPI Selection: Users can select a specific KPI and analyze trends.
- Comparison of Current Year vs. Previous Year Data: Helps businesses understand performance trends over time.
KPI Definition Page
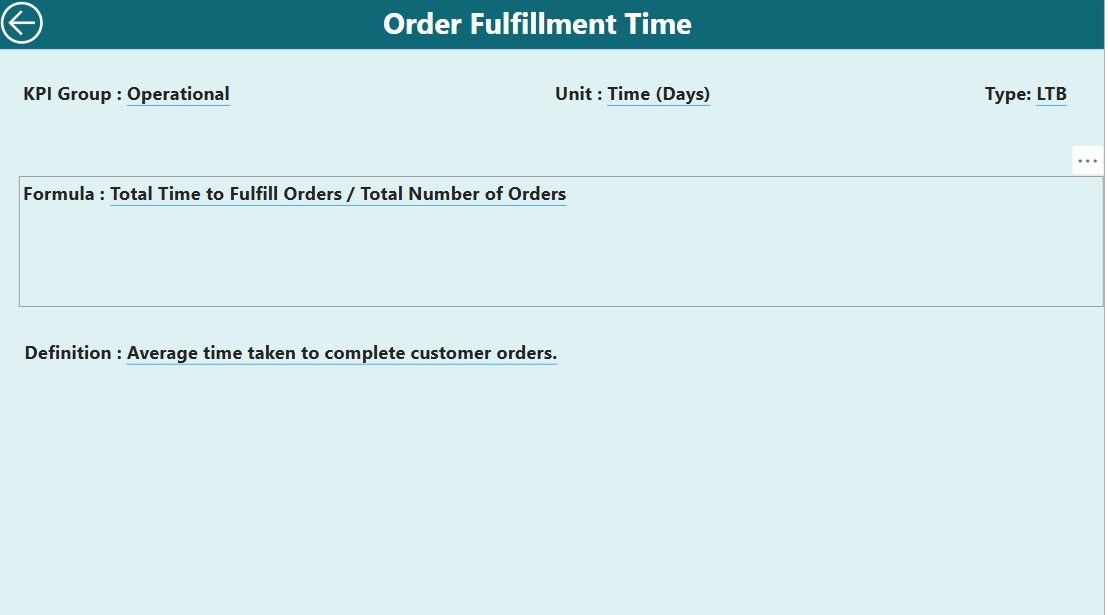
Drill-through Page:
- Allows users to view detailed KPI definitions and formulas.
- Hidden Page: Users can access this page only through drill-through navigation from the Summary Page.
- Back Button: Allows users to return to the Summary Page easily.
Data Source: Excel Integration
The dashboard uses an Excel file as its data source, making it simple to update and maintain. Businesses need to populate three worksheets:
Input Actual Sheet:
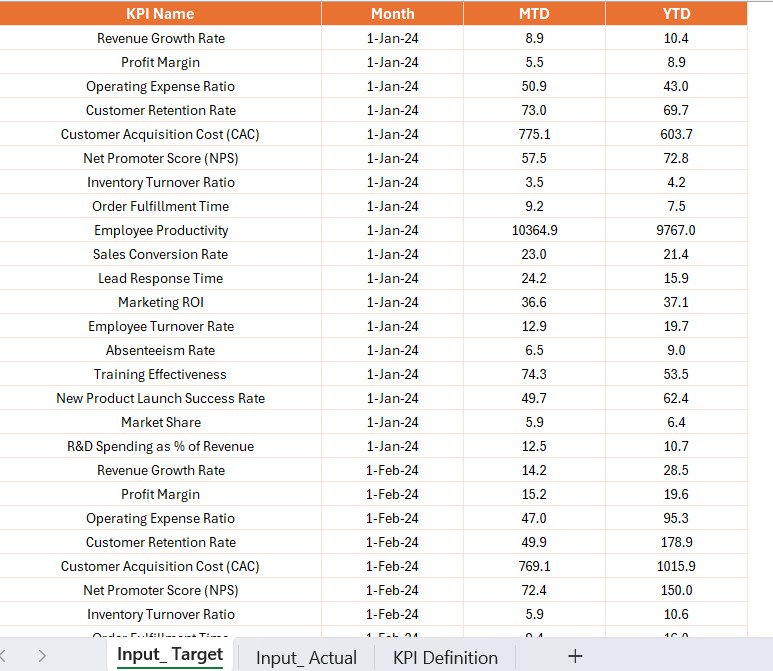
- Enter actual KPI values per month.
Input Target Sheet:
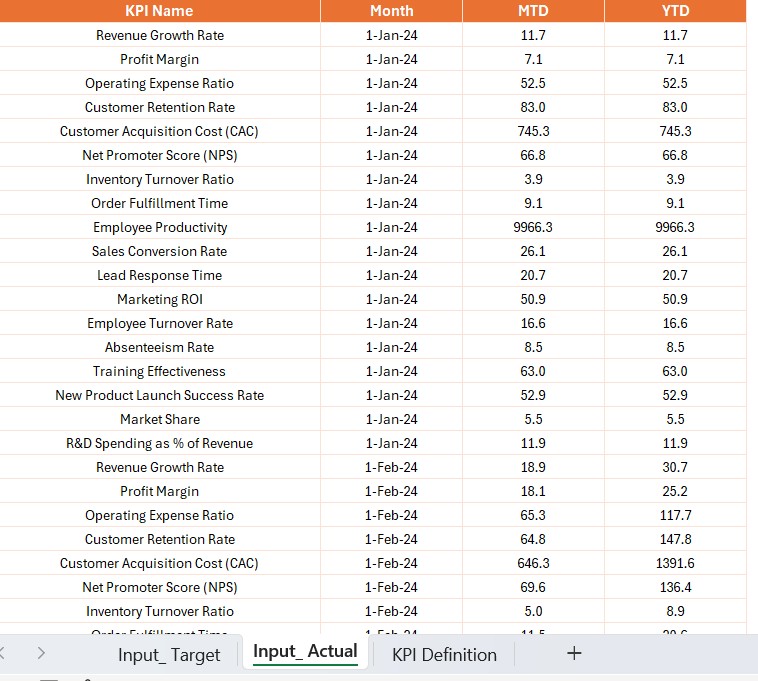
- Enter target values per month.
KPI Definition Sheet:
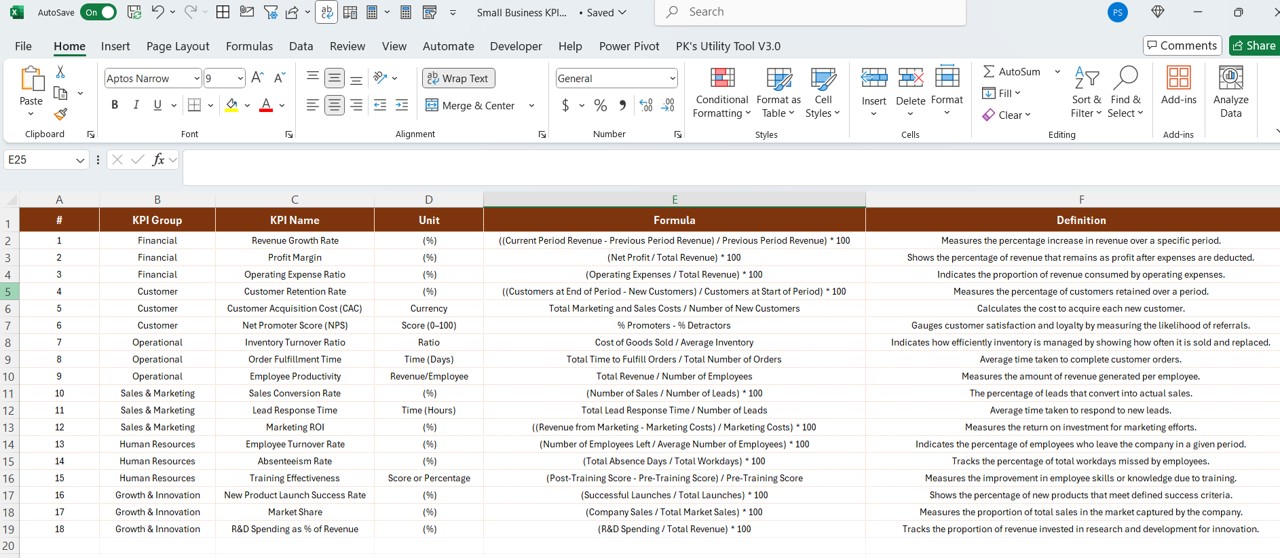
- Define KPIs, including their formulas, measurement units, and type (LTB or UTB).
Advantages of a Small Business KPI Dashboard
- Data-Driven Decision Making: A well-structured KPI dashboard enables businesses to make informed decisions based on real-time insights.
- Improved Performance Tracking: With KPI comparisons across different time periods, businesses can track whether they are improving or underperforming.
- Time Efficiency: Instead of manually compiling reports, businesses can access a real-time, automated dashboard.
- Customization & Flexibility: Power BI allows users to customize visuals, apply filters, and drill down into specific data.
- Integration with Multiple Data Sources: Power BI can connect to Excel, databases, and cloud-based applications, ensuring seamless data integration.
Best Practices for Small Business KPI Dashboards
- Define Clear KPIs: Ensure KPIs align with business objectives.
- Use Visual Indicators: Red/Green icons make it easy to identify performance trends.
- Ensure Data Accuracy: Regularly update the Excel file to maintain accurate insights.
- Keep it Simple: Avoid cluttered dashboards; focus on essential KPIs.
- Provide Drill-Through Capabilities: Allow users to explore KPI definitions and formulas.
- Regularly Monitor & Adjust: Review KPIs and update targets as business priorities change.
Click to buy Small Business KPI Dashboard in Power BI
Conclusion
A Small Business KPI Dashboard in Power BI is a powerful tool that enables businesses to track performance, analyze trends, and make data-driven decisions. With features like real-time updates, visual indicators, trend analysis, and Excel integration, this dashboard is essential for small businesses aiming for sustainable growth and efficiency.
Frequently Asked Questions (FAQs)
What are KPIs in a Small Business KPI Dashboard?
KPIs (Key Performance Indicators) are measurable values that help businesses track progress toward their strategic goals. Examples include Revenue Growth, Customer Retention, and Operating Costs.
How often should I update my Small Business KPI Dashboard?
It depends on business needs. However, for accurate insights, businesses should update KPI data at least monthly.
Can I use Power BI without technical knowledge?
Yes! Power BI is user-friendly and offers drag-and-drop functionalities, making it accessible even for beginners.
What is the difference between MTD and YTD in KPI dashboards?
- MTD (Month-to-Date): Tracks KPIs for the current month.
- YTD (Year-to-Date): Tracks KPIs from the start of the year to the present date.
Can I integrate my Power BI dashboard with other tools?
Yes! Power BI can connect with Excel, SQL databases, cloud applications, and third-party analytics tools.
Why are LTB and UTB important in KPI analysis?
- LTB (Lower The Better): Metrics where lower values indicate better performance (e.g., Customer Complaints).
- UTB (Upper The Better): Metrics where higher values indicate better performance (e.g., Sales Growth).
How can I customize my KPI dashboard?
You can customize charts, filters, slicers, and color themes in Power BI to suit your business needs.
Can I access my KPI dashboard on mobile?
Yes! Power BI offers mobile-friendly dashboards, allowing businesses to access insights on the go.
Click to buy Small Business KPI Dashboard in Power BI
Visit our YouTube channel to learn step-by-step video tutorials
View this post on Instagram
Click to buy Small Business KPI Dashboard in Power BI