The Staffing Agency Dashboard in Power BI tracks 5 headline KPIs and 12+ chart visualizations across 5 interactive pages — Overview, Recruiter Performance, Client Analysis, Industry Insights, and Placement Pipeline. Setup takes under 10 minutes: open the .pbix file in Power BI Desktop, point it at your own placement data, and every card, chart, and slicer updates automatically.
For staffing agency owners, executive search firms, and in-house talent acquisition teams, this Power BI staffing dashboard replaces $30–$99 per user per month ATS analytics tools with a $17.99 one-time purchase. It works with any data source — Bullhorn export, Zoho Recruit CSV, or a plain Excel file — and gives you fully editable DAX measures to customize every metric.
Key Features of the Staffing Agency Dashboard in Power BI
- 5 headline KPI cards — Total Revenue, Total Records, Total Cost, Total Placements, and Gross Profit — calculated live from your placement data.
- 12+ interactive charts spanning revenue trends, gross margin, placements by region, recruiter leaderboards, client satisfaction, and candidate source breakdowns.
- 5 dedicated report pages — Overview, Recruiter Performance, Client Analysis, Industry Insights, and Placement Pipeline.
- Multi-level slicers on every page for filtering by region, industry, recruiter, status, and date range.
- Fully editable DAX measures — add your own KPIs, duplicate visuals, or rebrand the color palette.
- Built in Power BI Desktop — runs on the free Microsoft tool, no Power BI Pro required unless you want to publish to the Power BI Service.
- Any data source — Excel, CSV, SQL Server, Bullhorn export, Zoho Recruit export, or Google Sheets via OData.
Dashboard Pages Explanation
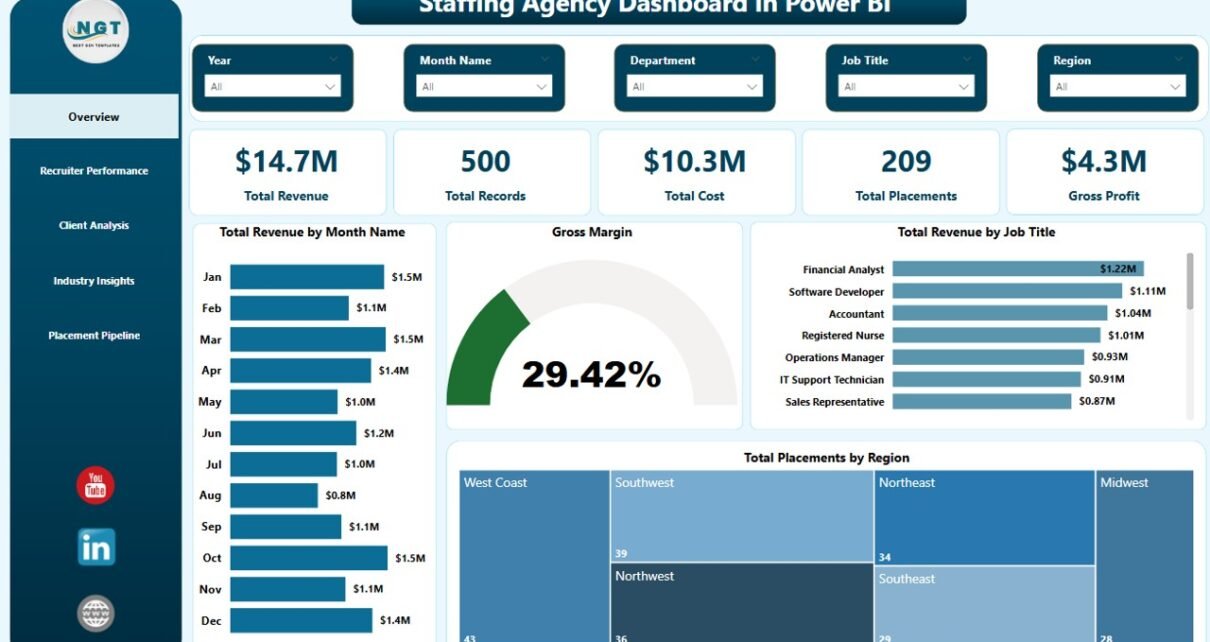
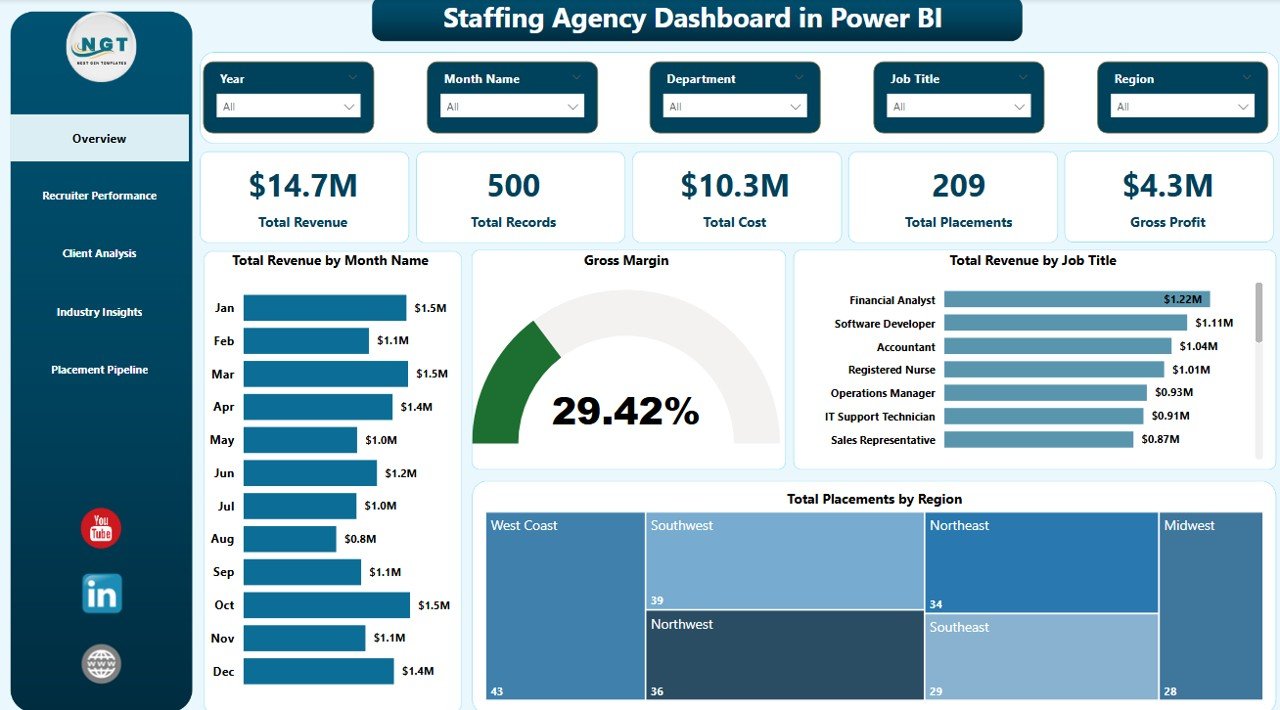
1 – Overview Page
In the sheet on the top, we have the following Cards to show the high-level information:
🔸 Total Revenue
🔸 Total Records
🔸 Total Cost
🔸 Total Placements
🔸 Gross Profit
We have created some charts to show the analysis, and we have created multiple slicers to apply filters and see the filtered dashboard quickly. Here are the Overview page charts, each explained in 2 lines:
Total Revenue by Month Name — Tracks monthly revenue across the full year so you can spot seasonality, peak months, and slow patches. Helps forecast cash flow and pipeline coverage for the next quarter.
Gross Margin — Displays the gross margin percentage against total revenue and cost. Gives instant visibility into profitability trends and helps identify when margin compression starts.
Total Revenue by Job Title — Shows which roles (Data Engineer, Sales Manager, Accountant, etc.) generate the highest billing. Guides specialization and pricing decisions for your agency.
Total Placements by Region — Maps placement volume across regions to highlight where your recruiters are winning and where you should expand market coverage next.
Staffing Agency Dashboard in Power BI — Overview Page
2 – Recruiter Performance
In this sheet tab, we have created the following analyses:
Gross Profit by Recruiter — Ranks every recruiter by profit contribution, not just placement count. Surfaces the quiet high-margin performers who might otherwise go unnoticed.
Avg Time To Fill by Recruiter — Tracks how long each recruiter takes to close a role. Lower is better — this is your speed-to-hire scorecard for coaching conversations.
Avg Satisfaction Score by Recruiter — Captures candidate and client satisfaction per recruiter. Protects quality while you push throughput.
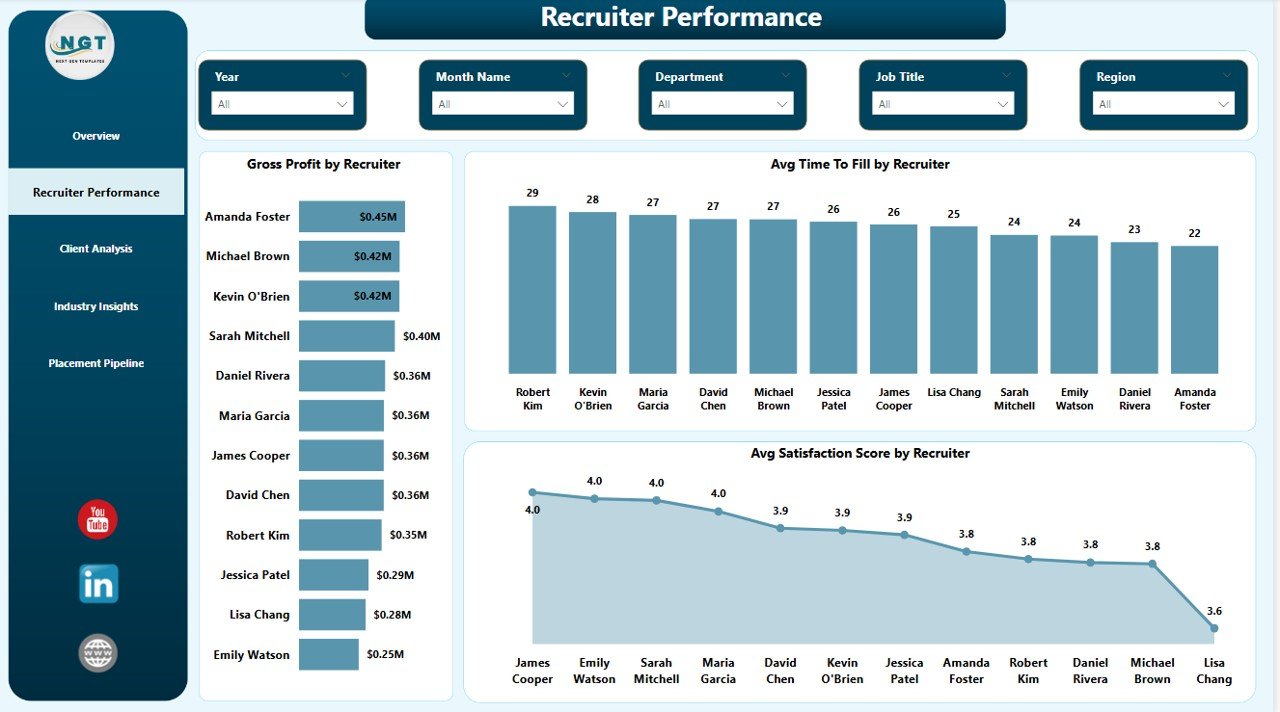
Recruiter Performance
3 – Client Analysis
In this sheet tab, we have created the following analyses:
Total Records and Total Placements by Client Company — Compares pipeline volume vs. closed placements per client to surface your best-converting accounts. Shows which clients actually hire, not just which clients send the most job orders.
Total Revenue by Industry — Shows which verticals drive your top line (Tech, Finance, Healthcare, and so on) so you can double down on the right industries in your sales outreach.
Avg Satisfaction Score by Client Company — Flags clients where delivery is slipping before churn happens. This is your early-warning metric for account managers.
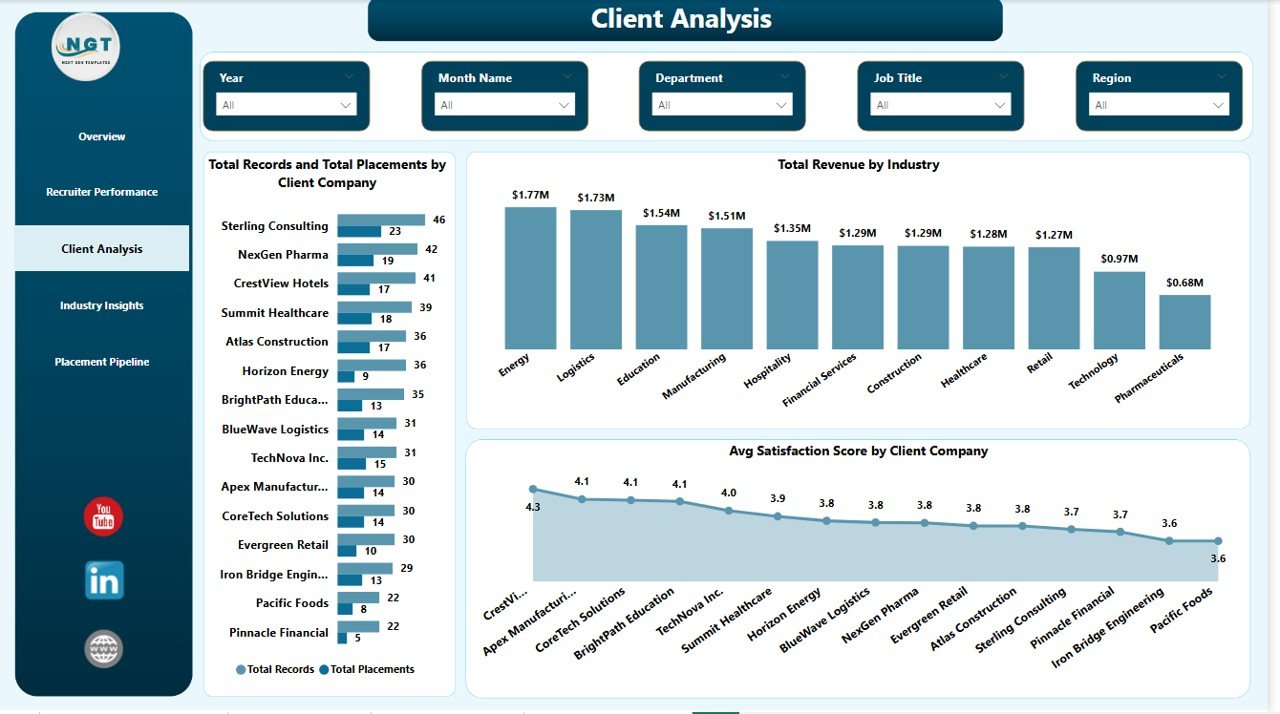
Client Analysis
4 – Industry Insights
In this sheet tab, we have created the following analyses:
Total Records by Industry — Shows where your pipeline is concentrated. Helps decide whether to diversify or specialize further based on where the job orders are coming from.
Gross Profit by Industry — Surfaces which verticals actually make money vs. which just look busy. A margin-first view of your book of business.
Avg Satisfaction Score by Industry — Reveals industries where your fit is strongest and where delivery quality needs work before you take on more clients.
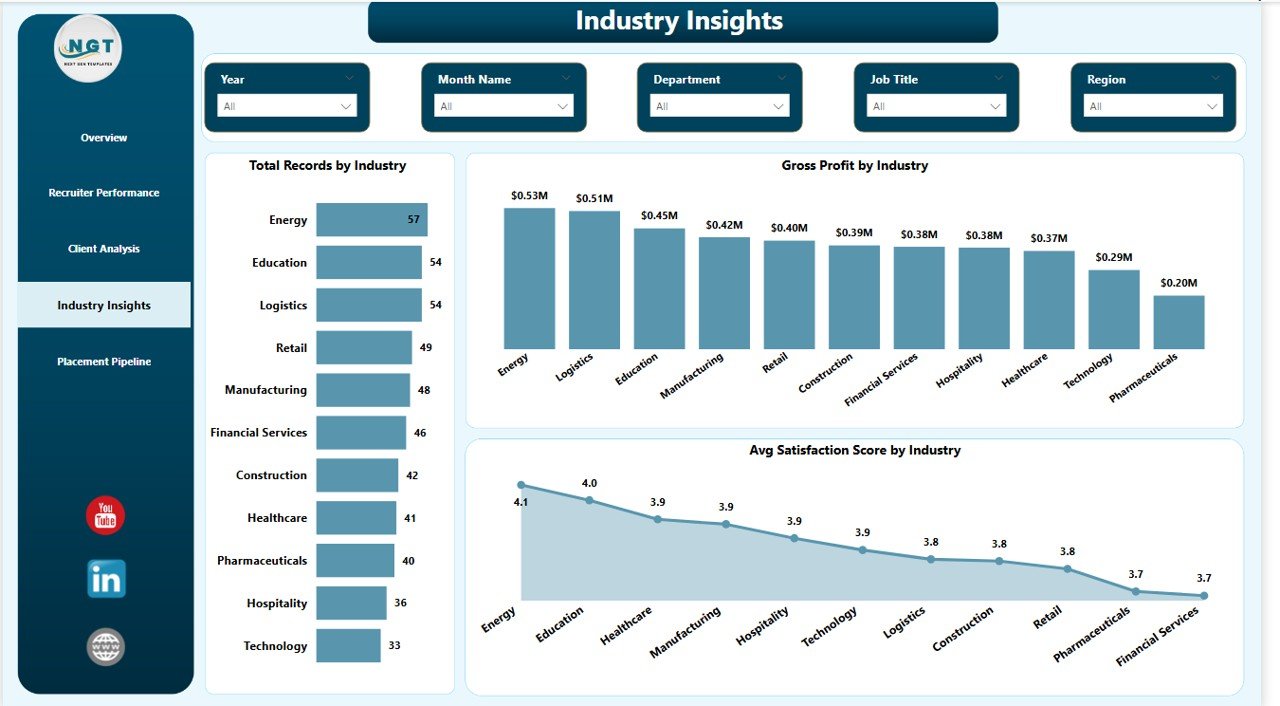
Industry Insights
5 – Placement Pipeline
In this sheet tab, we have created the following analyses:
Total Placements by Candidate Source — Tells you which channel (LinkedIn, referrals, job boards, direct applications) actually delivers hires, not just clicks and applications.
Total Records by Status — A funnel view from applied → interviewed → offered → placed. Exposes the stage where candidates drop off so you can fix the leakage.
Total Revenue by Candidate Source — Ties sourcing channel directly to billed revenue. Lets you kill low-ROI channels and reinvest the budget in the winners.
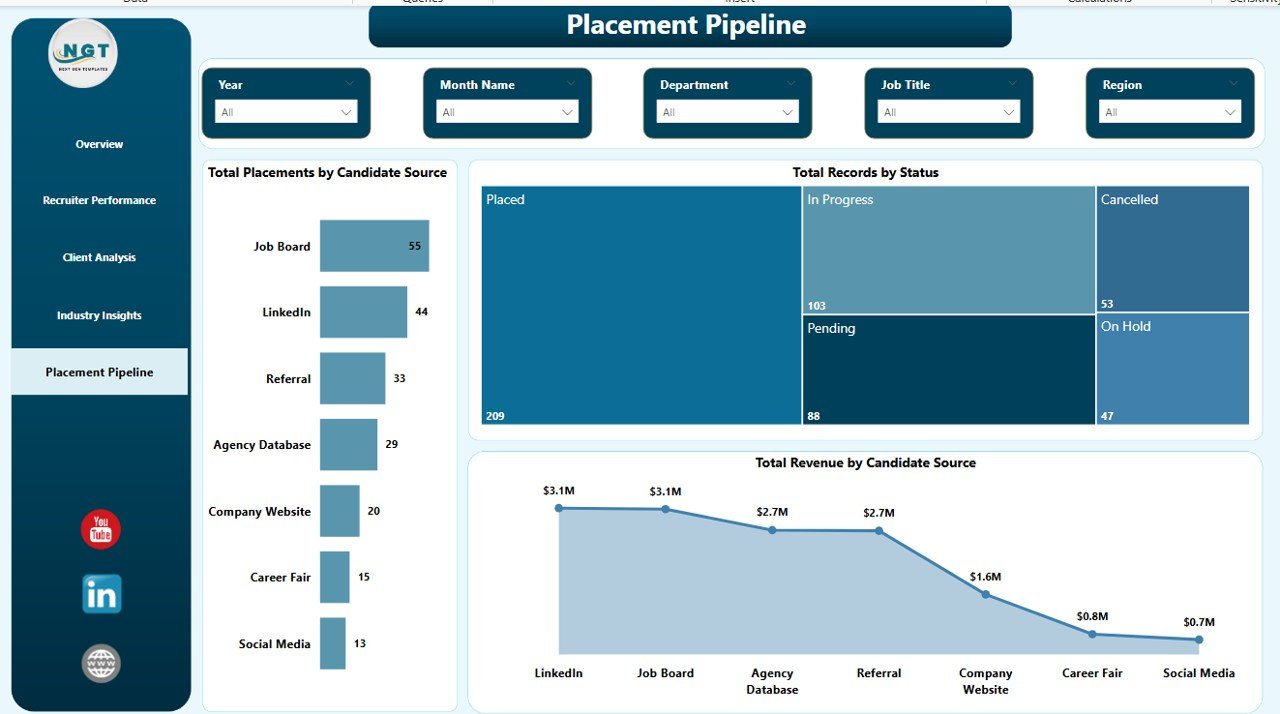
Placement Pipeline
Staffing Agency Dashboard in Power BI vs. Tableau/Qlik vs. Bullhorn/Zoho Recruit — Feature Comparison
| Feature | Staffing Agency Dashboard in Power BI | Tableau / Qlik Sense | Bullhorn / Zoho Recruit |
|---|---|---|---|
| Cost | $17.99 one-time | $70 / user / month | $30–$99 / user / month |
| Platform | Power BI Desktop (free) | Tableau / Qlik | Web-based ATS |
| Setup time | Under 10 minutes | 4–8 hours to build | 2–4 weeks onboarding |
| Pre-built recruiter KPIs | ✅ 15+ charts ready | ❌ Build from scratch | ✅ But locked to their data |
| Works with any data source | ✅ Excel, CSV, SQL | ✅ | ❌ ATS lock-in |
| Editable DAX measures | ✅ Fully customizable | ✅ (Tableau calc fields) | ❌ |
| Year-1 cost at 5 users | $17.99 | $4,200 | $1,800–$5,940 |
| No subscription, no per-user fees | ✅ One-time only | ❌ | ❌ |
For staffing firms that want Bullhorn-grade analytics without the $30–$99/user/month lock-in, the Staffing Agency Dashboard in Power BI sits in the sweet spot.
Who Should Use This Template
Perfect for:
- Staffing agency owners with 2–50 recruiters needing revenue, placements, and recruiter performance in one view
- Executive search firms tracking high-value placements by industry and client company
- In-house talent acquisition leaders reporting recruiter KPIs to the CHRO or founder
- Recruitment consultants exporting data from Bullhorn, Zoho Recruit, or spreadsheets into Power BI
- Agency operations managers running monthly and quarterly business reviews
Not a fit if:
- You’re an enterprise staffing firm with 500+ recruiters needing SOC 2, SSO, and role-based row-level security
- You want a full ATS with CV parsing and email integration — this is analytics, not applicant tracking
- You’ve never opened Power BI Desktop and aren’t willing to spend 15 minutes learning the basics (see Microsoft’s Power BI Desktop getting-started guide)
Real-World Use Cases
Priya runs a 12-person tech recruitment agency in Bengaluru. She uses the Staffing Agency Dashboard in Power BI every Monday morning to review the previous week’s placements, gross profit by recruiter, and candidate source ROI. She drops a screenshot of the Overview page into her team’s WhatsApp group before the 9 AM stand-up and walks through the week’s top-performing recruiters. Six months ago, she cancelled her $390/month Bullhorn analytics add-on after switching — that’s $4,680 a year back in her pocket.
Marcus leads executive search at a boutique firm in London. His quarterly business reviews used to mean three days of copy-pasting between Excel, PowerPoint, and Bullhorn exports. Now he plugs monthly placement data into the Industry Insights and Client Analysis pages, screenshots the Gross Profit by Industry chart, and presents directly to his managing partners. What used to take a week now takes an hour.
Ayesha is a solo recruitment consultant placing finance candidates on contract. She uses the Placement Pipeline page to see which candidate sources — LinkedIn, referrals, or job boards — actually convert to billed revenue, and reallocates her sourcing hours accordingly. When she realized LinkedIn was producing 60% of her applications but only 18% of her placements, she cut her LinkedIn recruiter seat and doubled down on referral bonuses. The dashboard paid for itself the first week.
Advantages of the Staffing Agency Dashboard in Power BI
- Saves $1,800–$5,940 per year vs. an equivalent Bullhorn or Zoho Recruit analytics subscription at 5 users.
- Under 10-minute setup — open the .pbix, replace sample data, click Refresh. No IT project, no onboarding call.
- Works with any data source, so you’re not locked to a single ATS. Migrate systems and keep your dashboard.
- Editable DAX measures give you full control — add custom KPIs like “placements per recruiter per week” or “revenue per candidate source per quarter” in minutes.
- Shareable via Power BI Service — one live link for your team, clients, or leadership (requires Power BI Pro).
- Lifetime access, no subscription — $17.99 one time and you own it forever across unlimited projects.
Opportunities for Improvement
No tool is perfect, and being upfront about limits helps you decide whether the Staffing Agency Dashboard in Power BI is the right fit:
- Not a replacement for a full ATS. The dashboard analyzes your placement data — it doesn’t parse CVs, send interview emails, or track candidate stages in real time. Pair it with your existing ATS.
- Row-level security is manual. Enterprise firms that need per-recruiter data isolation will have to set up row-level security (RLS) themselves in Power BI Service.
- Requires data structure discipline. If your placement records live across multiple spreadsheets with inconsistent columns, you’ll need to consolidate them first — the dashboard expects one clean placements table.
- Mobile layout is adequate, not optimized. Power BI mobile renders the report but the mobile-specific layout isn’t pre-built. You can create one in Power BI Desktop if needed.
Best Practices
- Clean your source data before loading. The dashboard is only as good as the placement table feeding it. Enforce consistent recruiter names, industry labels, and candidate source values.
- Refresh weekly at minimum. Staffing data goes stale fast — a weekly refresh keeps leadership conversations relevant. Use Power BI Service for scheduled refresh.
- Use slicers intentionally. Filter by region + industry + time window to spot micro-trends (e.g., “what happened to finance placements in Europe last quarter?”).
- Add custom DAX measures for your agency’s unique KPIs. Things like “days from offer to placement” or “revenue per active job order” take 5 minutes to add.
- Publish to Power BI Service so your team has a live link instead of emailing .pbix files around.
- Pair with the Excel or HTML versions if some stakeholders don’t have Power BI Desktop — both are available on NextGenTemplates.
Explore Relevant Templates
If you liked the Staffing Agency Dashboard in Power BI, check out these related templates on NextGenTemplates:
- Executive Search and Staffing Dashboard in Power BI — focused on C-suite and senior leadership placements with higher-value deal tracking.
- Recruitment Agencies Dashboard in Power BI — sibling dashboard focused on agency-wide recruitment metrics.
- Recruitment Agencies KPI Dashboard in Power BI — scorecard-style view with traffic-light KPIs for agency leadership.
- Interview Scheduling Management System V1.0 — Excel VBA tool for coordinating candidate and panel interviews.
- Browse all Power BI Dashboard Templates
🔄 Also available as: Staffing Agency Dashboard in Excel · Staffing Agency Dashboard in HTML.
Frequently Asked Questions
What KPIs does the Staffing Agency Dashboard in Power BI track?
The Staffing Agency Dashboard in Power BI tracks 5 headline KPIs — Total Revenue, Total Records, Total Cost, Total Placements, and Gross Profit — plus 12+ supporting metrics including gross margin, revenue by month, time-to-fill by recruiter, satisfaction score by client, and placements by candidate source.
Do I need Power BI Pro to use this dashboard?
No. The Staffing Agency Dashboard in Power BI runs on Power BI Desktop, which Microsoft offers free. You only need Power BI Pro ($10/user/month) if you want to publish the dashboard to Power BI Service and share it with colleagues via a live link.
How does this compare to Bullhorn or Zoho Recruit analytics?
Bullhorn and Zoho Recruit cost $30–$99 per user per month and lock data inside their ATS. The Staffing Agency Dashboard in Power BI is a $17.99 one-time purchase, works with any data source, and gives you fully editable DAX measures — no per-user fees, ever. At 5 users, that’s a first-year saving of $1,800–$5,940.
How long does setup take?
Under 10 minutes for most users. Open the .pbix file in Power BI Desktop, replace the sample placement table with your own data (same column structure), and click Refresh. All 5 pages and 12+ charts update automatically from the new data.
What data format does the dashboard expect?
The Staffing Agency Dashboard in Power BI expects one placements table with columns like Placement Date, Recruiter, Client Company, Industry, Job Title, Region, Candidate Source, Status, Revenue, Cost, Time to Fill, and Satisfaction Score. Column mapping details are shown inside the .pbix file itself.
Can I add my own custom KPIs and charts?
Yes. Every DAX measure, chart, and slicer in the Staffing Agency Dashboard in Power BI is fully editable. Add new measures, duplicate visuals, rebrand the color palette, or rearrange pages to match your agency’s reporting style. See the Microsoft DAX reference if you need measure syntax help.
Is this a one-time purchase or a subscription?
One-time purchase. $17.99 gets you lifetime access to the Staffing Agency Dashboard in Power BI with no recurring fees, no per-user charges, and no subscription renewals. Download once, use forever across unlimited projects.
About the Author
Built by PK — Microsoft Certified Professional with 15+ years of Excel, Google Sheets, and Power BI experience. Founder of NextGenTemplates, reaching 300K+ subscribers across YouTube channels. Every template is hand-built and tested before release.
Conclusion
The Staffing Agency Dashboard in Power BI gives staffing agency owners, executive search firms, and in-house talent acquisition teams a complete view of revenue, placements, recruiter performance, client satisfaction, and candidate source ROI — for a $17.99 one-time purchase instead of $30–$99 per user per month.
👉 Click here to Purchase the Staffing Agency Dashboard in Power BI
✅ Instant download · One-time payment · No subscription
🎥 Visit Youtube.com/@PK-AnExcelExpert for step-by-step video tutorials on Power BI dashboards, DAX, and Excel analytics.