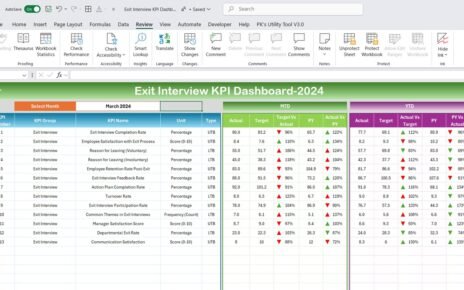
Tracking the growth and performance of a startup is vital for its success. With limited resources and high stakes, startups need to monitor their performance metrics closely to ensure they are on the right path. The Startup Growth KPI Dashboard in Excel is a powerful tool that simplifies performance tracking, allowing startups to stay data-driven and agile.
Click to Startup Growth KPI
This article will guide you through the features, advantages, best practices, and frequently asked questions about the Startup Growth KPI Dashboard in Excel, ensuring you have everything you need to leverage this tool effectively.
Key Features of the Startup Growth KPI Dashboard
The Startup Growth KPI Dashboard includes seven essential worksheets, each designed to streamline your KPI tracking process. Here’s a detailed breakdown:
Home Sheet

- Serves as the index sheet.
- Contains six navigation buttons to jump directly to respective sheets.
- Simplifies user interaction and navigation.
Dashboard Sheet Tab

Click to Startup Growth KPI
- Acts as the main dashboard to visualize all KPIs.
- Features dropdown functionality at cell D3 to select a specific month, dynamically updating the dashboard data.
- Displays:
- MTD (Month-to-Date) Actual, Target, and Previous Year Data
- YTD (Year-to-Date) Actual, Target, and Previous Year Data
- Includes Conditional Formatting with up and down arrows to indicate performance trends:
- Target vs. Actual
- Previous Year vs. Actual
KPI Trend Sheet Tab

- Enables detailed trend analysis for selected KPIs.
- Dropdown menu at cell C3 allows you to choose a KPI for review.
- Displays:
- KPI Group
- Unit of KPI
- Type (e.g., Lower is Better or Upper is Better)
- KPI Formula and Definition
- Offers visual charts for MTD and YTD trends comparing Actual, Target, and Previous Year data.
Click to Startup Growth KPI
Actual Numbers Input Sheet

- Used for entering MTD and YTD actual numbers for specific months.
- Range E1 allows you to set the first month of the year, automatically updating all month-related calculations.
Target Sheet Tab

- Facilitates input of target numbers for each KPI, both MTD and YTD.
- Ensures all performance goals are centralized and easily accessible.
Click to Startup Growth KPI
Previous Year Numbers Sheet Tab

- Stores the previous year’s performance data in the same format as the current year.
- Enables seamless year-over-year comparisons.
KPI Definition Sheet Tab

- Centralizes key information about each KPI, including:
- KPI Name
- KPI Group
- Unit
- Formula
- Definition
Advantages of the Startup Growth KPI Dashboard
- Improved Decision-Making: With real-time data and dynamic visualizations, leaders can make informed decisions quickly.
- Enhanced Performance Tracking: Track MTD and YTD performance metrics against targets and previous year data, ensuring continuous growth.
- Simplified Data Management: Centralized sheets for actuals, targets, and definitions reduce the complexity of managing data across multiple sources.
- Customizable and Scalable: Adapt the dashboard to your startup’s unique KPIs, ensuring relevance as your business scales.
Click to Startup Growth KPI
Best Practices for Using the Startup Growth KPI Dashboard
- Define Relevant KPIs: Identify KPIs that align with your startup’s goals. Avoid tracking too many metrics to prevent overwhelming your team.
- Ensure Data Accuracy: Double-check inputs in the Actual Numbers and Target sheets to ensure the dashboard reflects accurate performance data.
- Update Regularly: Keep the dashboard updated with current data to maintain its effectiveness. Set a schedule to input numbers consistently.
- Leverage Trend Analysis: Use the KPI Trend Sheet to identify patterns and address potential issues before they escalate.
- Customize for Your Needs: Add or modify KPI definitions, formulas, and visualizations to make the dashboard more relevant to your startup’s industry.
Advantages of a Data-Driven Approach for Startups
Adopting a data-driven mindset can significantly enhance a startup’s ability to adapt and grow. This KPI dashboard fosters a culture of accountability and informed decision-making by keeping critical data accessible and actionable.
Conclusion
The Startup Growth KPI Dashboard in Excel is an indispensable tool for startups looking to streamline their performance tracking. By leveraging its features and following best practices, you can stay ahead of the curve, identify growth opportunities, and ensure long-term success.
Click to Startup Growth KPI
Frequently Asked Questions
Q. What is a KPI Dashboard?
A KPI Dashboard is a visual tool that consolidates and presents key performance indicators in an easy-to-read format. It helps businesses track progress and make informed decisions.
Q. Why is this dashboard useful for startups?
Startups operate in dynamic environments with limited resources. This dashboard simplifies performance tracking, enabling startups to focus on scaling effectively.
Q. Can I customize the KPIs in this dashboard?
Yes, you can add, remove, or modify the KPIs in the KPI Definition Sheet tab to tailor the dashboard to your specific needs.
Q. How often should I update the dashboard?
It’s best to update the dashboard monthly to ensure that MTD and YTD data remain accurate and relevant.
Q. What tools do I need to use this dashboard?
You only need Microsoft Excel to use this dashboard. It is compatible with most Excel versions.
Q. Is this dashboard suitable for non-technical users?
Yes, the dashboard’s intuitive design and clear instructions make it accessible for users with minimal technical expertise.
By implementing the Startup Growth KPI Dashboard in Excel, you can transform raw data into actionable insights, ensuring your startup stays on track to achieve its goals. Get started today and take your growth tracking to the next level!
Click to Startup Growth KPI
Visit our YouTube channel to learn step-by-step video tutorials
View this post on Instagram


