Monitoring supplier performance is crucial for ensuring a smooth supply chain, reducing risks, and improving procurement efficiency. An Excel-based Supplier Performance KPI Dashboard provides a structured and automated way to track and evaluate key supplier metrics in real-time. This article explores the key features, advantages, and best practices of using a Supplier Performance KPI Dashboard in Excel while also answering common questions about its implementation.
Click to Supplier Performance KPI
Why Use a Supplier Performance KPI Dashboard?
A Supplier Performance KPI Dashboard helps businesses evaluate and measure supplier performance based on critical parameters such as on-time delivery, quality performance, compliance, cost efficiency, and responsiveness. By implementing this dashboard, organizations can:
- Identify top-performing and underperforming suppliers.
- Enhance supply chain efficiency by improving supplier collaboration.
- Ensure cost savings by reducing delays and quality issues.
- Improve decision-making using real-time data insights.
- Track performance trends over time to optimize procurement strategies.
Key Features of the Supplier Performance KPI Dashboard
This ready-to-use Excel template provides a structured approach to tracking supplier KPIs. Below are the key features of the dashboard:
Home Sheet
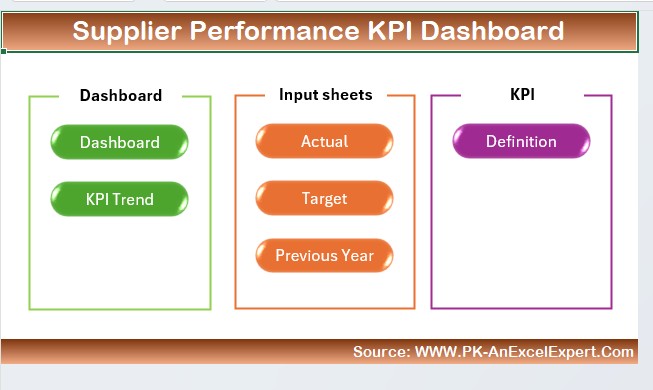
- Acts as an index page with navigation buttons to access different sheets.
- Contains six clickable buttons to jump to relevant sheets easily.
Click to Supplier Performance KPI
Dashboard Sheet Tab
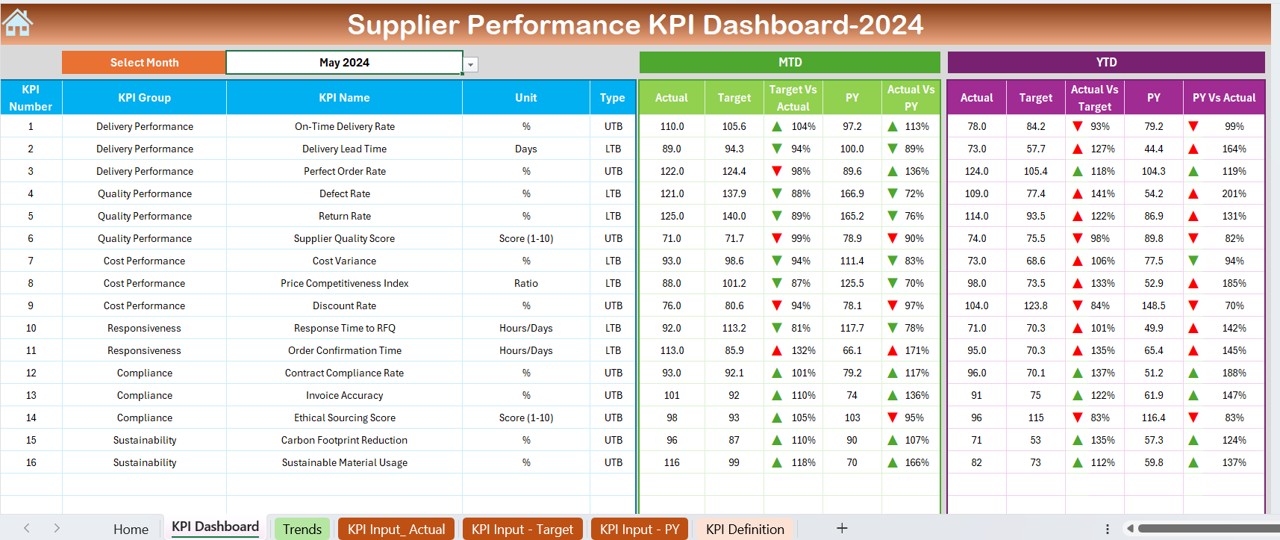
- Displays a summary of all supplier KPIs.
- Allows users to select a specific month from a dropdown (cell D3) to filter data accordingly.
- Provides insights into MTD (Month-To-Date) Actual, Target, and Previous Year data.
- Uses conditional formatting (up/down arrows) to indicate performance trends.
- Displays YTD (Year-To-Date) Actual, Target, and Previous Year data.
KPI Trend Sheet Tab
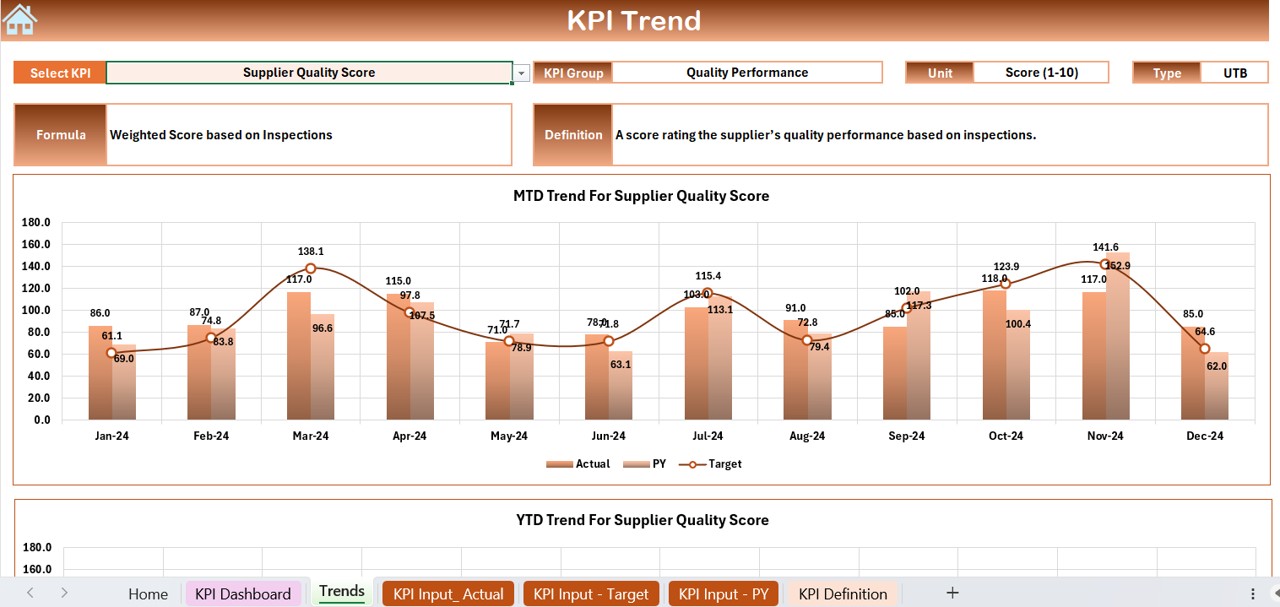
- Enables selection of a specific KPI (Dropdown in cell C3).
- Displays essential KPI details:
- KPI Group
- Unit of KPI measurement
- KPI type (Lower the Better or Upper the Better)
- Formula used to calculate KPI
- KPI definition
- Shows trend charts for MTD and YTD values comparing Actual, Target, and Previous Year data.
Click to Supplier Performance KPI
Actual Numbers Input Sheet
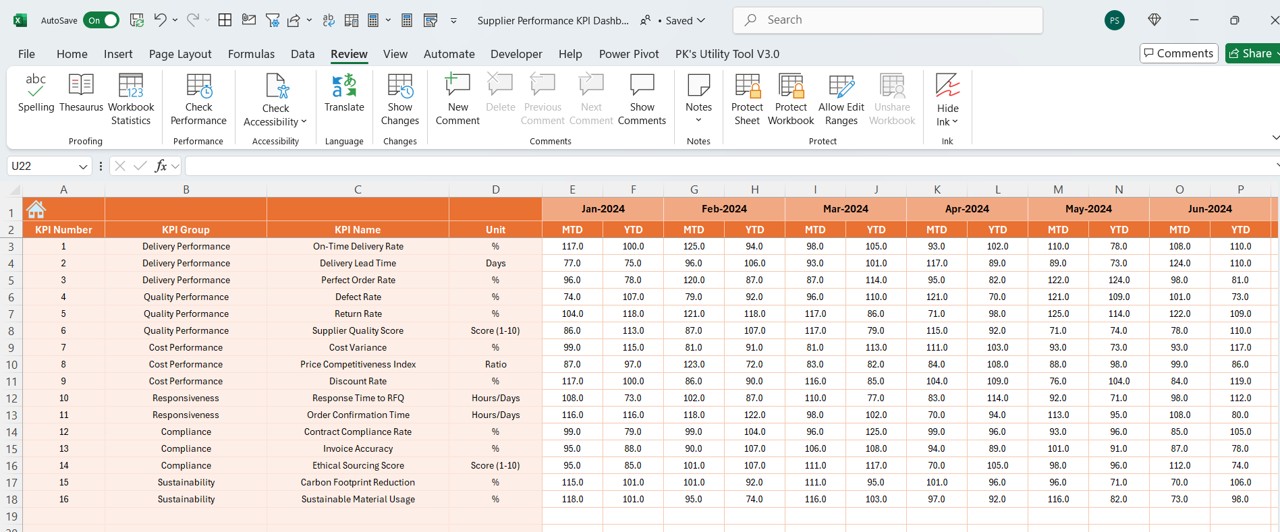
- Users manually enter actual KPI values for MTD and YTD.
- Month selection available in cell E1 to update data accordingly.
Target Sheet Tab
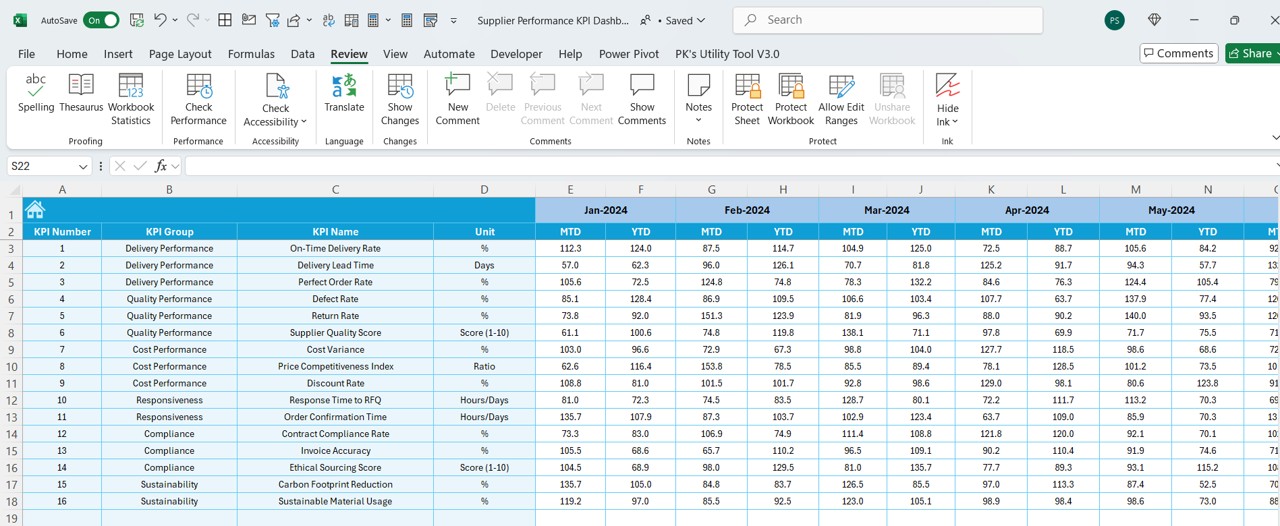
- Contains fields to input target values for each KPI.
- Data is recorded both monthly (MTD) and yearly (YTD).
Previous Year Numbers Sheet Tab
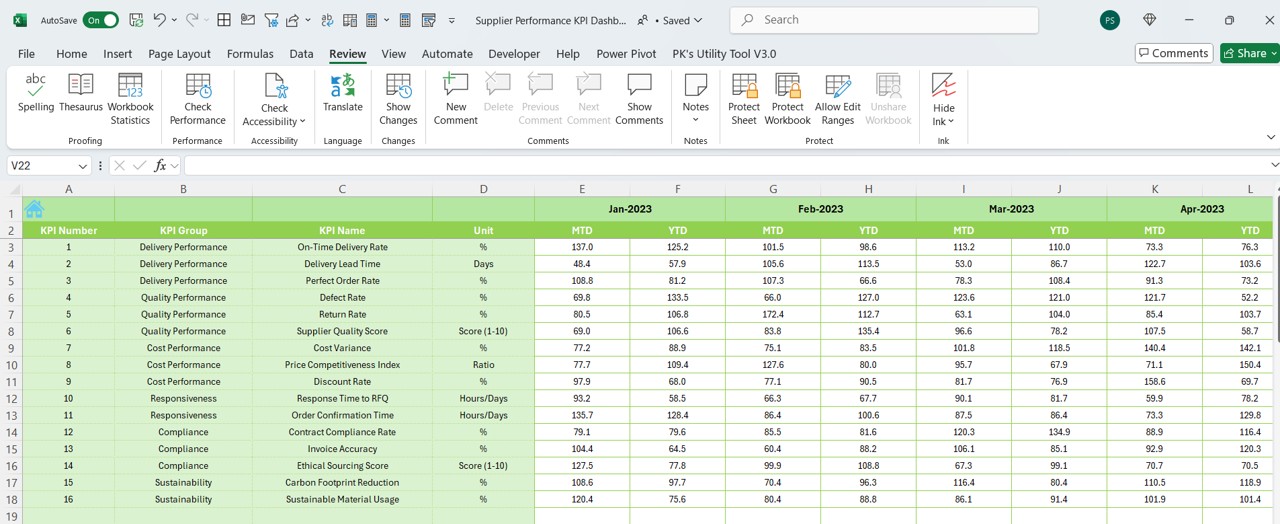
- Used to enter historical performance data from the previous year.
Helps in benchmarking current performance against past trends.
KPI Definition Sheet Tab
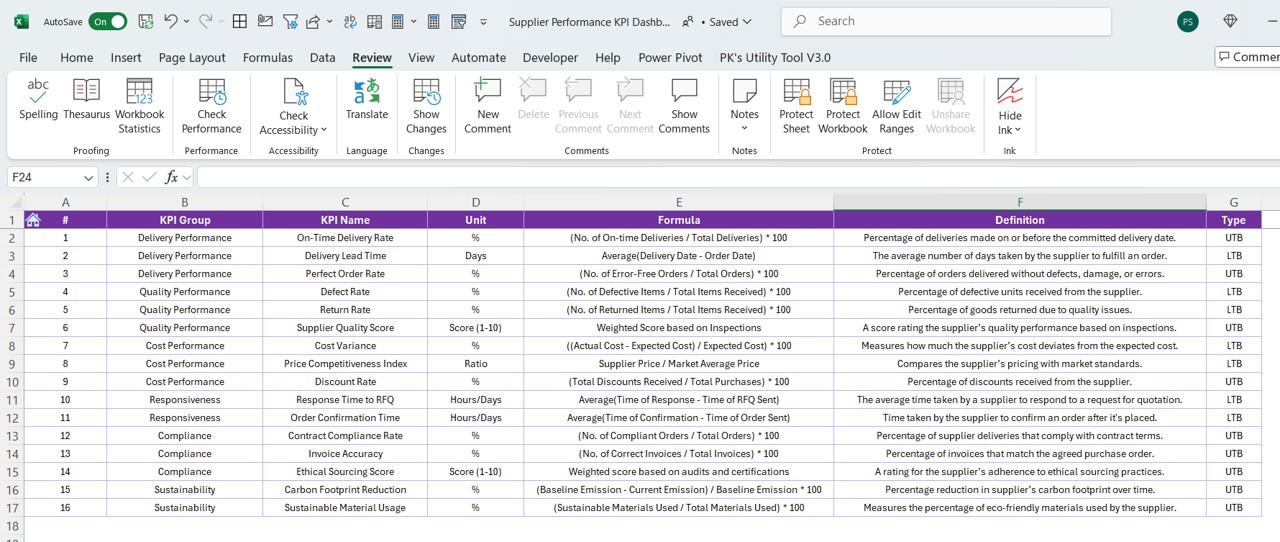
- Stores detailed information about each KPI, including:
- KPI Name
- KPI Group
- Unit of Measurement
- Calculation Formula
- Definition of KPI
Click to Supplier Performance KPI
Advantages of the Supplier Performance KPI Dashboard
Real-time Data Analysis
- Get instant visibility into supplier performance.
- Compare actual vs. target numbers with clear visual indicators.
Performance Tracking & Improvement
- Helps track trends over time to identify patterns.
- Assists in making strategic procurement decisions.
Enhanced Supplier Relationship Management
- Encourages collaborative discussions with suppliers based on data insights.
- Enables proactive issue resolution to avoid supply chain disruptions.
Customization & Flexibility
- Users can easily customize the template to meet business-specific needs.
- Works without complex software—just Excel is needed!
Cost-Effective Solution
- No need for expensive procurement software.
- Provides a structured yet simple way to monitor supplier performance.
Click to Supplier Performance KPI
Best Practices for Using the Supplier Performance KPI Dashboard
✅ Define Clear KPIs: Identify supplier-specific KPIs that align with business goals.
✅ Regular Data Updates: Ensure MTD and YTD values are updated regularly.
✅ Set Achievable Targets: Use historical data to set realistic KPI goals.
✅ Use Visual Indicators: Leverage conditional formatting for quick insights.
✅ Monitor Trends: Analyze monthly and yearly trends to predict future performance.
✅ Review & Improve: Schedule regular supplier performance reviews.
Conclusion
A well-structured Supplier Performance KPI Dashboard in Excel is a game-changer for businesses looking to track, analyze, and improve supplier relationships. It provides an efficient, cost-effective, and customizable way to monitor critical supplier metrics. Implementing this dashboard enhances transparency, streamlines procurement processes, and supports data-driven decision-making.
Frequently Asked Questions (FAQs)
What are the key KPIs to track in a Supplier Performance Dashboard?
Some essential supplier KPIs include On-Time Delivery Rate, Defect Rate, Cost Performance, Order Accuracy, Compliance Rate, and Responsiveness.
Can I customize the KPI Dashboard to fit my business needs?
Yes! The Excel template is fully customizable—you can modify KPIs, add new categories, or update formulas as needed.
How often should I update the supplier performance data?
For accurate analysis, update the dashboard monthly (MTD) and yearly (YTD). Regular updates help track trends and improve supplier collaboration.
Do I need advanced Excel skills to use this dashboard?
Not necessarily. Basic Excel knowledge is sufficient, but familiarity with dropdowns, formulas, and conditional formatting helps in better understanding and customization.
Can I integrate this dashboard with other data sources?
Yes! You can link this Excel dashboard to Power BI, Google Sheets, or external databases for advanced reporting and automation.
Click to Supplier Performance KPI
Visit our YouTube channel to learn step-by-step video tutorials
View this post on Instagram