In today’s fast-moving world of Supply Chain KPI and logistics, keeping track of everything can be overwhelming. That’s where Key Performance Indicators (KPIs) come in. They’re like your business’s report card, measuring how well you’re doing in terms of efficiency, productivity, and overall success. But it doesn’t stop there—having these KPIs in a simple and easy-to-use dashboard can help you make faster, better decisions.
Let’s dive into a powerful tool that can transform the way you manage your supply chain: the Supply Chain – Logistics KPI Dashboard. Whether you’re monitoring shipping times, inventory turnover, or order accuracy, this dashboard will give you all the information you need to stay ahead.
Key Features of the Supply Chain KPI – Logistics KPI Dashboard
This dashboard is designed to be your go-to tool for managing your logistics efficiently. It includes seven key worksheets, each with a specific function to help you get the most out of your data.
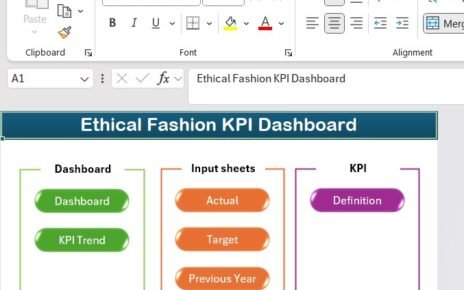
- Home Sheet: Your Control Center
Think of the Home Sheet as your dashboard’s control center. It’s where everything starts, offering a simple and intuitive way to navigate between the different sections. With just six easy-to-use buttons, you can jump between the various parts of the dashboard in no time. No more scrolling through endless tabs!

Click to buy Supply Chain KPI Dashboard In Excel
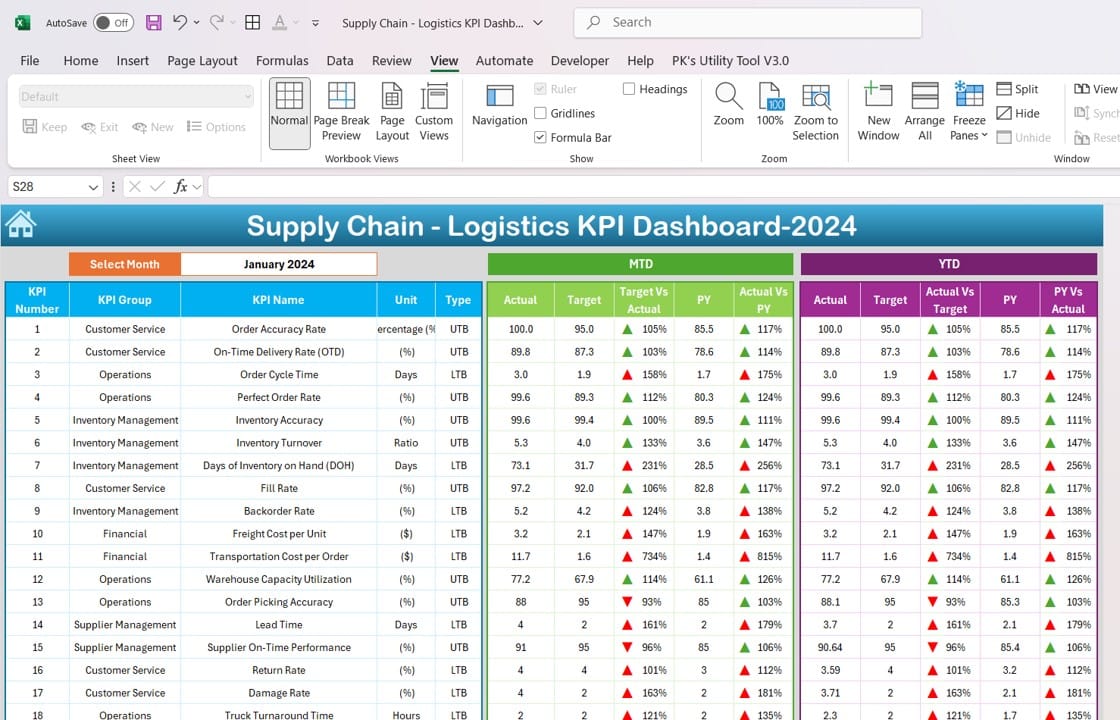
- Dashboard Sheet: The Heart of the System
This is where all the action happens. The Dashboard Sheet is your one-stop-shop for all the key metrics. You can select any month from a dropdown menu in cell D3, and the sheet will instantly update to show data for that month. Here’s what it includes:
- MTD (Month-to-Date) Actual: Real numbers for the selected month.
- MTD Target: The target you set for that month.
- Previous Year Data: What were last year’s numbers for the same month? This helps track trends.
- MTD Comparison: How do your target and previous year’s data compare to actual performance? Conditional formatting with up/down arrows makes it easy to see whether you’re hitting or missing targets.
- YTD (Year-to-Date) Data: You can also get a bigger picture view with cumulative performance data for the year, including comparisons to targets and last year’s numbers.
Click to buy Supply Chain KPI Dashboard In Excel
-
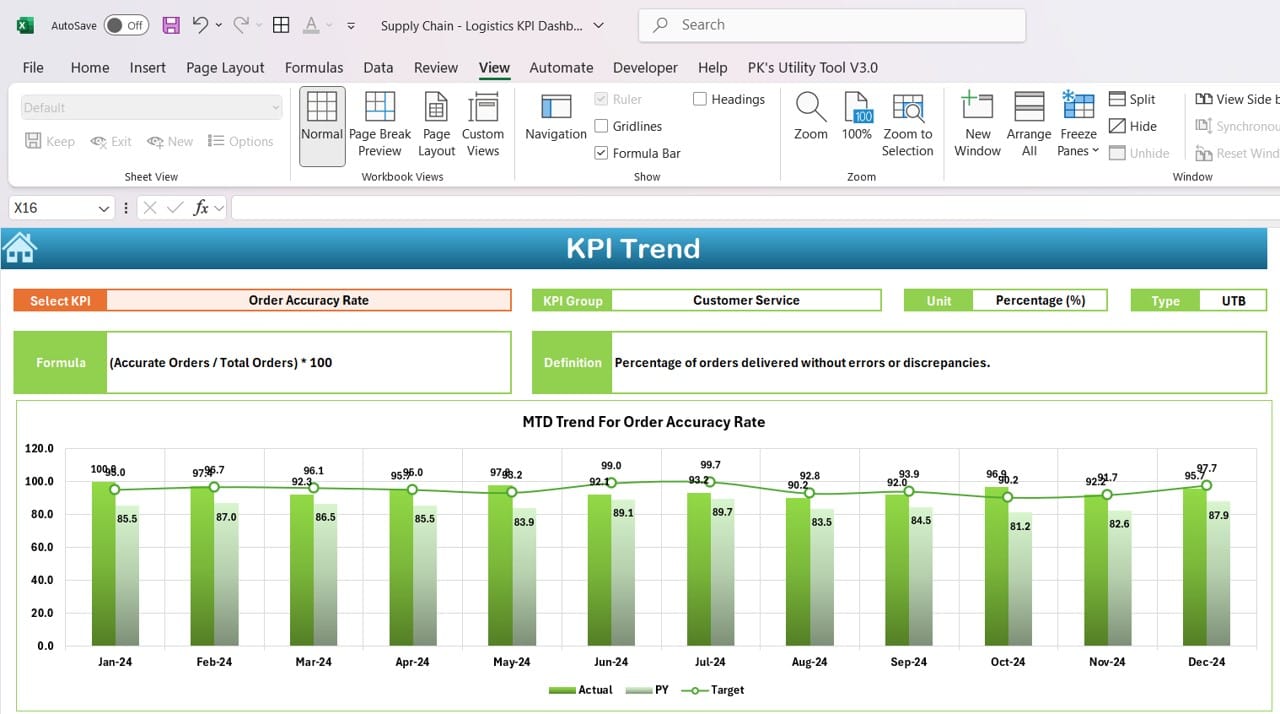
KPI Trend Sheet: Deep Dive into Metrics
Want to dig deeper into individual KPIs? The KPI Trend Sheet is the place to be. From a dropdown menu in cell C3, you can choose any KPI to see all the details, like:
- KPI Group: Categorize your KPIs (e.g., “Inventory Management” or “Delivery Efficiency”).
- Unit of KPI: Know what you’re measuring (e.g., percentage, units, etc.).
- Type of KPI: Is this a metric where “Lower is Better” (like costs) or “Higher is Better” (like accuracy)?
- Formula and Definition: Each KPI comes with a clear formula and definition, so everyone knows what’s being measured and how.
Click to buy Supply Chain KPI Dashboard In Excel
-
Actual Number Sheet: Stay on Track
The Actual Number Sheet is where you input the real numbers for both MTD and YTD performance. If you need to change the reference month, you can do so by editing cell E1. This gives you the flexibility to always view the correct period’s data, ensuring you’re tracking the right metrics at the right time.

Click to buy Supply Chain KPI Dashboard In Excel
-
Target Sheet: Define Your Goals
Setting goals is critical for success. The Target Sheet allows you to input target numbers for each KPI, both for MTD and YTD. These targets are then compared against your actual data in the dashboard, helping you quickly see if you’re on track to meet your goals.

Click to buy Supply Chain KPI Dashboard In Excel
-
Previous Year Number Sheet: Compare Performance
In the Previous Year Number Sheet, you enter the numbers for the corresponding months from the previous year. This lets the dashboard provide a year-over-year comparison, which is crucial for identifying long-term trends and performance improvements.

Click to buy Supply Chain KPI Dashboard In Excel
-
KPI Definition Sheet: Clarity for Everyone
Finally, the KPI Definition Sheet is your reference guide for each KPI. You can define the KPI name, group, unit, formula, and a clear definition. This ensures that everyone in your organization understands what each KPI represents and how it’s calculated, leaving no room for confusion.

Click to buy Supply Chain KPI Dashboard In Excel
Advantages of Using a Supply Chain – Logistics KPI Dashboard
So, why should you use a Supply Chain – Logistics KPI Dashboard? Let’s take a look at some key benefits.
- Real-Time Tracking and Quick Decision-Making
One of the best things about this dashboard is its ability to offer real-time tracking. You don’t have to wait until the end of the month or quarter to see how your operations are performing. You can spot issues as they happen and make data-driven decisions to improve your performance on the go.
- Complete Visibility Across Your Supply Chain
A centralized dashboard means you can see everything at a glance. From tracking shipments to monitoring inventory levels, having all the information in one place allows you to make sure everything is running smoothly and on time.
- Improved Efficiency and Performance Management
With the ability to set clear targets and see actual performance data, you can quickly identify areas that need improvement. If something’s not working, you’ll know about it right away and can adjust your strategies accordingly. This means less guesswork and more efficiency.
Best Practices for Using a Supply Chain – Logistics KPI Dashboard
While the dashboard is a powerful tool, using it the right way can take your results to the next level. Here are some best practices to keep in mind.
- Regularly Update Your Data
To get the most accurate results, you should update the actual numbers regularly. Set a schedule for how often you’ll update the data—whether it’s daily, weekly, or monthly. The more frequently you update, the more accurate your decisions will be.
- Set Clear and Measurable Targets
Every KPI should have a clear and measurable target. Without a target, it’s tough to know if you’re on track or falling behind. Make sure your targets are in line with your business objectives and regularly review them to ensure they’re still relevant.
- Customize the Dashboard to Fit Your Needs
Not all businesses are the same, so don’t hesitate to customize the dashboard to reflect your specific needs. Whether it’s adding new KPIs or removing ones that don’t apply to your operation, making the dashboard work for your business will help you get the most out of it.
Opportunities for Improvement in Supply Chain – Logistics KPI Dashboards
Even with all the advantages, there are still ways to make your KPI dashboard even better.
- Expanding KPI Coverage
While this dashboard covers many essential KPIs, businesses can always go further by expanding KPI coverage. Consider adding more detailed metrics like supplier lead times, freight costs, or order fill rates to get an even clearer picture of your supply chain.
- Integrating AI and Predictive Analytics
The future of KPI dashboards is all about AI and machine learning. By incorporating these technologies, you can not only track performance but also predict future trends and get automated suggestions on how to improve. This could make your dashboard even more powerful.
Conclusion
A well-designed Supply Chain – Logistics KPI Dashboard is a game-changer for businesses that want to stay on top of their supply chain performance. By tracking key metrics, setting clear targets, and keeping your data updated, you’ll be able to make smarter decisions and stay competitive in today’s fast-paced logistics environment.
Visit our YouTube channel to learn step-by-step video tutorials
Click to buy Supply Chain KPI Dashboard In Excel