Sustainability is more than just a trend; it has become an essential part of business operations. Companies across industries are increasingly focusing on sustainability initiatives to reduce their environmental impact and improve efficiency. However, monitoring these efforts can be quite challenging. This is where a Sustainability Metrics KPI Dashboard in Excel comes in handy.
In this guide, we will take you through the Sustainability Metrics KPI Dashboard, explaining its features, benefits, best practices, and how you can use it effectively.
Click to Sustainability Metrics KPI
What is a Sustainability Metrics KPI Dashboard?
A Sustainability Metrics KPI Dashboard is a data visualization tool that helps businesses track and analyze their sustainability goals. It consolidates key sustainability indicators into a single, easy-to-read dashboard, allowing businesses to make informed decisions.
- Using an Excel-based dashboard, you can:
- Track environmental and social impact.
- Monitor energy consumption, carbon emissions, and waste management.
- Compare actual performance against goals and previous years.
- Generate reports for internal use and external stakeholders.
Key Features of the Sustainability Metrics KPI Dashboard
- This Excel-based dashboard is structured into seven different worksheets, each designed for a specific purpose.
Home Sheet
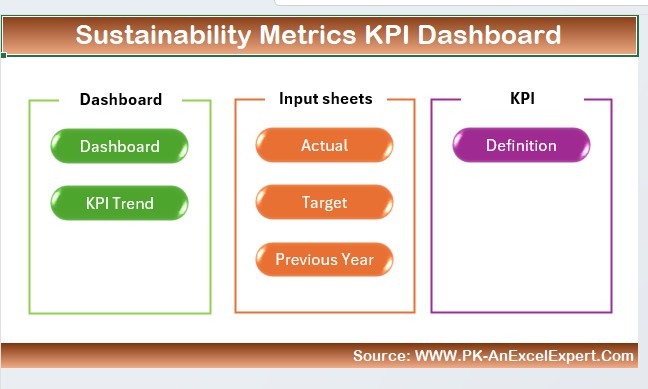
- Serves as the navigation hub for the entire dashboard.
- Includes six quick-access buttons for easy movement between sheets.
Click to Sustainability Metrics KPI
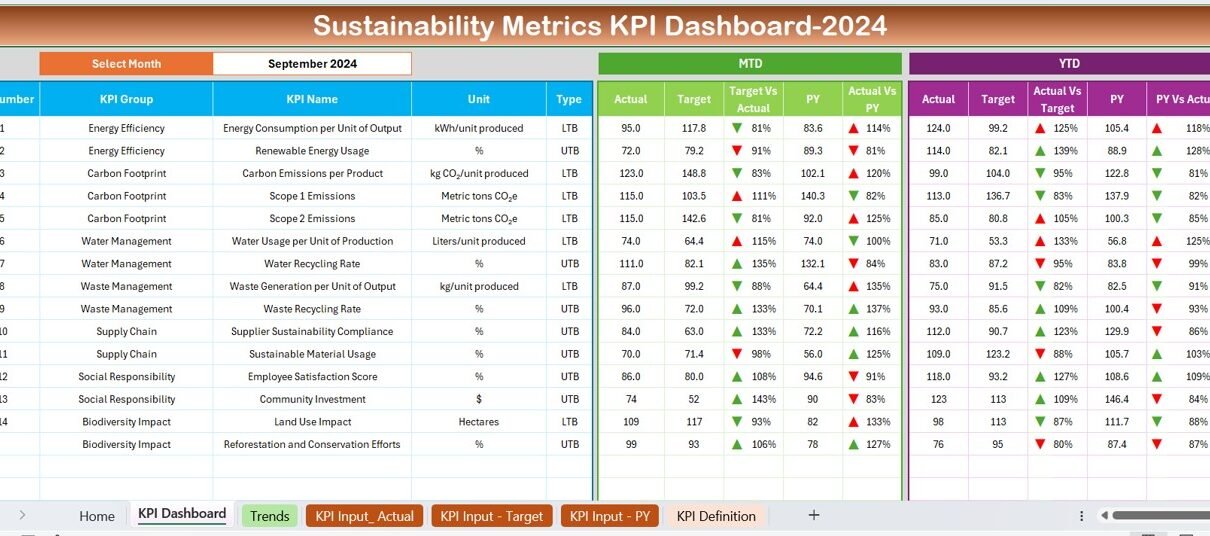
Dashboard Sheet
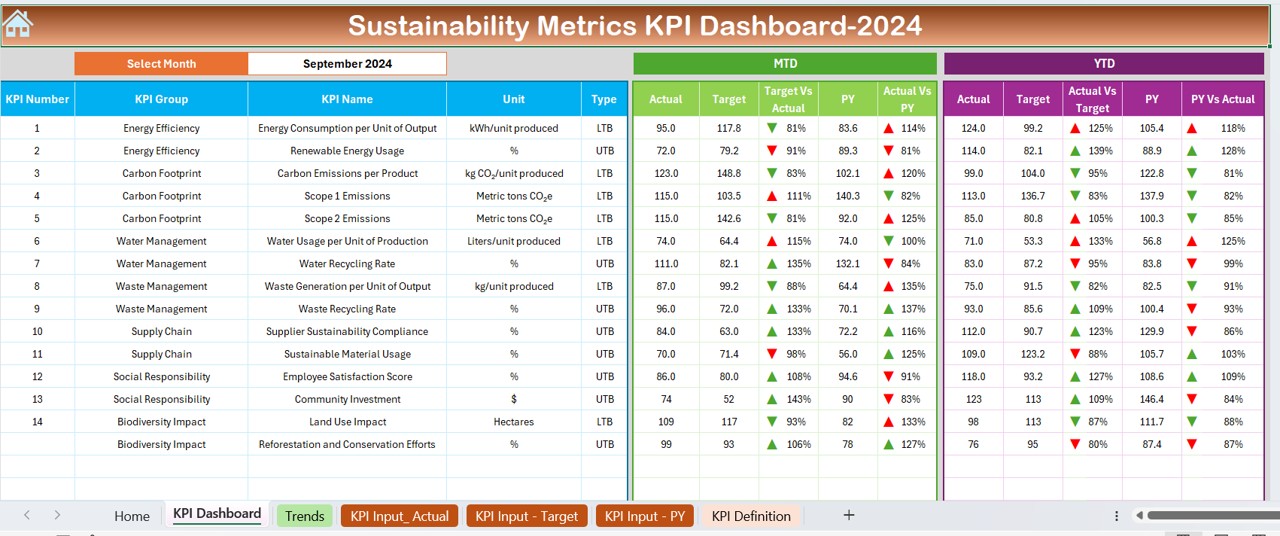
- The main data visualization page where all sustainability KPIs are displayed.
- A drop-down menu in cell D3 allows users to select a month.
- Displays MTD (Month-To-Date) and YTD (Year-To-Date) performance metrics.
- Compares Actual, Target, and Previous Year (PY) data.
- Uses conditional formatting with up/down arrows to indicate performance trends.
Click to Sustainability Metrics KPI
KPI Trend Sheet
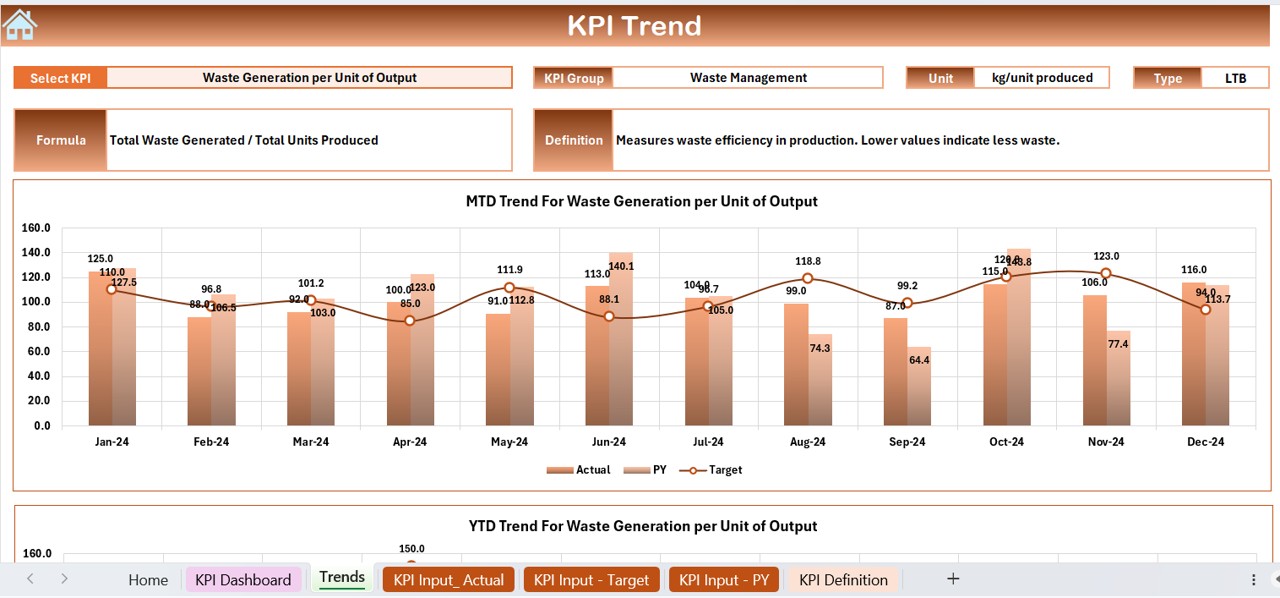
- Users can select a KPI using a drop-down list (C3).
- Displays relevant KPI details, including:
- KPI Group
- Unit of Measurement
- KPI Type (Lower the Better or Upper the Better)
- Formula used
- Definition of the KPI
- Visualizes MTD and YTD trends using interactive charts.
Click to Sustainability Metrics KPI
Actual Numbers Input Sheet
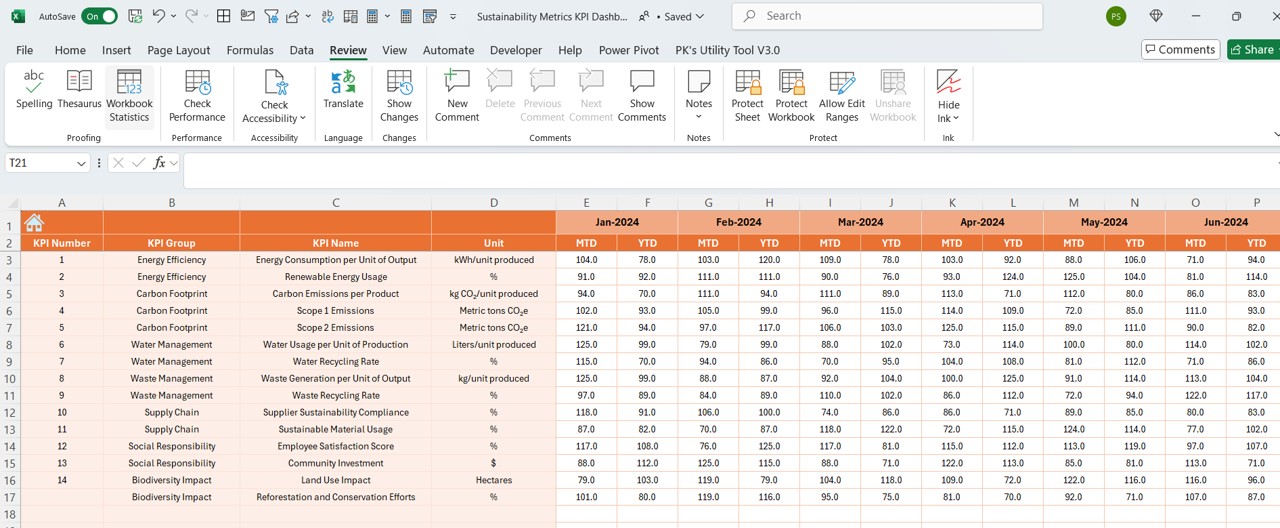
- Used to enter real-time data for MTD and YTD performance.
- Users can select the starting month (E1) for data input.
Target Sheet
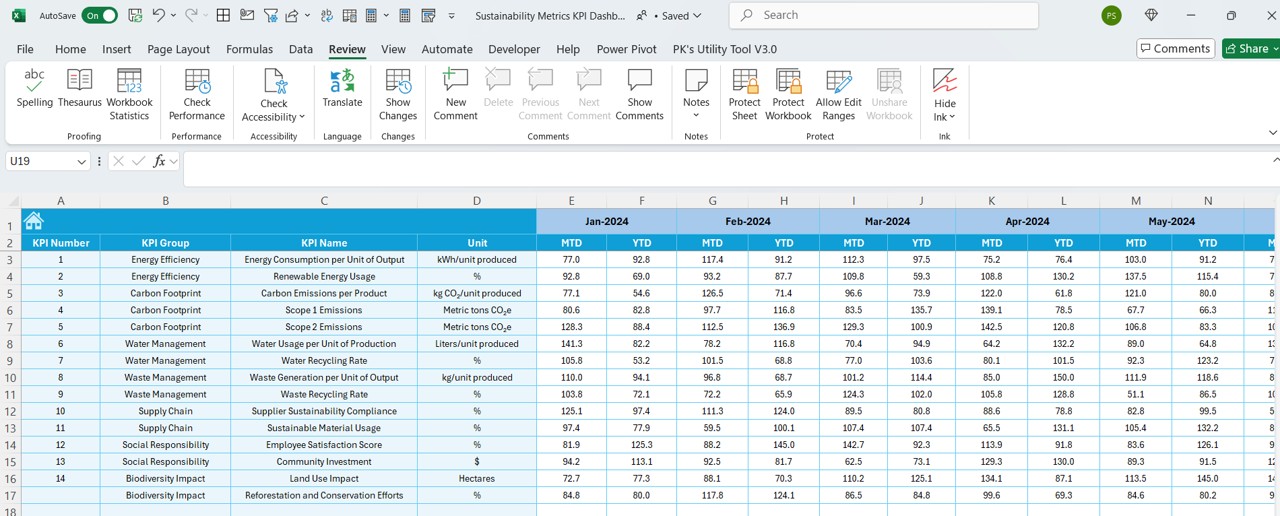
- Allows users to input monthly and yearly targets for each KPI.
- Supports MTD and YTD target values.
Previous Year Numbers Sheet
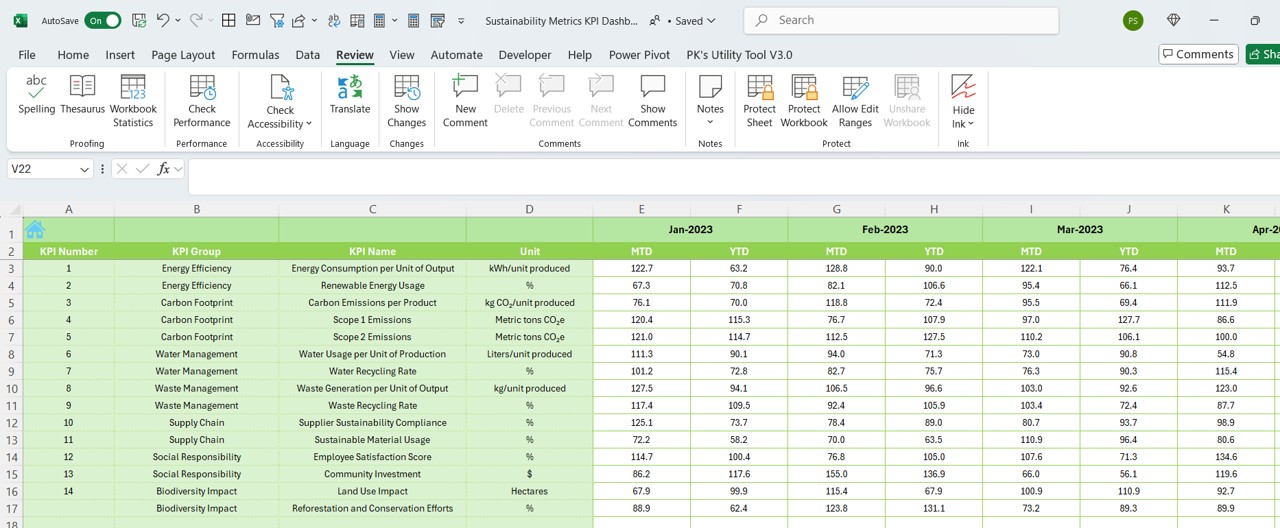
- Stores previous year’s data to facilitate easy comparison with current performance.
KPI Definition Sheet
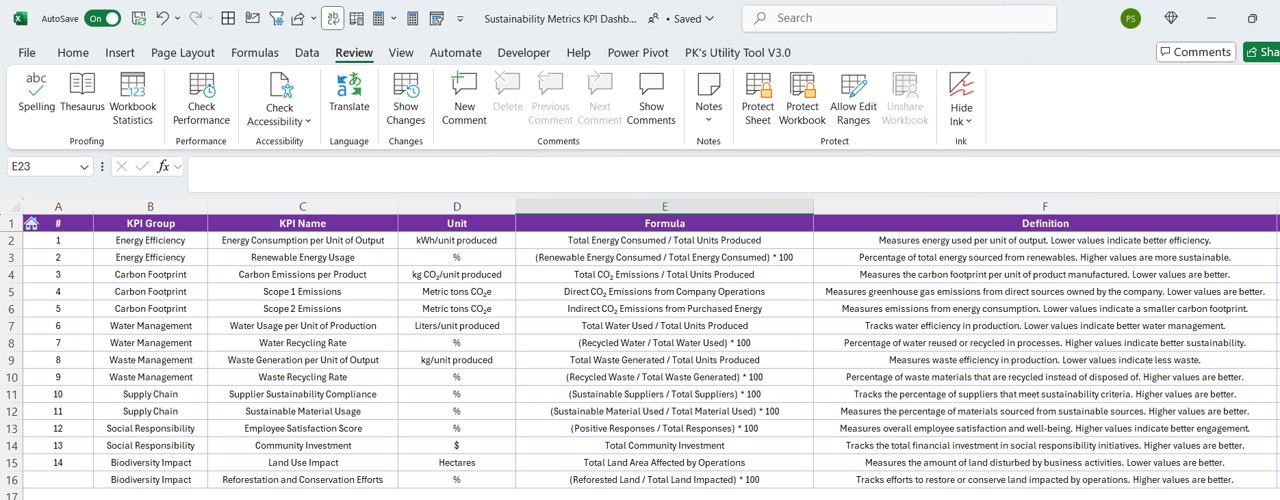
A dedicated reference sheet for all sustainability KPIs.
Click to Sustainability Metrics KPI
Includes:
- KPI Name
- KPI Group
- Measurement Unit
- Calculation Formula
- Definition and Purpose
Why Use a Sustainability Metrics KPI Dashboard?
- Accurate Data Tracking : By consolidating all data in one place, this dashboard eliminates manual errors and ensures accuracy.
- Better Decision-Making : With clear visualizations, businesses can quickly identify trends and make informed decisions.
- Simplified Data Comparison : The dashboard provides a structured way to compare actual performance against targets and previous year’s data.
- Time-Saving Automation : Automated calculations reduce the need for manual data analysis, saving time and effort.
- Fully Customizable : Users can adapt the dashboard to their specific needs by adding or modifying KPIs and formulas.
Best Practices for Using the Sustainability Metrics KPI Dashboard
- Update Data Regularly: For accurate tracking, make sure to input actual numbers each month and keep your targets updated.
- Set Achievable Targets: When setting goals, ensure they are realistic and aligned with previous trends and industry benchmarks.
- Leverage Conditional Formatting: Use color coding and arrows to quickly spot trends and areas that need improvement.
- Encourage Team Collaboration: Involve different departments in data collection to ensure a holistic approach to sustainability tracking.
- Use Trend Charts: Regularly check the KPI Trend Sheet to analyze performance over time and adjust strategies accordingly.
Conclusion
A Sustainability Metrics KPI Dashboard in Excel is an essential tool for organizations aiming to track and improve their sustainability performance. With automated calculations, trend tracking, and real-time comparisons, this dashboard provides valuable insights that can drive sustainable decision-making.
Frequently Asked Questions (FAQs)
Why is tracking sustainability KPIs important?
Tracking sustainability KPIs helps businesses measure and manage their environmental and social impact, ensuring compliance with sustainability standards and improving corporate responsibility.
Can this Excel dashboard be customized?
Yes! The dashboard is fully customizable. You can add new KPIs, modify formulas, and adjust targets based on your company’s sustainability goals.
How often should I update the dashboard?
It is best to update the dashboard on a monthly basis to ensure real-time tracking of sustainability metrics.
What kind of sustainability KPIs can I track?
You can track KPIs related to carbon emissions, water usage, energy consumption, waste management, employee well-being, and more.
Do I need advanced Excel skills to use this dashboard?
Not at all! The dashboard is designed to be user-friendly, and basic knowledge of Excel formulas and drop-down lists is sufficient to operate it efficiently.
Click to Sustainability Metrics KPI
Visit our YouTube channel to learn step-by-step video tutorials
View this post on Instagram


