In an era where cybersecurity is at the forefront of business operations, understanding and managing security performance is critical. The System Security KPI Dashboard is a powerful tool that allows businesses to track, monitor, and optimize their security processes. By leveraging Key Performance Indicators (KPIs), this dashboard provides an insightful overview of a system’s security status, helping organizations ensure their networks and data are protected.
This article explores the essential aspects of the System Security KPI Dashboard, including its features, KPIs, advantages, and best practices. We’ll also look at the opportunities for improvement and how this dashboard can enhance your security management strategy.
What is a System Security KPI Dashboard?
A System Security KPI Dashboard is a visual representation of various KPIs that measure the performance and health of an organization’s security infrastructure. By integrating KPIs into the dashboard, businesses can gain real-time insights into their security metrics, track progress, and make informed decisions. It helps monitor vital security indicators such as system downtime, malware infections, firewall violations, and data encryption.
This dashboard typically includes several worksheets, each focusing on a specific area of security monitoring, and offers a comprehensive view of security status over time. Businesses can then use the insights from these KPIs to make improvements and better protect their systems.
Key Features of the System Security KPI Dashboard
The System Security KPI Dashboard is a ready-to-use template designed to streamline security monitoring processes. It comes with 7 worksheets, each providing essential functionalities for effective security management:
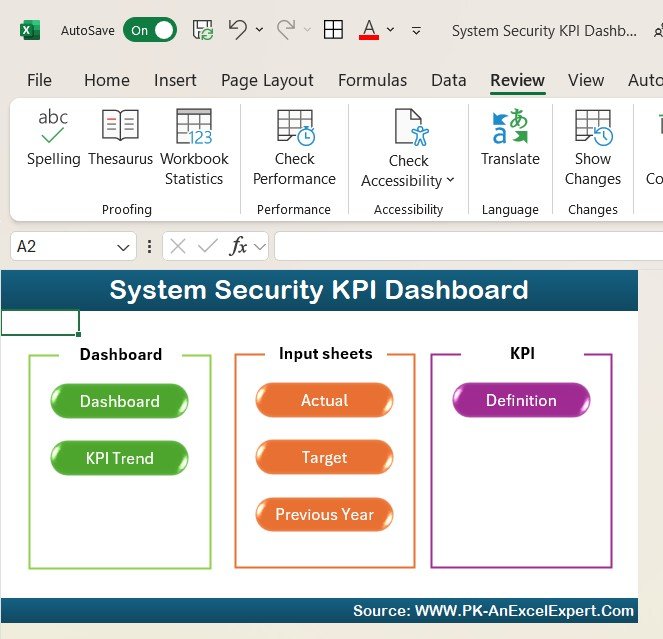
1. Home Sheet
- Purpose: Serves as an index, offering quick access to all other worksheets via six buttons for easier navigation.
Click to System Security KPI
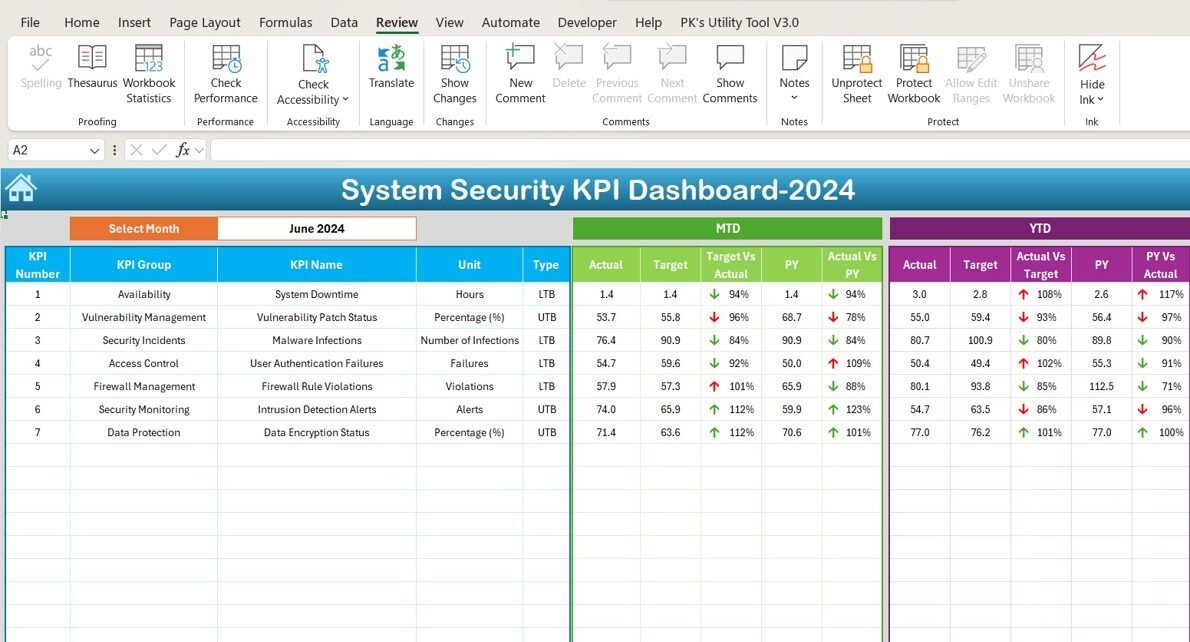
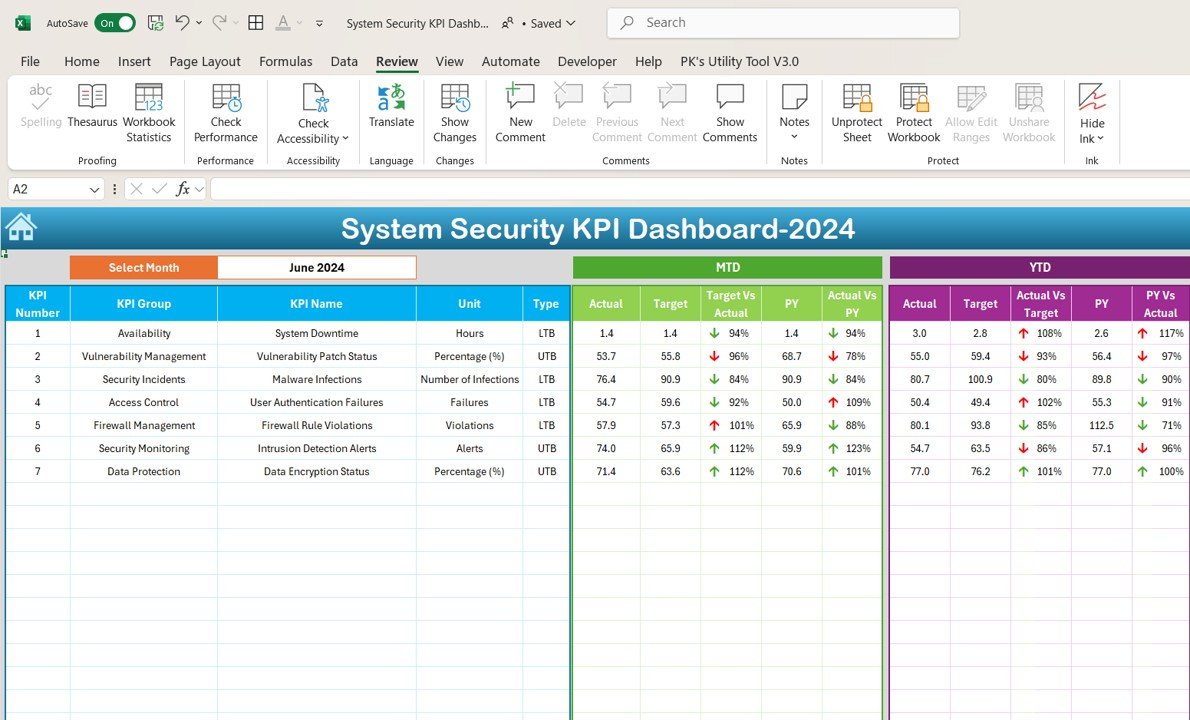
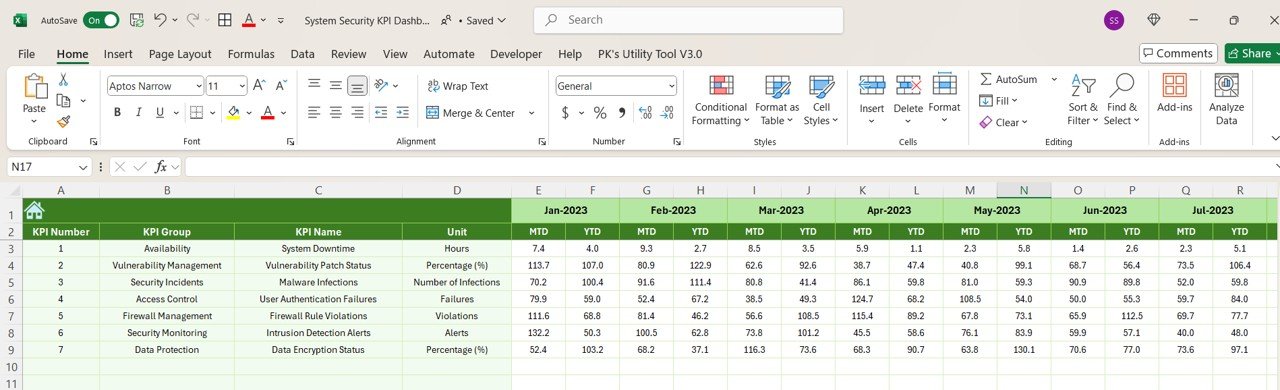
2. Dashboard Sheet Tab
Purpose: This is the primary sheet, showcasing all security-related KPIs. Users can select the month from a dropdown menu, and the data will automatically update to reflect Month-to-Date (MTD) and Year-to-Date (YTD) performance. The dashboard displays:
- MTD Actual data, Target, Previous Year data.
- YTD Actual data, Target, Previous Year data.
- Comparisons between Target vs Actual and PY vs Actual with conditional formatting showing up and down arrows.
Click to System Security KPI
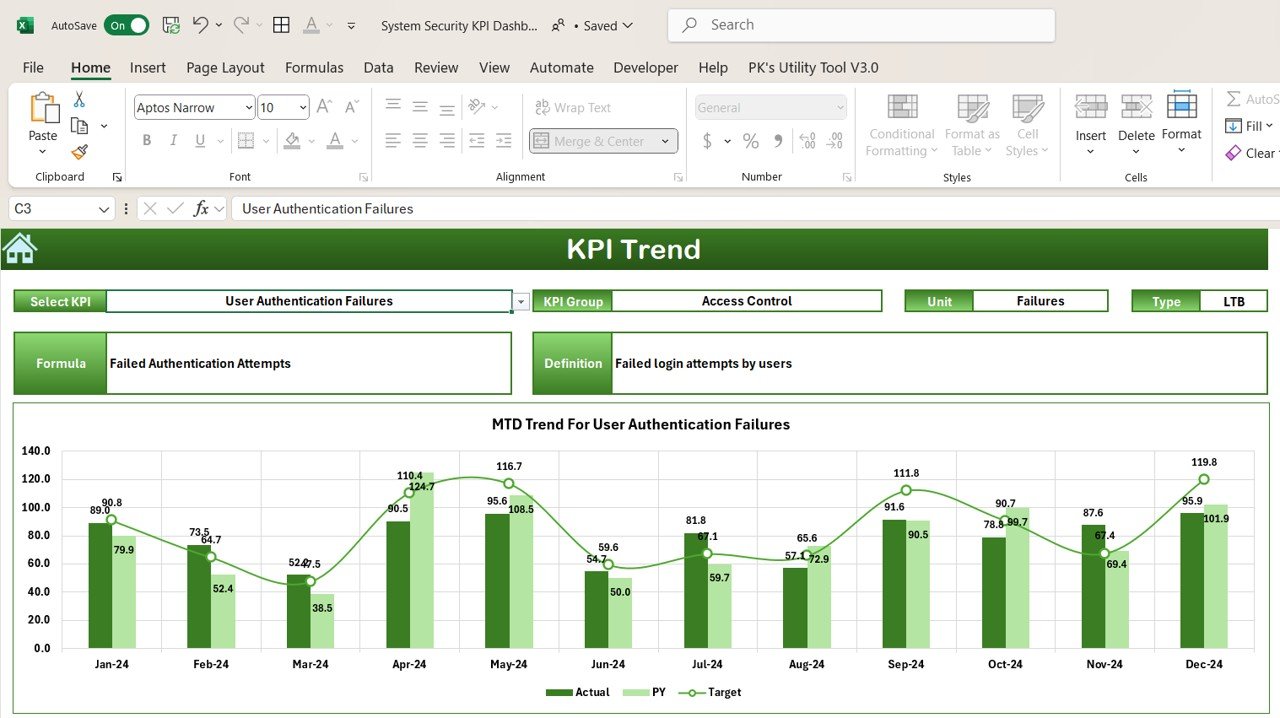
3. KPI Trend Sheet Tab
- Purpose: Allows users to select any KPI from a dropdown menu, where they can view the KPI Group, unit of measurement, type (whether “Lower the better” or “Upper the better”), formula, and definition.
Click to System Security KPI
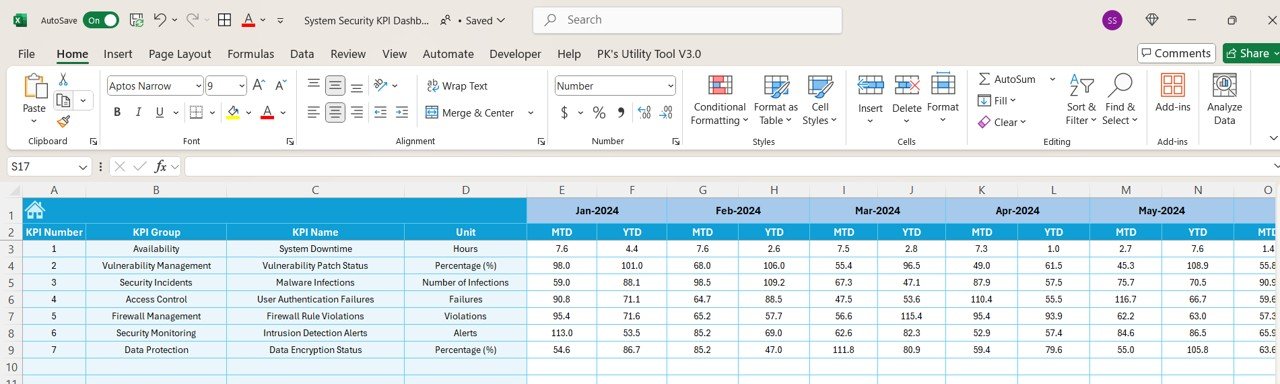
4. Actual Numbers Sheet Tab
- Purpose: Enables users to input the actual security metrics for MTD and YTD. This sheet is dynamic, allowing users to change the selected month, starting with the first month of the year.
Click to System Security KPI
5. Target Sheet Tab
- Purpose: Users enter target numbers for each KPI, both for MTD and YTD, to compare performance against actual figures.
Click to System Security KPI
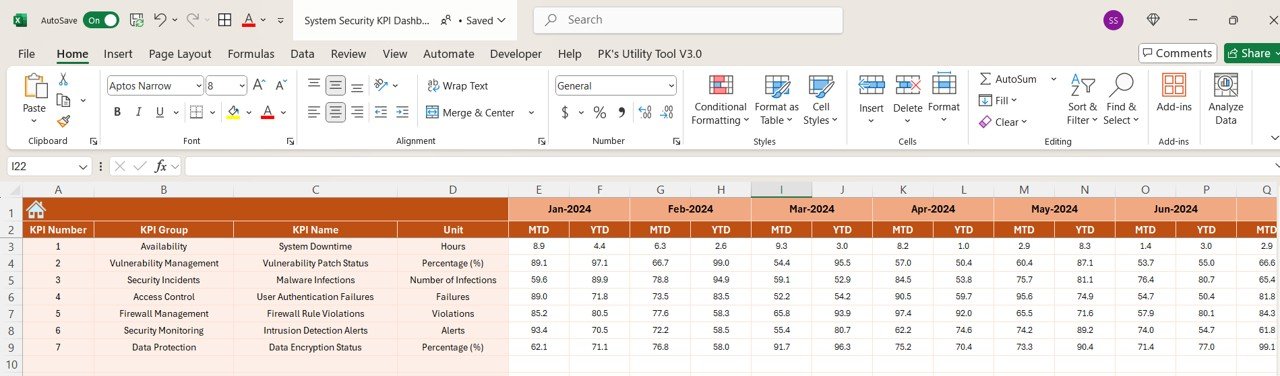
6. Previous Year Numbers Sheet Tab
- Purpose: Provides a place to input last year’s data for comparison with the current year’s metrics.
Click to System Security KPI
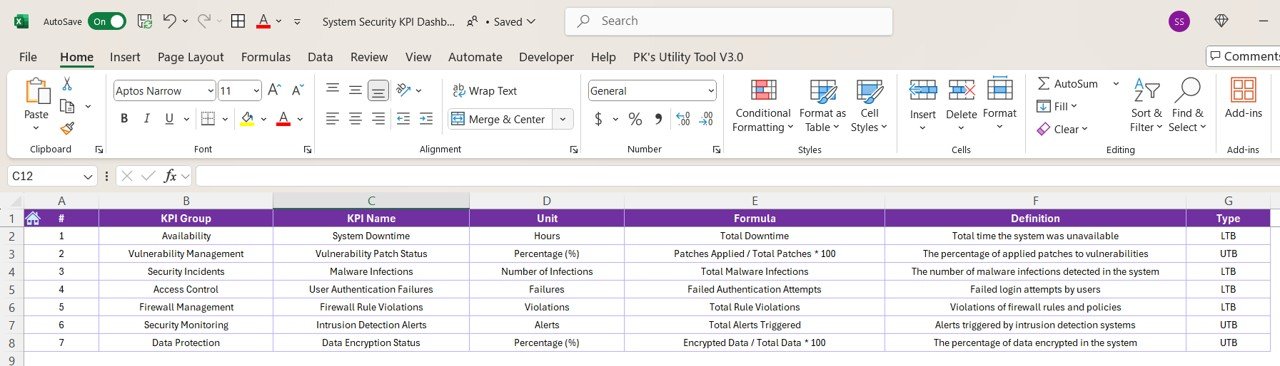
7. KPI Definition Sheet Tab
- Purpose: This sheet contains a detailed list of KPIs, their groupings, units, formulas, and definitions to help users understand the metrics and their significance.
Click to System Security KPI
Advantages of Using a System Security KPI Dashboard
- Real-Time Monitoring: The System Security KPI Dashboard provides real-time updates on the status of security KPIs, allowing for faster detection and resolution of security threats.
- Data-Driven Decision Making: The dashboard presents KPIs in a visual format, making it easy for security teams to make data-driven decisions based on current performance.
- Proactive Risk Management: By tracking and analyzing trends over time, businesses can identify potential security risks before they escalate, ensuring proactive security management.
- Performance Comparison: The dashboard allows businesses to compare current security metrics with targets and previous year data, making it easier to assess performance and identify areas for improvement.
Opportunities for Improvement in System Security
While the System Security KPI Dashboard is an essential tool for tracking security performance, there are always opportunities for improvement. Here are some key areas for growth:
- Automated Data Entry: Manual data entry can lead to errors and delays. Integrating automated data collection from security tools and systems would ensure accurate and up-to-date information.
- Advanced Analytics and Machine Learning: By incorporating advanced analytics and machine learning algorithms, businesses can predict security trends, detect emerging threats, and automate remediation steps.
- Enhanced User Interface: A more intuitive and aesthetically pleasing user interface would improve user experience, making it easier for security teams to interpret and act on the data.
Best Practices for Using the System Security KPI Dashboard
- Regularly Update Data: Ensure that MTD and YTD data are updated frequently for accurate and real-time performance monitoring.
- Focus on Key Security Metrics: Concentrate on the most critical KPIs such as system downtime, malware infections, and user authentication failures to improve security performance.
- Leverage Historical Data: Use historical data trends to analyze security patterns and develop strategies to address recurring security issues.
- Set Achievable Security Targets: Set realistic and achievable targets based on past performance and industry benchmarks to ensure continuous improvement in security metrics.
- Use Conditional Formatting: Implement conditional formatting (such as color coding or arrows) to quickly highlight areas that need attention, making the dashboard more actionable.
Frequently Asked Questions (FAQs)
What is a KPI in system security?
A KPI (Key Performance Indicator) in system security is a measurable value that demonstrates how effectively an organization is protecting its systems and data from security threats.
Why is system downtime an important KPI?
System Downtime is a critical KPI because it measures the availability of systems. Lower downtime ensures continuous operations and minimizes disruptions to business activities.
How can I improve my vulnerability patch status?
To improve your Vulnerability Patch Status, ensure timely updates to the system, automate patch management, and prioritize critical vulnerabilities.
What should I do if my system experiences a high number of malware infections?
If you experience high malware infections, strengthen your cybersecurity defenses, update your antivirus software, and conduct regular security audits to identify and address vulnerabilities.
Conclusion
The System Security KPI Dashboard is a powerful tool for businesses looking to monitor and enhance their security performance. By using the key performance indicators provided in the dashboard, organizations can proactively manage security risks, optimize network protection, and improve overall security efficiency. By following the best practices, improving areas of weakness, and continuously monitoring performance, businesses can ensure they remain secure in an ever-evolving threat landscape.
Visit our YouTube channel to learn step-by-step video tutorials