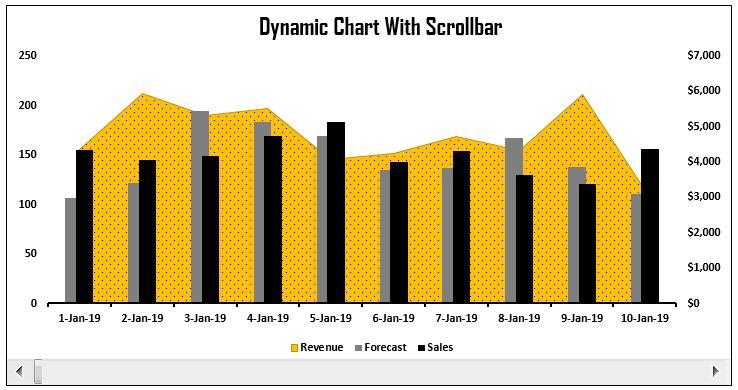
Dynamic Chart with Form Control Scrollbar
In this article, we have created a Dynamic Chart with Form Control Scrollbar. If we have multiple dates in your data, then we can use scrollbar on the chart to
Transforming Data into Decisions