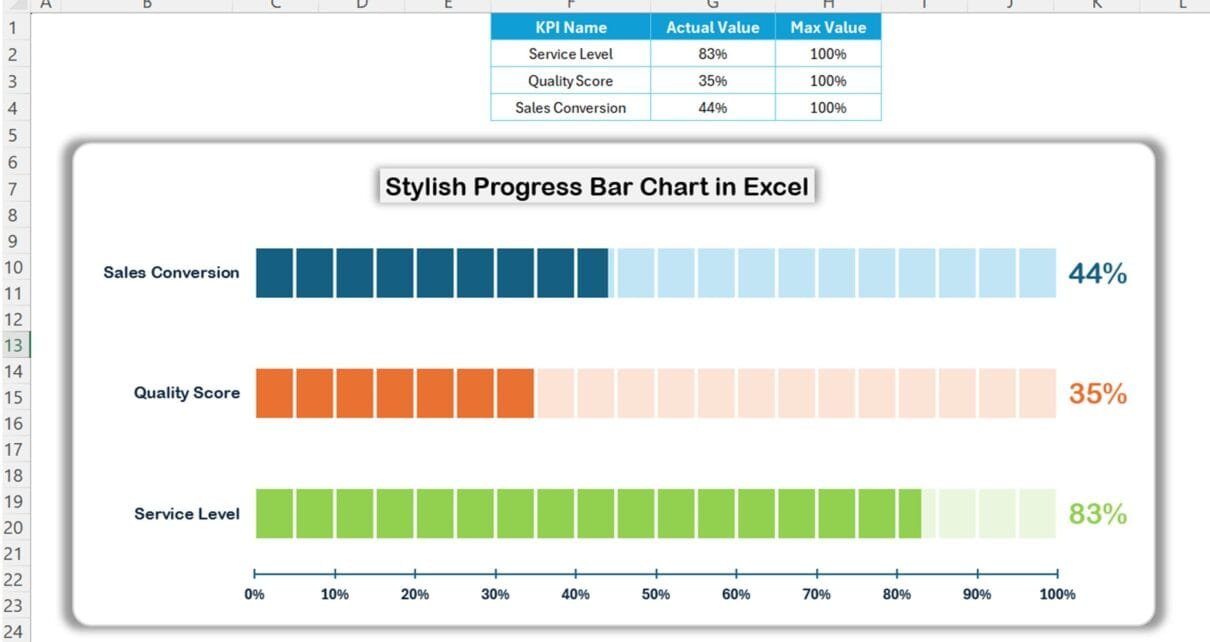
PKComments Off on Task Management Dashboard in Excel
A Task Management Dashboard is a visual representation of your tasks, deadlines, and progress. It allows you to track and manage your tasks effectively, ensuring that nothing falls through the
An income dashboard in Excel is a powerful tool that helps you track and analyze your income sources and financial health. This ready-to-use template can be utilized for both personal
PKComments Off on Teams Goal Graph with Football icon in Excel
Ever wondered how to make your data presentations stand out? Let's dive into how you can transform raw data into an engaging Teams Goal Graph with Football icon in Excel.
PKComments Off on Credit Rating Meter Chart in Excel
In this article, we will create a visually appealing Credit Rating Meter Chart in Excel. You can display a credit score, a Civil score, or any other key performance indicator
PKComments Off on Project Management Student Dashboard in Power BI
In today's digital age, data visualization and management play crucial roles in the education sector. We have created a Project Management Student Dashboard in Power BI. If you are running
PKComments Off on Sales funnel infographic chart in Excel
We can enhance your understanding of your sales process using our latest Sales funnel infographic chart in Excel. In this article we will guide you through the steps of transforming
PKComments Off on Show Data Dynamically using Vertical Scroll Bar in Excel
Struggling with endless data in Excel? Fear not! Our snazzy video, "Show Data Dynamically using Vertical Scroll Bar in Excel," is your ticket to simplicity and excitement in data handling.
PKComments Off on Road and Flag infographics chart in Excel
Introduction Welcome to our fun and informative corner! Today, we're going to unravel the magic behind creating a dynamic "Road and Flag infographics chart" in Excel. This isn't just a
PKComments Off on Master GROUPBY and PIVOTBY Function in Excel with Real-World Examples
Are you ready to unlock the full potential of Excel 365? In this engaging exploration, we delve into the powerful GROUPBY and PIVOTBY functions. These tools are game-changers for anyone
This website uses cookies to improve your user experience, analyze site traffic and serve targeted ads in accordance with our Privacy PolicyACCEPT
Privacy & Cookies Policy
Privacy Overview
This website uses cookies to improve your experience while you navigate through the website. Out of these cookies, the cookies that are categorized as necessary are stored on your browser as they are essential for the working of basic functionalities of the website. We also use third-party cookies that help us analyze and understand how you use this website. These cookies will be stored in your browser only with your consent. You also have the option to opt-out of these cookies. But opting out of some of these cookies may have an effect on your browsing experience.
Necessary cookies are absolutely essential for the website to function properly. This category only includes cookies that ensures basic functionalities and security features of the website. These cookies do not store any personal information.
Any cookies that may not be particularly necessary for the website to function and is used specifically to collect user personal data via analytics, ads, other embedded contents are termed as non-necessary cookies. It is mandatory to procure user consent prior to running these cookies on your website.